Binocular spatial induction for the perception of depth does not cross the midline Todd E. Hudson1, Leonard Matin, and Wenxun Li Clarence H. Graham Memorial Laboratory of Visual Science, Department of Psychology, Columbia University, New York, NY 10027 Communicated by Richard M. Held, Massachusetts Institute of Technology, Cambridge, MA, August 18, 2008 (received for review December 12, 2006)
Although horizontal binocular retinal disparity between images in the two eyes resulting from their different views of the world has long been the centerpiece for understanding the unique characteristics of stereovision, it does not suffice to explain many binocular phenomena. Binocular depth contrast (BDC), the induction of an appearance of visual pitch in a centrally located line by pitched-from-vertical flanking lines, has particularly been the subject of a good deal of attention in this regard. In the present article, we show that BDC does not cross the median plane but is restricted to the side of the visual field containing a unilateral inducer. These results cannot be explained by the use of retinal disparity alone or in combination with any additional factors or processes previously suggested to account for stereovision. We present a two-channel three-stage neuromathematical model that accounts quantitatively for present and previous BDC results and also accounts for a large number of the most prominent features of binocular pitch perception: Stage 1 of the differencing channel obtains the difference between the retinal orientations of the images in the two eyes separately for the inducer and the test line; stage 1 of the summing channel obtains the corresponding sums. Signals from inducer and test stimuli are combined linearly in each channel in stage 2, and in stage 3 the outputs from the two channels are combined along with a bias signal from the body-referenced mechanism to yield ⴕ, the model’s prediction for the perception of pitch. binocular depth contrast 兩 binocular retinal disparity 兩 stereoscopic vision
T
he primary neural mechanism for the binocular perception of depth is generally considered to have its basis in the image differences in the two eyes resulting from their horizontal offset (1–6). Whereas these binocular patterns alone produce accurate perceptions of the structure and orientation of many three dimensional forms (5) and other binocular phenomena (3, 6), this is not the case with Werner’s (7) ‘‘binocular depth contrast’’ (BDC) effect, where a pair of bilaterally symmetric pitchedfrom-vertical inducing lines influence the perception of visual pitch of a test line. Although the two classical explanations of BDC make use of binocular retinal disparity exclusively but in different ways (3, 4, 7, 8), later work has made it clear that more than disparity is involved (9–17), suggesting that perspective cues play a major supporting role, as in treatments of other binocular phenomena (18–20). In BDC, the perception of visual pitch is induced in a centrally located erect line by flanking sets of pitched-from-vertical lines (refs. 3, 4, 7, and 8; see also chapter 20 of ref. 6 for a review); here, the induced perception is opposite in direction to the pitch of the flanking lines, and its magnitude increases with the pitch of the flankers. Because an identical zero-disparity-gradient test line is generally perceived as erect when viewed in isolation, BDC has been of considerable theoretical interest to the study of depth perception. Given the historical importance of retinal disparity in stereovision and in the perception of depth, it is not surprising that patterns of disparity have provided the sole basis for the two classical explanations of BDC. In the earliest of these explanations, Werner (7, 8) suggested that roll-tilted binocular orientation disparity of the induction lines produced a central shift in 18006 –18011 兩 PNAS 兩 November 18, 2008 兩 vol. 105 兩 no. 46
the retinal loci signaling binocular correspondence, resulting in perceived pitch of the physically nondisparate test stimulus. Shortly afterward, Ogle (3) suggested an alternative interpretation based on ocular cyclotorsion. He proposed that a torsional ‘‘compulsion to fusion’’ generates ocular cyclorotations in the two eyes that bring the images of the inducing lines closer to the retinal meridia normally stimulated by vertical lines in the erect observer and, thus, results in a gradient of binocular retinal disparity in the images of the erect test stimulus. In contrast to the Werner interpretation, the Ogle interpretation assumes stable binocular retinal correspondence. Although different in their attribution of the source of the induction effect, both theories rely exclusively on disparity information to drive their theoretical predictions; neither the data available at the time nor subsequently provide a basis for preferring one or the other of the two theories. Although several subsequent investigators have demonstrated depth contrast under various conditions (refs. 11, 13, 17, and 21–24 and figure 6 in ref. 21), only van Ee, Banks, and Backus (13) have proposed a mechanism of the effect in addition to those of Werner and Ogle. The essence of their hypothesis was that depth contrast is based on a cue conflict that is present with stereogram-generated stimuli but not with real stimuli. However, it had already been shown by Ogle (3) and several other investigators (e.g., refs. 21 and 24), in experiments using real stimuli, that such cue conflict could not be the sole basis for the effect, because a robust illusion was produced with real stimuli. In addition, Sato and Howard (17) subsequently concluded through their own experiments that a stereo-perspective conflict was not necessary for the production of a depth contrast effect, although it could modulate the effect when present. As will be seen below, the current results provide another example in which BDC is obtained with real stimuli, in contrast to the predictions of the cue-conflict account of the illusion. The sign of the orientation of the monocular image of a pitched-from-vertical line in each eye (its ‘‘retinal orientation’’*) reverses with change of the line’s laterality [parallel transport of the line; supporting information (SI) Fig. S1], but the sign of the vertical gradient of horizontal disparity (the ‘‘orientation disparity,’’ the difference between the retinal orientations in the two eyes) remains unchanged. This combination of invariance of Author contributions: T.E.H., L.M., and W.L. designed research, performed research, analyzed data, and wrote the paper. The authors declare no conflict of interest. 1To
whom correspondence should be sent at the present address: Department of Psychology and Center for Neural Science, New York University, 6 Washington Place, New York, NY 10003. E-mail:
[email protected]
*Retinal orientation () refers to the orientation of the great circle containing the projected image of a line on the spherical approximation to the eye. (Retinal orientation does not refer to the orientation of the eye itself.) Projection on the sphere is through a pupil centered on an opaque surface at the sphere’s midfrontal plane. The retinal orientation of a line is defined by the angular distance between the intersection of that great circle with the circumference of the sphere’s midfrontal plane and the sphere’s north pole ( ⫽ 0) with clockwise positive (see Fig. S1). This article contains supporting information online at www.pnas.org/cgi/content/full/ 0807385105/DCSupplemental. © 2008 by The National Academy of Sciences of the USA
www.pnas.org兾cgi兾doi兾10.1073兾pnas.0807385105
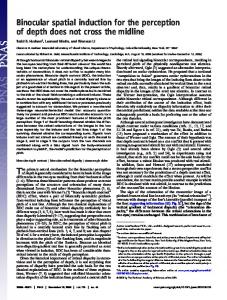
Fig. 1. Each of the three experiments used a subset of the four self-luminous, phosphorescent stimulus lines (two long inducer lines and two short test lines), along with the self-luminous fixation target, which were viewed by the subject (whose two eyes are represented by the two circles in the lower left) in otherwise complete darkness. All of the regions shown as gray were painted flat black along with all of the cross-pieces and stands. The four stimulus lines are represented by the white vertical stripes in the centers of the vertical gray bars; the fixation target is represented by the white dot in the center of the frontmost horizontal bar. As shown by the two-headed arrows to the right of the horizontal crossbars, both the inducer lines and the test lines could be rotated in the pitch dimension and set at any angle of pitch by rotation of the crossbar on which they were mounted. See Methods: Apparatus for more detail.
the sign of the disparity and reversal of the signs of the two monocular orientations provides a unique advantage for an examination of BDC in which the asymmetry of test and inducing lines are manipulated independently. However, because all previous studies of BDC have exclusively used test stimuli in the subject’s median plane or in which the test stimulus and the inducing stimulus were both symmetrically arranged about the subject’s median plane, the opportunity has been missed. Our experiments eliminate these restrictions and as a result have uncovered one of the unusual features of BDC: the failure of spatial induction to cross the midline. This approach has also led us to develop a model that alone provides a basis for the depth contrast illusion that is consistent with existing data and predicts the failure of induction to cross the midline. The Homolateral Restriction on Spatial Induction Exp. 1: Bilaterally Symmetric Inducing and Test Stimuli. Our first
condition (Fig. 1) used bilaterally symmetric inducing and test stimuli consisting of two parallel, 77°-long inducing lines at ⫾25° horizontal eccentricity and two parallel, 33o-long test lines at ⫾8.3° eccentricity, respectively. These stimuli provided a direct bridge between our next experiments with test stimuli off the median plane and the previous work that had used a bilaterally symmetrical inducer along with a single test stimulus centered on the median plane. Varying the pitch of the inducer significantly influenced the angular setting of the test-line pair that appeared erect to the subject [visually perceived erect (VPE)] (Fig. 2). Sensitivity to Hudson et al.
the variation of the pitch of the flanking inducing lines provides a measure of the depth contrast effect. We employ the slope of the VPE-vs.-pitch function as our measure of the magnitude of BDC. The average slope of the VPE-vs.-pitch function was 0.35, which is comparable with those measured by Werner (7, 8) and Ogle (3), as well as by Poquin et al. (23), who used a very similar real stimulus, although these earlier experiments had used a single test line in the median plane. There was considerable consistency across sessions by the individual subjects, as indicated by the 1.0 regression between the slopes of the two sessions across the subjects. The average y-intercept of the VPE-vs-pitch function was 2.3°, not significantly different from the average value of 2.9°, measured in darkness without the inducing stimulus (dVPE). Exp. 2: Bilaterally Asymmetric Inducing and Test Stimuli. Removing
one inducer and one test line from the four-line stimulus yields the four different two-line configurations that we used in Exp. 2: two with the inducing line and test line on the same side of the median plane (‘‘same-side’’ configuration) and two with the inducing line and test line on opposite sides of the median plane (‘‘opposite-sides’’ configuration) (Fig. 2). Inducer and test lines on same side of the median plane. In separate sessions, each of the two 1-line inducers was presented at each of six equally spaced pitches (⫺25° to ⫹25°) along with the test line on the same side of the median plane. These same-side configurations produced a significant depth contrast effect. The average 0.35 VPE-vs.-pitch slope (Fig. 2) duplicated the value measured for the bilaterally symmetric four-line inducer. This pattern of results—indistinguishable slopes for the same-side and four-line configurations—was found for each of the individual subjects, despite differences in individual subjects’ slopes, which ranged from 0.20 to 0.45. The y-intercept of the VPEvs-pitch function was 3.6°, not significantly different from the average of the dVPE settings for this configuration (4.6°). Inducer and test lines on opposite sides of the median plane. In sharp contrast to the two conditions described above, no significant effect of changing the pitch of the inducing line was measured in the two sessions in which single test and inducing lines were presented on opposite sides of the median plane (Fig. 2). The average slope (0.04) was not significantly different from zero. PNAS 兩 November 18, 2008 兩 vol. 105 兩 no. 46 兩 18007
NEUROSCIENCE
Fig. 2. Average VPE results for four subjects in Exp. 1 (four-line condition) and Exp. 2 (same-side and opposite-sides two-line conditions) are displayed along with sketches of the three stimulus conditions. The two dashed lines result from the fitting of the two-process, three-stage model (Fig. 3) to the results of Exp. 2. For all subjects and conditions, settings were made with a standard error of at most ⬇1°.
S1). The first stage (Fig. 3) involves subtractive processes that compute the orientation disparity between the two eyes for the test line and the inducing line as ␦T ⫽ lT ⫺ rT and ␦I ⫽ lI ⫺ rI, respectively. The summing process computes the corresponding sums of the image orientations as 兺T ⫽ lT ⫹ rT and 兺I ⫽ lI ⫹ rI, respectively. In the second stage, the difference signals for test and inducing lines, ␦T and ␦I, are linearly combined in the difference channel by the function g␦; the sum signals for test and inducing lines, 兺T and 兺I, are linearly combined in the sum channel by the function g兺. The linear transforms used by g␦ and g兺 yield ⬘␦ and ⬘兺, the inputs to the third stage:
Fig. 3. The neural network for the two-process, three-stage model that accounts for BDC. Stage 1 generates sums and differences of the retinal orientations in the left and right eyes for the test line (兺T, ␦T) and inducing line (兺I, ␦I). By employing Eq. 1b, the difference signal for the test line (␦T) is linearly combined with the difference signal for the inducing line (␦I) to yield the output of the difference channel (␦⬘) from g␦; by employing Eq. 1a, the sum signal for the test line (兺T) is linearly combined with the sum signal for the inducing line (兺I) to yield the output of the sum channel (兺⬘ ) from g兺. The combining weights for the test and inducing lines are introduced at the inputs to g兺 and g␦. Stage 3 combines the outputs of the sum and difference channels together with the biasing constant, , to yield ⬘, the perception of pitch of the test line.
With the exception of subject TL, who showed a small increase in VPE with the ⫹25° inducer, none of the individual subjects’ slopes differed significantly from zero. Individual subjects’ VPEvs-pitch intercepts (mean ⫽ 4.3°) were indistinguishable from the average of their dVPE settings (mean ⫽ 4.3°). Differences in interstimulus distance fail to explain the restriction. Because the separation between inducing and test lines is larger for the opposite-sides than for the same-side configuration (33.5° vs. 16.5°), the difference in the magnitude of induction that was observed in those conditions might be the consequence of a process whose potency diminishes with distance. However, in several subsequent experiments in which we measured depth contrast with a single test line and an inducing line at a large number of different eccentricities and separations for both same-side and opposite-sides inducers, no effect of distance that could explain the same-side/opposite-sides difference was obtained (Fig. S2). This lack of an effect of interstimulus distance to explain the magnitude of BDC is consistent with the results of van Ee and Erkelens (12). Previous theories cannot predict failure of induction across the midline.
The difference between same-side and opposite-sides results cannot depend solely on changes in binocular correspondence or cyclovergence due to the induction line: Any changes in the central representation of corresponding points or in the state of cyclovergence that produced a change in the same-side condition would be expected to induce a similar change in the oppositesides condition. Each of the models referred to above—both those that depend exclusively on horizontal binocular retinal disparity and those that employ additional processes such as a difference in perspective—fails to predict the loss of effectiveness of the inducer on the test line for the opposite-sides configuration. We now present an interpretation that does predict the homolateral restriction. Two-Process, Three-Stage Neural Model for BDC Basics of the Model. The model consists of a series of three stages that operate on the stimulation from the inducing lines and the test line to yield the perception of the test line’s pitch. It is based on the linear combination of two processes that operate on information about retinal orientation, , from the two eyes (Fig. 18008 兩 www.pnas.org兾cgi兾doi兾10.1073兾pnas.0807385105
⬘␦ ⫽ g␦共␦T,␦I) ⫽ k ␦共 ␦ T⫺␦␦I)
[1a]
⬘⌺ ⫽ g⌺共⌺T,⌺I) ⫽ k ⌺共⌺ T⫺⌺⌺I).
[1b]
The third stage obtains the final predicted pitch percept of the test line, ⬘, by generating a weighted combination of ⬘␦ and ⬘兺 (here a simple average is used); thus:
⬘ ⫽ 1⁄2 共⬘␦ ⫹ ⬘⌺兲 ⫹ .
[2]
where  is an idiosyncratic constant. The k and parameters of Eqs. 1a and 1b possess different properties: k␦ and k兺 are based on the physical geometry relating physical pitch and retinal orientation independently of perception. Thus, the physical pitch of the isolated test line is nearly linear with both ␦T and 兺T over a ⫾25°-range with k⬘␦ ⫽ dT/d␦T and k⬘兺 ⫽ dT/d兺T. At the test line’s 8.33° eccentricity, the best-fitting values are k⬘␦ ⬇ 8.78 and k⬘兺 ⬇ 3.25. By identifying k␦ and k兺 in Eqs. 1a and 1b with k⬘␦ and k⬘兺, we treat them as representing the model’s estimate of sensitivity of perceived pitch, ⬘␦ and ⬘兺, to variation in the difference and sum of retinal orientations, respectively. When the inducer is absent, Eqs. 1a and 1b reduce to ⬘␦ ⫽ k␦␦T and ⬘兺 ⫽ k兺兺T, involving the k parameters only (without ), and k␦ ⬇ ⬘␦/␦T and k兺 ⬇ ⬘兺/兺T. Thus, whereas the k⬘ values transform physical pitch () to ␦T and 兺T, the k values ‘‘reverse’’ the mapping and transform ␦T and 兺T into perceived pitch (⬘). On the other hand, the values of the parameters are empirically determined from fits of the model to the depth contrast data. Each of these values determines the relative weights of the influences from the inducing stimulus and the test line itself on one of the two processes, and the k value scales the weighted difference between the two processes. In the Introduction, we pointed out the importance of invariance of the sign of the binocular disparity and reversal of the sign of the monocular orientations for a single pitched line viewed in the right or left visual field. In the model, whereas the sign of the difference signal, ␦, is identical for a line of the same pitch on both sides of the median plane, the sign of the sum signal, 兺, is reversed on the two sides; this behavior of signs in the model corresponds to the physical geometry of the binocular view and is a direct consequence of it. Model Predictions of BDC. The model’s predictions from Eqs. 1a and 1b for the slopes and y-intercepts of the VPE-vs.-pitch function for the same-side and opposite-side one-line inducer in Exp. 2 are excellent (Fig. 2). The dashed line with a slope of 0.35 and a y-intercept of 3.42° is the prediction for the same-side condition; the dashed line with a slope of 0.00 and a y-intercept of 3.42° is the prediction for the opposite-sides condition. An example of our fitting the model to data is outlined in Fig. 4 for an inducing line pitched 15° topbackward on the right (Upper) or left (Lower) sides of the median plane with eccentricity ⫹25° and ⫺25°, respectively, and a test line at 8.3°eccentricity on the right side of the median plane both Upper and Lower. The test line is pitched at the measured VPE in Fig. 2 Hudson et al.
Fig. 4. Examples of the predictions for the same-side (Upper) and oppositesides (Lower) conditions with the inducing line pitched topbackward by 15° in Exp. 2 (Fig. 2) after calculation of the least-squares best fit parameters (k兺, k␦, 兺, ␦, and ) displayed at the top. The predictions in both cases are for the erect perception (i.e., ⬘ ⫽ 0) of the test line at the VPE. The numerals designated by arrows near the top of the spherical approximation to an eye are the retinal orientations of the image of the test or inducing line measured along the circumference of the sphere’s midfrontal plane (relative to its north pole; see Fig. S1). These serve as inputs to stage 1 of the model (see TwoProcess, Three-Stage Neural Model for BDC for more detail).
(⫺2.1° and 3.9° for the same-side and opposite-sides conditions, respectively). The fits to the model shown in Fig. 2 were obtained from Eqs. 1a and 1b by employing best-fitting values of ␦ and 兺 (0.581 and 0.106), k␦ and k兺 (8.78 and 3.25), and  (⫺3.42°). For the example in Fig. 4, with the one-line inducer on the right side of the median plane, ␦I and 兺I equal ⫺1.0 and ⫺14.2, respectively; with the one-line inducer on the left side of the median plane, ␦I and 兺I equal ⫺1.0 and ⫹14.2, respectively. With empirical VPE values of ⫺2.1° and 3.9°, the model predicts ⬘ ⫽ ⫺0.32° and 0.23°, respectively. Both of these predicted values approximate 0°, as expected because all of the test line settings in the experiments in Fig. 2 were to a perceptual criterion of ‘‘erect.’’ Similar calculations for the other inducer pitches employing the same parameter values for k␦, k兺, ␦, 兺, and  predict approximate values of ⬘ ⫽ 0° corresponding to linear increase of VPE with inducer pitch in the same-side condition and invariance of VPE with inducer pitch in the opposite-sides condition. Experiment 3: Three-Line Configuration The model was constructed by following our discovery of the homolateral restriction on spatial induction and was specifically designed to account for it. Thus, it seemed desirable to carry out an experiment in which the outcome could further distinguish the model from earlier interpretations: The earlier theories based on unstable binocular correspondence or cyclovergencemediated compulsion-to-fusion, suggest increased BDC with an Hudson et al.
increase in the number of lines in the inducer without regard for inducer and/or test laterality. However, the two-process model makes three additional predictions: (i) that no change in the slope of the VPE-vs.-pitch function would result from adding an opposite-sides line to a same-side inducer that itself produces a substantial slope, (ii) that adding a same-side inducer to an opposite-sides inducer would convert a zero slope to the same substantial slope measured in the same-side condition, and (iii) that removing a test line from the four-line condition would have no effect on the measured BDC. All three of these predictions can be examined simultaneously by using a three-line configuration consisting of two inducing lines and a single test line. Thus, we used a three-line configuration in Exp. 3. The test line was located in the left visual field in one session and in the right visual field in the other session; there was no difference between the results in the two sessions, and the results were averaged. The results (Fig. 5) support the slope predictions from the two-process, three-stage model for each of the three subjects: As is apparent in Fig. 5, the BDC slope for the three-line condition was not significantly different from the two-line same-side condition (or from the four-line condition) but did differ significantly from the opposite-sides condition. Thus, increasing the number of lines in the inducer without regard to laterality does not necessarily increase the BDC effect. Discussion The present model predicts the discovery of a homolateral restriction on the spatial induction of BDC as well as the results of Exp. 3, which was specifically designed to test the model. It also predicts the results of other types of binocular measurements. Of particular interest are visual- and manual-pitchmatching experiments using large-field pitched stimuli; for example, those of Li and Matin (25); Hudson, Li, and Matin (26); Pierce, Howard and Feresin (23); and Post, Teague, Welch, and Hudson (27), all of whom report approximately veridical pitch matching with various large or full-field, pitched-line stimuli. PNAS 兩 November 18, 2008 兩 vol. 105 兩 no. 46 兩 18009
NEUROSCIENCE
Fig. 5. Results of experiment with the 3-line configuration. (A–C) Individual VPE results for each of the three subjects in Exp. 3 for the three-line condition are displayed alongside their results from Exp. 1 for the four-line condition and Exp. 2 for the same-side condition (A, subject CD; B, subject JV; C, subject TH). Triangles, diamonds, and squares represent two-line same-side, threeline, and four-line conditions, respectively. (D) The results for the oppositesides condition. The stippling in each subject’s panel (A, B, and C) is used for the same subject in D. For all subjects and conditions, settings were made with a standard error of at most ⬇1°.
In addition, there have been reports from two different laboratories in which a positive bias of ⬇3°—very similar to the values in the present experiments—has been found in experiments involving pitch induction in measurements of both dVPEs and the y-intercept of VPE-vs.-pitch functions employing both a square-outline-inducing frame in otherwise complete darkness (24) and induction by a fully structured, well illuminated pitchroom under binocular viewing conditions (28). The VPE bias has been attributed to the body-referenced mechanism† (28). A two-channel approach similar to the present one was used by Cohn and Lasley (29) for interpreting their absolute-threshold detection experiments on binocular luminance summation: One channel calculated the sum of the luminances to the two eyes, and the other calculated the luminance difference. Their treatment fitted their experimental summation results well. However, they also noted (29, 30) that a single additive mechanism readily predicts their binocular luminance summation results, as had already been shown for results with the identical elliptical form for monocular luminance summation with a variable temporal interval (31, 32). Cohn, Leong, and Lasley (30) subsequently carried out suprathreshold discrimination and recognition experiments, which they interpreted by a two-channel model with sum and difference channels in the context of signal/noise modeling. However, they recognized the limitations of this approach for deciding between one-channel and two-channel mechanisms in their threshold summation experiments, and the door remained open for a single-channel interpretation of their original summation results. No similar limitation exists for the interpretation of our BDC experiments. Although a single difference channel based on binocular disparity could account for previous work on BDC, we know of no single-channel model that can account for the results containing the homolateral restriction. For the same-side configuration, the neural signals regarding both induction and test stimuli travel via the optic tract to primary visual cortex in the same cerebral hemisphere, whereas for the opposite-side configuration the signals for inducing and test lines go to primary visual cortex of opposite hemispheres. Neurophysiological evidence for a summing channel in V1 was first presented in the original Hubel and Wiesel work with cats (33) and monkeys (34), and subsequent work by Pettigrew and his colleagues (35) showed summation peaks at different amounts of binocular retinal disparity in different neural units. This work could have provided the basis for a homolaterally restricted induction process consistent with the present results and would provide a sufficient basis for explaining them. However, given the lack even of processing consistent with the basic properties of binocular stereovision in V1 (36, 37), there are reasons for looking further for an explanation: The considerable cross-hemispheric connections at the later stages of visual processing (e.g., V4), along with a substantially shared representation of both visual fields intrahemispherically (e.g., refs. 38 – 42), are consistent with the
possibility of a pair of channels encoding both sums and differences of retinal orientations and provide a biologically plausible basis for modeling depth contrast by using such channels (see SI Text). Methods Apparatus. A phosphorescent circular fixation target (12⬘ radius) centered in the median plane of the observer at eye level was used to permit systematic control of the retinal eccentricity of both the inducing and test stimuli. Either one or two long, thin phosphorescent inducing lines (77° ⫻ 4⬘ when erect) were presented at horizontal eccentricities 25° to the right and/or left of the fixation target (measured within the plane of the observer’s eye level); either one or both were presented in a given condition. Either one or two thin phosphorescent test lines (33° ⫻ 6⬘ when erect) were presented at eccentricities of 8° 20⬘ to the right and/or left of fixation. The test and inducing lines were mounted on independent horizontal axes within the observer’s frontal plane at distances of 0.6 and 1.0 m, respectively, which allowed the pitch of the inducing lines to be set independently of the pitch of the test lines. Each line was centered at the observer’s eye level. The stimulus lines and fixation target were the only sources of illumination present while the observer was performing discriminations in the light-tight testing room. The luminance of the phosphorescent material was ⬇0.01 ml (EG&G photometer/radiometer 550). To maintain their visibility, the room lights were turned on periodically while the subject sat with his/her eyes closed. No other objects or features of the room were visible to subjects at any time during testing. Line Configurations. In Exp. 1, a bilaterally symmetric four-line configuration was used (Fig. 1) consisting of two inducing and two test lines. In Exp. 2, four configurations consisted of a single, eccentrically positioned inducing line and a single test line. Two asymmetric configurations presented test and inducing lines on the same side of the median plane (same-side configurations), and two presented test and inducing lines on opposite sides of the median plane (opposite-sides configurations). In Exp. 3, the two configurations consisted of both inducing lines and a single test line. Procedure. Using the nulling technique that had been used in previous work, BDC was measured by requiring subjects to adjust the physical pitch of the test stimulus to appear erect (VPE). During each session, six measurements each were obtained for inducing pitches from ⫹25° to ⫺25° (10° increments) in random order. The magnitude of BDC was taken as the slope of the response function. At the beginning and end of a session, three settings in the absence of any inducing lines were also made (dVPE). dVPE settings served as a measure of the perception of the erect orientation of each test stimulus in the absence of any visual surround. In addition, dVPE settings served to verify that the internally referenced standard relating to the erect pitch orientation, against which subjects presumably compared their visual percept of the test stimulus, did not change during the session. Exp. 1 consisted of two sessions. The identical four-line stimulus was presented in both sessions. Exp. 2 consisted of four sessions, one for each of the possible combinations of a single inducing and single test line taken from the four-line stimulus of Exp. 1. Exp. 3 consisted of two sessions, one for each configuration. Subjects. In Exps. 1 and 2, subjects were three Columbia University students who were naive regarding the experimental hypotheses and one of the authors (T.E.H.). Student subjects were paid for their participation. All but one of the subjects from Exps. 1 and 2 participated in Exp. 3.
†Body-referenced mechanism (43) refers to the combination of all influences on perceived
eye level from extraretinal eye position information, extraretinal head orientation information including information regarding the head relative to the body and from the head relative to gravity), other effects of gravity on the body, pressure cues from the surfaces of the body, joint receptors, the vestibular organ, and from the visual field extrinsic to the target employed to measure perceived eye level itself.
ACKNOWLEDGMENTS. This work was supported by Grant 1-F31-MH12401-01 from the National Institute of Mental Health Neuroscience Division (to T.E.H.), Grant EY 10534 from the National Institutes of Health National Eye Institute (to L.M.), and Grant BCS-06-16654 from the National Science Foundation (to L.M. and W.L.).
1. Wheatstone C (1838) Contributions to the physiology of vision, Part I: On some remarkable, and hitherto unobserved, phenomena of binocular vision. Phil Trans R Soc London 128:371–394. 2. Wheatstone C (1852) Contributions to the physiology of vision, Part II: On some remarkable, and hitherto unobserved, phenomena of binocular vision (continued). London Edinburgh Dublin Phil Mag J Sci 3(series 4):504 –523. 3. Ogle KN (1946) The binocular depth contrast phenomenon. Am J Psychology 59:111–126. 4. Ogle KN (1950) Researches in Binocular Vision (Hafner, New York).
5. Julesz B (1971) Foundations of Cyclopean Perception (Univ of Chicago Press, Chicago). 6. Howard IP, Rogers BJ (2002) Seeing in Depth (I Porteous, Toronto), Vols I and II. 7. Werner H (1937) Dynamics of binocular depth perception. Psychol Monogr 49(2):1– 121. 8. Werner H (1938) Binocular depth contrast and the conditions of the binocular field. Am J Psychology 51:489 – 497. 9. Youngs WM (1976) The influence of perspective and disparity cues on the perception of slant. Vis Res 16:79 – 82.
18010 兩 www.pnas.org兾cgi兾doi兾10.1073兾pnas.0807385105
Hudson et al.
Hudson et al.
28. Bertz J, Li W, Matin L (2005) The influences of visual pitch on visually perceived eye level, visually perceived pitch, felt head orientation, and felt hand orientation. J Vis 5:882. 29. Cohn TE, Lasley DJ (1976) Binocular vision: Two possible central interactions between signals from two eyes. Science 192:561–563. 30. Cohn TE, Leong H, Lasley DJ (1981) Binocular luminance detection: Availability of more than one central interaction. Vis Res 21:1017–1023. 31. Rashbass C (1970) The visibility of transient changes of luminance. J Physiol 210:165– 186. 32. Cohn TE, Lasley DJ (1975) Spatial summation of foveal increments and decrements. Vis Res 15:389 –399. 33. Hubel D, Wiesel T (1962) Receptive fields, binocular interaction and functional architecture in the cat’s visual cortex. J Physiol 160:106 –154. 34. Hubel D, Wiesel T (1968) Receptive fields and functional architecture of monkey striate cortex. J Physiol 195:215–243. 35. Pettigrew JD, Nikara T, Bishop PO (1968) Binocular interaction on single units in cat striate cortex: Simultaneous stimulation by single moving slit with receptive fields in correspondence. Exp Brain Res 6:391– 410. 36. Cumming BG, Parker AJ (1997) Responses of primary visual cortical neurons to binocular disparity without depth perception. Nature 389:280 –283. 37. Cumming BG, Parker AJ (1999) Binocular neurons in V1 of awake monkeys are selective for absolute, not relative, disparity. J Neurosci 19:5602–5618. 38. Olavarria JF, Van Sluyters RC (1995) Overall pattern of callosal connections in visual cortex of normal and enucleated cats. J Comp Neurol 363:161–176. 39. Olavarria JF (1996) Non-mirror-symmetric patterns of callosal linkages in areas 17 and 18 in cat visual cortex. J Comp Neurol 366:643– 655. 40. Felleman DJ, Burkhalter A, van Essen DC (1997) Cortical connections of areas V3 and VP of macaque monkey extrastriate visual cortex. J Comp Neurol 379:21– 47. 41. Hof PR, Ungerleider LG, Adams MM, Webster MJ, Gattass R, Blumberg DM, Morrison JH. (1997) Callosally projecting neurons in the macaque monkey V1/V2 border are enriched in nonphosphorylated neurofilament protein. Vis Neurosci 14:981–987. 42. Ipata A, Girelli M, Miniussi C, Marzi CA (1997) Interhemispheric transfer of visual information in humans: The role of different callosal channels. Arch Ital Biol 135:169 – 182. 43. Matin L, Fox C (1989) Visually perceived eye level and perceived elevation of objects: Linearly additive influences from visual field pitch and from gravity. Vis Res 29:315– 324.
PNAS 兩 November 18, 2008 兩 vol. 105 兩 no. 46 兩 18011
NEUROSCIENCE
10. Gillam B, Chambers D, Lawergren B (1988) The role of vertical disparity in the scaling of stereoscopic depth perception: An empirical and theoretical study. Percept Psychophys 44:473– 483. 11. van Ee R, Erkelens C (1996) Temporal aspects of binocular slant perception. Vis Res 36:43–51. 12. van Ee R, Erkelens C (1996) Anisotropy in Werner’s binocular depth-contrast effect. Vis Res 36:2253–2262. 13. van Ee R, Banks MS, Backus BT (1999) An analysis of binocular slant contrast. Perception 28:1121–1145. 14. Kumar T, Glaser DA (1991) Influence of remote objects on local depth perception. Vis Res 31:1687–1699. 15. Kumar T, Glaser DA (1992) Shape analysis and stereopsis for human depth perception. Vis Res 32:499 –512. 16. Kumar T, Glaser DA (1993) Temporal aspects of depth contrast. Vis Res 33:947–957. 17. Sato M, Howard IP (2001) Effects of disparity–perspective cue conflict on depth contrast. Vis Res 41:415– 426. 18. Gillam B, Lawergren B (1983) The induced effect, vertical disparity, and stereoscopic theory. Percept Psychophys 34:121–130. 19. Nakayama K, Shimojo S (1990) Da vinci stereopsis: Depth and subjective occluding contours from unpaired image points. Vis Res 30:1811–1825. 20. Pianta MJ, Gillam B (2003) Paired and unpaired features can be equally effective in human depth perception. Vis Res 43:1– 6. 21. Matin L, Li W (1995) Multimodal basis for egocentric spatial localization and orientation. J Vestibul Res 5:499 –518. 22. Howard IP, Pierce BJ (1998) Types of shear disparity and the perception of surface inclination. Perception 27:129 –145. 23. Pierce BJ, Howard IP, Feresin C (1998) Depth interactions between inclined and slanted surfaces in vertical and horizontal orientations. Perception 27:87–103. 24. Poquin D, Ohlmann T, Barraud PA (1998) Isotropic visual field effect on spatial orientation and egocentric localization. Spat Vis 11:261–278. 25. Li W, Matin L (1998) Change in visually perceived eye level without change in perceived pitch. Perception 27:553–572. 26. Hudson TE, Li W, Matin L (2000) Independent mechanisms produce visually perceived eye level (VPEL) and perceived visual pitch (PVP). Vis Res 40:2605–2619. 27. Post RB, Teague JM, Welch RB, Hudson TE (2003) Visually perceived eye level with reversible pitch stimuli: Implications for the great circle and implicit surface models. Perception 32:1073–1092.