Aug 30, 2017 - investment in technology and government coercion to carry out projects for ...... https://www3.bcb.gov.br/sgspub/localizarseries, 2014. URL.
Advances in Economics and Business 5(8): 476-486, 2017 DOI: 10.13189/aeb.2017.050806
http://www.hrpub.org
Biodiesel Production, Soybean Cultivation and Family Agriculture: Evaluation of Brazilian Experience Jefferson N. do Prado1,2,∗ , Fl´avia Chein3 , Juliano J. Assunc¸a˜ o4 1 PPGEA,
Federal University of Juiz de Fora, Brazil
2 Mackenzie 3Department 4Department
Presbiterian University, Brazil
of Economics, Federal University of Juiz de Fora, Brazil
of Economics and Climate Policy Initiative, Pontifical Catholic University of Rio de Janeiro (PUC-Rio), Brazil
c Copyright 2017 by authors, all rights reserved. Authors agree that this article remains permanently open access under the terms of the Creative Commons Attribution License 4.0 International License
Abstract We analyzed the impact of the National Program for Production and Use of Biodiesel (PNPB) over some soybean variables such as productivity, price received and wages paid among soybean family farming units in Brazil (from 2003-2012). The empirical strategy includes first identified "poles" of biodiesel production, and then uses a difference in differences model to estimate effects over time between soybean producing municipalities considered as a PNPB biodiesel production pole (treatment) and other soybean producing municipalities (control) not producing biodiesel. The results indicate that PNPB does not appear to be closely related to soybean productivity changes. However, the PNPB appears to be positively associated with average incomes and wages, suggesting that the PNPB may have helped support rural economic development in municipalities with strong social seal participation. Keywords
Biodiesel, National Production and Use of Biodiesel Program, Family Agriculture, Agricultural Productivity
JEL-Codes D04, Q13, Q16
1
Introduction
There is a debate about the economic and environmental issues surrounding the biofuel policies around the world, but few works seek to discuss about the possibility of social inclusion and poverty reduction in rural areas. Comparing the policy implemented within the world’s largest producers of biodiesel, U.S.A, Germany, Argentina and Brazil, the National Biodiesel Production and Use Program (PNPB) is the only one that presents family agriculture inclusion as a guideline.
In the U.S.A it was stipulated by law the amount of allocated resources via grants would applied to new sources of energy. But do not mention environmental or social goals in its execution [1]. In the European Union a mention is made of the subsidies for the development of alternative energy sources, but the law emphasize the goals setted by the Kyoto protocol to reduce the percentage of emissions of greenhouse gases leaving it to each country the best way to conduct such policy [2]. Argentina refers to the attempt to develop an export market favoring the small biodiesel producer but there is no mechanism of incentives that collaborate with purchase of raw materials by rural agricultural cooperatives and small farmers [3]. In Brazil the Social Seal allows that companies reduce their taxes over payroll and revenues according to the minimum percentage of raw materials purchased from household that are framed in the National Program for Strengthening Family Agriculture (PRONAF). With such mechanism the policy aims to raise the participation of farmers family as input suppliers to the mills and thus use the biodiesel market to improve the conditions of the assisted families [4]. Nevertheless, some papers discussed about the social inception effectiveness as in Brazil as in other parts of the world, such as: [5], [6], [7], [8], [9] and [10]. [5] assesses the social impacts of biofuel programs focusing rural communities. In conclusion, the author ensure did not decrease poverty in these areas, in fact, occurs concentration of wealth to the holders of the means of production to refine the biodiesel. [6] submits these social issues in the program and highlights how positive inclusion of family agriculture in combating poverty in Brazil. However, the author concludes that although some families manage to increase their income by 30%, the number of farmers attended is still far below as the program intended to. The explanation for this fact according to the author lies in a sum of events led to the failure
Advances in Economics and Business 5(8): 476-486, 2017
of the intended target. First, government provided policy that would require the purchase of raw materials for these families, but not treated properly the inherent operational issues, such as the receipt of the product, the technological expertise available, among others. Moreover, the government did not promoted the most productive crops but those with large quantity available culture dominated by large producers (soybean). Lastly the program resulted in a concentrated income market where 49% of the biodiesel produced is held by two or three companies. [7] combine poverty reduction with intensification of cultures for the production of raw materials supplying the biodiesel market. The authors noted that despite including family farming in a process of income generation due to the program, it is also necessary to evaluate the effect of biofuels over food production. It was concluded that an increase in the price generated by the evolution of biofuels could affect food price and result in an adverse social effect. [8] shows the weaknesses of the social aspect of PNPB through the number of families assisted is less than that proposed by the program. The granting of credit to the small farmer is also questionable by the authoress, according to her, the number of families assisted by PRONAF was also below the idealized by the program which implied farmers to contract loans with higher interest rate. An important additional point that the authoress highlighted was about fragility of the social seal program like a mechanism of social inclusion. Her criticism is made of the way how the contracts are concluded between small producers and biodiesel refiners. To buy raw material the refiners must sign contracts with farmers who stipulate: the term, the purchase price and conditions for your adjustment, and delivery conditions. However, the author found that small producers do not have the conditions to negotiate favorable contracts to sell their products across the major commodity companies, especially in the Northeast. [9] analyze poverty reduction through biofuels proposing technical solutions to the international market. According to the authors, the developed countries should reduce their excess tariff exemptions allowing market maturity in developing countries to evolve with greater strength and alleviate poverty in the rural areas. The authors also stress the need for investment in technology and government coercion to carry out projects for these purposes. [10] showed the flaws of PNPB before his execution and stressed that the program could become a major hub of income causing the exclusion of small farmers and not inclusion. According to the author the program could reduce poverty in rural areas where the production and consumption occur in a decentralized and non-exclusive way in terms of technological routes and raw materials used, but the legislation does not provide any incentive for the installation of small units production of biofuels or to add value by small producers of raw materials, in this way, could result in huge dependence of soybean producers, what happened few years later. In this context, the aim of this paper is assess the social economical effects of PNPB over the family agriculture on soybean cultivate, investigating new empirical evidences
477
about the issue. With this purpose, was adopted as empirical strategy the dif-in-dif methodology where the results of the small soybean producer in municipalities framed as Pole Production were compared with the others soybean producer municipalities remained. The results shows significative effect of PNPB over average yield and the wages earned.
2
Cooperativeness, Social Seal and the Production Poles
In Brazil the activity of agriculture cooperativeness was officialized by law 5.764 at December 16th , 1971, where was defined the co-op activity as public policy and setted the presence of government providing technical support and special financial incentives for creation and development of the cooperatives. The law specifies cooperativeness like an entity that works in an economic activity, without profit means and not subject to bankruptcy, constituted only to provide services to the associated. Although the conception of a cooperative has social aims, the management is conducted like a market company with some exemptions. The composition of capital stock is divided in parts-quotes where the units can not be higher than actual minimum salary in Brazil; no associated can underwrite more than 1/3 of the parts-quotes, unless, the individual participation be ruled by: financial amount handled by associate; or the quantity of commodity traded or manufactured; or the size of cultivated area and the number of plants or animals explored [11]. In order to avoid fraud and bankruptcy risk, the law dictates that each cooperative establish a reserve fund with 10%, at least, over the net profit in the period, destined to repair losses and attend the development of its activities. In case of bankruptcy, bad management or any illegal action that result in a cooperative closure, the government has the authorization to step in via National Cooperativeness Council, responsible regulator entity. The law still demand that five percent, at least, over the net profit be saved for assistance to the associates and their families, when pre-scripted in statue, this resource can be able to cooperative employees. In spite of these obligations over the capital and the management of the cooperatives, other issues are as usual as a market company. It’s possible to occur merge and acquisitions within cooperatives; the labor hiring must be follow the Brazilian laws as a market company; the associates must not be hired like employee, and, in this way, avoid interest conflict; the cooperatives can invite assembly where is necessary 2/3 of associated presence to be valid the deliberations [11]. The importance of the cooperativeness to Brazilian biodiesel policy arises from involvement of family agriculture cooperative, where the government, after the National Program of Biodiesel Production and Use conception in 2004, designed a mechanism named Social Seal that include the participation of family agriculture in the market [12].
478
Biodiesel Production, Soybean Cultivation and Family Agriculture: Evaluation of Brazilian Experience
Table 1. Family agricultural participation on national soybean cultivation
Establishment Area harvested (hec) Quantity harvested (kg)
Family agriculture 164.011
Not family 51.966
Family share % 76
2.707.649
12.939.342
17
6.404.494.499 34.308.188.589
16
Amount received by production (R$) 2.891.786.309 14.249.698.227
17
Productivity (kg/hec)
2.365
2.651
Average yield (R$/kg)
0.45
0.42
Source: IBGE - Agricultural Census[13]
The Seal allows companies to cut down percentage of PIS/Pasep and Cofins taxes according the quantities of raw materials bought from family agriculture defined by Ministry of Agrarian Development (MDA), these quantities has a minimum limit to be acquired according the regions of Brazil, e.g, to Northeast and Southeast regions the minimun percent of acquisition is 30% over the total feedstock used by the companies. To North and Middle-West regions the percentage is 15%, and in South, 35% [14]. It’s important emphasize that the tax exemption incurs over the quantity acquired by biodiesel refiners and varies from each region. In case of a company buy 30% of its feedstock from Northeast or Southeast, the exemption will be in this percentage, the other 70% from other source that not be family agriculture, should be taxed in a regular form without exemption. In order to implement this seal in almost all of companies, the government established two blocks of lowest price biodiesel auction, one has 80% of the total amount of biodiesel to be bought, and this quota will acquired only from mills that has Social Seal. The 20% remained are destined for those don’t have the seal and the auction price cap for this quote is minor. Indeed, the government doesn’t want only to stimulate the companies using taxes exemption but enforce the market to include family agriculture how feedstock suppliers, and in this way use the biodiesel market to get better social conditions for Brazilian peasants allowing for these families access to technology, financial products and offer to them better ways to trade their products. How it’s very difficult for the companies to chase all of the rural families and set a supply agreement, the cooperatives works like a facilitator to the integration process between farmers and biodiesel mills, even not being a obligation for these families to be affiliated in a cooperative. In case of a biodiesel mill buy raw materials only by families that not participate any cooperative, the seal will granted in the same way. Although the social seal was designed to be an inclusion mechanism, the biodiesel mills have to attend several issues to get this certification, such as: to be responsible by technical assistance to family or cooperative agricultural; to sign the contracts in a presence of any local union that represents the peasants or the agriculture cooperative and to inform by a special report to MDA containing: the quantities bought and from who the feedstock was acquired, to keep a historical within five last years about the transactions made and all the contracts established [4].
Besides those issues to be filled, other aspects are demand before signing of contracts, that cover since technical supports to the farmer families until other allowances by biodiesel refineries such as: other types of technical support; if the payment will happen at the time of the harvest or before, technical support for the union as a whole to agree to the supply contract, among others. The price settled used to be other specificity in a round table with producers and family agriculture cooperatives. The negotiated price usually suffer a bonus charged by unions and organizations representing family farmers. Such agencies charge an additional amount on the market price of a sack of soybeans to make the sale. According [15] biodiesel producers usually suffer an auction to acquire raw material from such farmers where to pay the largest bonus on the price acquires the raw material. Even though with high government intervention and the excess of demands to the refineries, it’s interesting for them to keep a narrow relationship with family agriculture. This happens because the biggest incentive for a biodiesel refiner (most of them use to role as major players at national and international soybean market) to adopt the Social Seal is on possibility to acquire only the soybean crop, and avoid to incurs in other costs as land leasing or even to buy acreage to cultivate. With a nearest presence of refineries with the family agriculture, the biodiesel plants can operate in a profitable manner establishing trade relations with those families instead to internalize all their transaction costs. How previously cited, the biodiesel program intended to provide technical support to peasants families. In order to reach such goal, the Ministry of Agrarian Development deployed in 2006 a methodology for the organization of the productive base called Production Poles Project. The objective of the project is to contribute with social inclusion for family agriculture promoting these families in the biodiesel production chain through vegetable oil production. Production Poles are geographic areas composed by several municipalities, with the presence family farmers, producers or potential producers of raw materials for production purposes biodiesel under PNPB [4]. The formation of a Pole takes into account: • the presence of family farmers with vocation for the planting of some oilseed crop; • territorial collective identity; • the presence of areas considered suitable for planting with agricultural zoning; • presence and/or interest to be present by the companies with the Social Fuel Seal, and • the presence of political and economic actors interested in the social development of the productive chain. With such initiative, it’s possible to implement technical policies in order to obtain better rates of productivity, profitability and increase the economical conditions to the families supported buy the PNPB Social Seal.1 1 Information got from: www.institutobrasil.com
www.pluralcooperativa.com.br
and
Advances in Economics and Business 5(8): 476-486, 2017
(a) North Region
(b) Midwest Region
(c) Northeast Region
(d) South Region
479
(e) Southeast Region
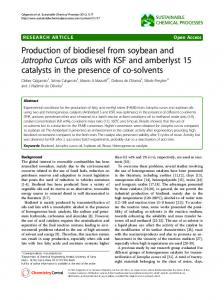
Source and elaboration: Ministry of Agrarian Development - (MDA,2010) Family Agriculture Secretariat Figure 1. Poles oilseed producers municipalities
Figure 1 shows the municipalities framed as Biodiesel Poles Production [4].
3
As the figure demonstrate, there are 51 poles where most of them are located at Northeast and Midwest. The North region has just one production pole at Par´a state. In South and Southeast the poles are set out at typically rural areas.
3.1
How the objective of this paper is to verify if indeed the PNPB managed to improve the conditions of families living in rural areas, the research will use the information disclosed about the Production Poles of Biodiesel as a tool to delimit the cities of Brazil which are most affected with the program and where there are major agricultural cooperatives served by the social seal. A better way to verify the impact on these families would be to use data at the level of individuals and follow them over time. Due to the absence of such data, the survey is carried out considering local information on productivity, average income and wages paid.
Municipal Soybean Analysis Empirical Strategy
As pointed by [16] one of the problems in the Brazilian biodiesel program is the huge dependence of soybean oil. Actually, soybean oil represent more than 75% of the total amount of the Brazilian biodiesel raw material. The dynamic that occurs in the field between small farmers and grain processing companies is decisive to decrease dependence on soybean and to stimulate growing of other crops. In this sense, the social policy intrinsic to PNPB failed because since its launch the program remains soybean dependent and avoided the expansion of other kinds of raw materials2 could generate income in poor rural areas of Brazil like northeast cities. 2 The MDA booklet lists the mainly cultivates that were covered by the production pole, e.g. Sunflower; Castor beans and Palm oil, but, how these cultures represent less than 1% of all biodiesel inputs, the analysis were done only to soybeans.
480
Biodiesel Production, Soybean Cultivation and Family Agriculture: Evaluation of Brazilian Experience
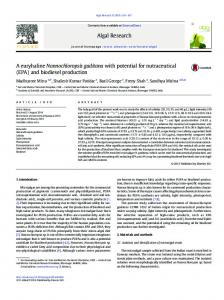
Therefore, this work develops the empirical strategy to be applied at soybean crops due to its importance as main biodiesel raw material. The Figure 1 shown above releases the production poles framed by MDA3 but not distinguish what crop used to be cultivate. How the purpose of our paper is analyze the impact focusing soybean, was necessary to identify which of those municipalities produce soy. The Figure 2 displays the georeferencing with all the regions early demonstrated with the soybean map, where it’s possible analyse which municipalities produce soybean and are pole production, others that produce soybean but are not a pole production and, those, are pole production but not produce soy, instead, cultivate some of other crops relevant to biodiesel.
3.2
Data
The database includes data used in planted area (hectares) harvested quantity (tons) and the amount received by the producer (Brazilian currency) obtained from research Municipal Agricultural Production (PAM), collected annually by the Brazilian Institute of Geography and Statistics (IBGE)[17]. Here are considered the years 2003 to 2012. The effect on wages labor employed in the cultivation of soybeans will be evaluated of the database of the Ministry of Labor and are part of the database of the Annual Report of Social Information (RAIS), also for the period 2003-2012 [18]. The variable productivity was calculated as:
P rod(ton/hec) =
Qty(ton) P lanted Area(hec)
(1)
That is the amount of harvested over planted area will provide productivity tonnes per hectare for each crop by county. In turn, the average yield will report the amount received from each culture producers divided by its quantity harvested, being:
AvgY ield(R$k/ton) =
Earnings Received by P roducer(R$k) Qty(ton)
Further graphs (1,2 and 3) demonstrate the trajectory of the productivity, average yield and wages of soybean crops.
Source: Municipality Agricultural Production (PAM-IBGE, 2012). Own elaboration. Figure 2. Georeferencing between soybean production and production poles
The areas in the Northeast do not usually cultivate soybeans, so were demarcated as castorbeans and palm oil production poles. The map shown in Figure 2 emphasizes the importance of soybeans and reinforces the evidence that the national biodiesel continues with a large dominance of soy. The empirical strategy is based on comparison of results about productivity, average income and wages paid in the soy industry among municipalities that were directly impacted by the program, municipalities poles production, soybean producers, with those who produce soybeans but are not marked as production poles. It’s made a comparison between the blue groups of municipalities with those in red before and after the implementation of PNPB.
3 Relation of poles determined by the Department of Income Generation and Value (DEGRAV) of the Family Agriculture Secretariat subordinate to the Ministry of Agrarian Development
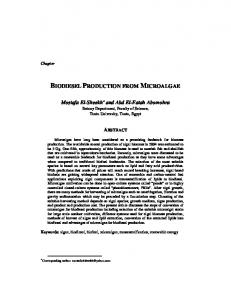
Source: Municipal Agricultural Research (PAM-IBGE, 2012) Graph 1. Soybean Productivity Analysis
Analyzing the three earlier graphs it’s possible verify substantial differences in such variables when comparing the poles (blue line) with other municipalities that produce the same crop (red line). Such differences may be explained by the proposal of the definition of Poles Production policy whose aim is precisely to identify those areas that may present better conditions in a specific culture and improve access to technical support for cultivation. The trend of soybean productivity, Figure 1, can be explained by the historical series of the stock of soy, Graphic 4. It should be noted that one of the reasons to use soy as the main
(2)
Advances in Economics and Business 5(8): 476-486, 2017
Source: Municipal Agricultural Research (PAM-IBGE, 2012) Graph 2. Soybean Average Yield Analysis
481
In this sense, although the production pole project had been implemented with aim to raise access of technological means to increase agricultural productivity, there is not a observable effect. Although the productivity shows growth at decreasing rates after 2008, the same not happened with the average yield released at Graph 2 neither with paid salaries at Graph 3, in otherwise, both kept positive slope. Exactly in 2006 when initiated the production poles project the level of growth shifted and remained increasing moving along. The wages curve show itself extremely positive, where it’s not perceptive any negative impact about soybean productivity. The fact that wages do not show any negative effect may occur due to labor contracts are pre-fixed, which somehow avoids the effects of fluctuations in productivity on wages. In addition, the PNPB seems to contribute to support this increase in wages and average income received by soybean producers, as will be evidenced by the econometric results. The wages paid, as well as all monetary variables used, such as: income received by crop, the credits granted by the National Program for Strengthening Family Agriculture (PRONAF) and collected taxes, were deflated using the Consumer Price Index Broad (IPCA), used as an inflation target for the Brazilian monetary policy [20].
3.3
Dif-in-dif model
As previously mentioned, the effects of PNPB on productivity, average income and wages are estimated by the difference method for panel data, following the approach presented in Angrist and Pishke (2009) Cameron and Trivedi (2005). Are therefore estimated three models: Source: Ministry of Labor (RAIS-Data, 2012) Graph 3. Soybean Wages Analysis
P rodit = αi + Dpole + Dyear + Dbiodiesel 0
(3)
+ δ(Dpole ∗ Dyear ) + Xit β + �it
raw material was the high historical level of soybean stock after 2001 [19]. Similar fact occurred with rapeseed in Europe, where the species had an oversupply in the own demand for food could not absorb, in order to prevent that even occur in Brazil, to produce biofuels was the way found to eliminate the excess of vegetable oils in the country.
AvgY ieldit = αi + Dpole + Dyear + Dbiodiesel 0
(4)
+ δ(Dpole ∗ Dyear ) + Xit β + νit
W agesit = αi + Dpole + Dyear + Dbiodiesel 0
(5)
+ δ(Dpole ∗ Dyear ) + Xit β + γit
Where the α will measure the unobserved fixed effect, δ parameter going to describe our interest hypothesis and
Source: Intelligence Center of Soy - CISOJA, 2012 Graph 4. Historical series of soybean stock
the matrix X clusters the controls variables described under. Dpoles and Dyear are the dummies constructed to catch the effect at poles regions and the year when was implanted. Dyear will be 1 to 2007 up to 2012 and 0 otherwise, although in 2006 already exist some actions for few municipalities that joined the production poles project, only in 2007 the first ones were officially established. Dpoles perform value 1 on municipalities considered pole and 0 otherwise. And, Dbiodiesel will be equals 1 to 2005 up to 2012 and 0 otherwise in order to catch the effect of biodiesel start, once the pole delimitation initiated two years after PNPB launch.
482
Biodiesel Production, Soybean Cultivation and Family Agriculture: Evaluation of Brazilian Experience
Table 2. Descriptive statistics of dependent variables
P roductivity(ton/hec) Avg.Y ield(R$k/ton) W ages(R$)
P roductivity(ton/hec) Avg.Y ield(R$k/ton) W ages(R$)
2003
2004
2005
2006
1.3 (1.3) 0.1 (0.1) 79 (132)
0.9 (1.0) 0.2 (0.2) 99 (158)
0.6 (0.9) 0.1 (0.1) 123 (193)
1.0 (1.1) 0.1 (0.1) 163 (229)
0.70 (1.18) 0.09 (0.16) 34 (95)
0.71 (1.12) 0.14 (0.21) 48 (128)
0.68 (1.10) 0.10 (0.15) 60 (149)
0.70 (1.12) 0.08 (0.13) 82 (194)
2007 Poles 1.3 (1.3) 0.1 (0.1) 184 (257) No Poles 0.76 (1.22) 0.10 (0.17) 92 (220)
2008
2009
2010
2011
2012
historical average
1.2 (1.2) 0.2 (0.2) 214 (304)
1.1 (1.2) 0.2 (0.3) 248 (353)
1.4 (1.4) 0.2 (0.2) 293 (415)
1.5 (1.5) 0.3 (0.3) 343 (479)
1.0 (1.21) 0.4 (0.4) 420 (584)
1.1
0.77 (1.24) 0.15 (0.25) 111 (259)
0.70 (1.17) 0.16 (0.26) 130 (298)
0.79 (1.28) 0.14 (0.23) 152 (351)
0.83 (1.33) 0.19 (0.29) 179 (419)
0.76 (1.22) 0.24 (0.38) 225 (512)
0.2 217
0.74 0.14 111
Note: the table reports the annual average and the standard deviation (in parenthesis) for the dependent variables used in the empirical strategy. The standard errors in all specifications are grouped at the county level, making them robust to heteroskedasticity and serial correlation [21]
Standard errors in all specifications are clustered at the municipality level, making the robust to heteroscedasticity and serial correlation (Bertrand et. al(2004)). As vector X variables that can influence municipal trajectories of productivity, average income and wages, such as credit, population size, demand and the intrinsic economic activity to the municipality are included. To the credit, was used the National Program for Strengthening Family Agriculture Data (PRONAF) where it’s possible to see the loans amount contracted separated by trading, investment and defrayal. Was used not only currency data but also the number of contracts. As the biodiesel is sold mixing with diesel oil, was used the municipal fleet of truck and bus how a proxy to represent the demand variable collected by National Traffic Department [22]. To control other effects caused by economical and demographics issues, was setted the rate of population growth, described by the log of the municipal population [23], and the total amount collected of taxes over economical activity and earnings were used to describe the effect of economical activity [24]. Table 2 releases the mean and standard deviation of the dependent variables, which corroborates with what was presented by graphs. Values over time presented by the poles are higher than not poles compared year-on-year and overall historic average.
Table 3. OLS and FE Diff-in-Diff Results Average Yield OLS FE
Results
Estimates of the effects of PNPB on productivity, average income and wages were estimated by Ordinary Least Squares (OLS) and Fixed Effects (FE) to panel data for the period between 2003 to 2012 presented in Tables 3, 4, 5 and 6. According to the hypothesis of identifying the differences in differences model, it is expected that the interaction effects between the treatment and years dummies before 2007 be nulls. Table 3 shows the results for the difference in differences model runned for the country as a whole.
FE
Productivity OLS FE
Biodiesel
0.016* 0.036*** 261.649***211.917*** 0.237*** 0.269*** (0.009) (0.008) (15.620) (11.656) (0.049) (0.043)
Time Dummy
-0.002 (0.012)
Pole Dummy
0.039*** (0.010)
0.011 (0.011)
7.124 (20.923)
13.323 (15.360)
0.099 -0.176*** (0.066) (0.056)
52.362*** (17.617)
0.508*** (0.056)
Effect in 2004
-0.017 -0.020* (0.014) (0.011)
-5.034 (24.812)
5.526 -0.774***-0.780*** (15.639) (0.079) (0.057)
Effect in 2005
-0.027* -0.031*** 16.119 (0.014) (0.011) (24.828)
18.629 -1.097***-1.109*** (15.656) (0.079) (0.057)
Effect in 2006
-0.027* -0.032*** 42.204* 48.719*** -0.377***-0.391*** (0.014) (0.011) (24.739) (15.602) (0.078) (0.057)
Effect in 2007
-0.022 -0.028** 60.898** 66.903*** -0.086 (0.014) (0.011) (24.799) (15.649) (0.079)
-0.104* (0.057)
Effect in 2008
0.049*** 0.043*** 60.939** 68.278*** -0.375***-0.394*** (0.014) (0.011) (24.873) (15.702) (0.079) (0.057)
Effect in 2009
0.067*** 0.059*** 75.218*** 86.476*** -0.219***-0.242*** (0.014) (0.011) (24.719) (15.604) (0.078) (0.057)
Effect in 2010
0.037*** 0.031*** 98.711*** 113.837*** -0.070 (0.014) (0.011) (24.725) (15.626) (0.078)
-0.084 (0.057)
Effect in 2011
0.047*** 0.041*** 126.331***139.196*** -0.005 (0.014) (0.011) (24.743) (15.663) (0.078)
-0.017 (0.057)
Effect in 2012
0.075*** 0.072*** 134.778***155.696***-0.667***-0.662*** (0.014) (0.011) (24.803) (15.732) (0.079) (0.057)
Controls
4
Wages OLS
Yes
Observations 21,281 R-square 0.343 Number of municipalities
Yes
Yes
Yes
Yes
Yes
21,281 0.465 2,182
21,271 0.247
21,271 0.376 2,181
21,281 0.074
21,281 0.100 2,182
Note: a) Controls used were: municipal fleet of trucks and tractors as a demand proxy, the municipal collection deflated taxes, the amount of credit granted to municipalities deflated via pronaf, and the annual rate of population growth. All presented inexpressive values of coefficients, but significant at 1%. b) The results were calculates on Ordinary Least Squares (OLS) and Fixed Effects (FE) in panel data for the period between 2003 a 2012. The PNPB, represented by Biodiesel variable was significant for all variables. The dashed line shows the identification hypothesis of our model, which aimed to evaluate the effects of Poles Project before and after the year 2007. It can be seen that for the average income and wages, there is an effect on these variables after 2008 and 2009, respectively. Meanwhile to the productivity, there is no effect at all. Standard deviation in parentheses. Significance: ∗ ∗ ∗p < 0.01, ∗ ∗ p < 0.05, ∗p < 0.10
Advances in Economics and Business 5(8): 476-486, 2017
Following [25], the objective of estimation is to compare the effect between treatment group and control one. In this research, our treatment group will be the soybean producing municipalities defined as production poles, while the control group will be the soybean producing municipalities that are not producing poles, as shown in Figure 2. Thus, analyzing Table 3, it’s possible verify that since 2008 the treatment group average yield was superior in 49 Reais by produced tons according to Fixed Effects (FE), while Ordinary Least Squares (OLS) estimation reported 43 Reais more than the control group. Regarding the years before 2007, OLS estimation was significant only in 2005 and 2006 reporting negatives values, while the values calculated in FE estimation were all significant and negatives. However, after 2008, it’s possible to note that as OLS estimation as FE showed the same pattern of significance and reported positive values, moreover its possible to realize a continuity of the values earned by the polos municipalities be superior than the municipalities that are not production poles from that year until 2012. The wages paid showed an effect already in 2006 which
483
occurred as a result of the first initiatives in this year, following the production poles project frame even in noninstitutionalized way [4]. Evaluating over time, the estimated effects show up increasing. In 2007, the effect was 61 Reais in OLS and 67 Reais in FE, likewise the average yield, this result shows that wages paid by municipalities production poles, after the start of policy, appear higher than other municipalities that are not poles, and after the year 2009, it is apparent that the significance for both OLS and FE are the same. With regard to productivity, there were no significant positive effects. Instead, they were estimated negative effects and the variable does not present the same pattern of identification as average yield and wages paid. The Biodiesel dummy that was created to capture the effect of the beginning of PNPB was significant in both OLS and in FE, for all dependent variables. The Time and Poles dummies are also presented in all tables of results, where one realizes that the dummy pole has a positive and significant for all variables in the OLS estimation, indicating that the fact of being a pole municipality allows the region to get better results of average yield, wages
Table 4. OLS and FE Diff-in-Diff Average Yield Results South
Midwest
Southeast OLS FE
Northeast
North
OLS
FE
OLS
FE
-0.020** (0.010)
0.004 (0.010)
-0.085*** (0.022)
0.591*** (0.071)
0.205*** (0.053)
Time dummy
-0.015 (0.010)
-0.009 (0.009)
-0.013 (0.022)
0.019 (0.022)
0.038 (0.058)
Poles dummy
0.029*** (0.009)
Effect in 2004
-0.013 (0.013)
-0.012 (0.010)
-0.012 (0.028)
-0.016 (0.021)
-0.054 (0.050)
-0.058 (0.039)
0.028 (0.185)
0.017 (0.144)
-0.041 (0.216)
-0.054 (0.173)
Effect in 2005
-0.009 (0.013)
-0.011 (0.010)
-0.014 (0.028)
-0.013 (0.021)
-0.028 (0.049)
-0.034 (0.039)
0.206 (0.186)
0.148 (0.145)
0.036 (0.216)
0.027 (0.173)
Effect in 2006
-0.021 (0.013)
-0.021** (0.010)
-0.009 (0.027)
-0.018 (0.021)
-0.019 (0.049)
-0.023 (0.039)
0.147 (0.185)
0.074 (0.144)
-0.056 (0.216)
-0.063 (0.173)
Effect in 2007
-0.015 (0.013)
-0.015 (0.010)
0.008 (0.028)
0.006 (0.022)
-0.033 (0.049)
-0.042 (0.039)
0.137 (0.186)
0.041 (0.146)
-0.091 (0.216)
-0.104 (0.173)
Effect in 2008
0.024* (0.013)
0.024** (0.010)
0.054* (0.028)
0.047** (0.022)
0.085* (0.049)
0.071* (0.039)
0.032 (0.187)
-0.044 (0.147)
-0.095 (0.237)
-0.153 (0.192)
Effect in 2009
0.022* (0.013)
0.020** (0.010)
0.069** (0.027)
0.057*** (0.021)
0.071 (0.049)
0.061 (0.039)
-0.084 (0.186)
-0.183 (0.147)
-0.102 (0.216)
-0.127 (0.173)
Effect in 2010
0.035*** (0.013)
0.035*** (0.010)
0.046* (0.028)
0.033 (0.021)
0.047 (0.049)
0.036 (0.039)
-0.099 (0.187)
-0.192 (0.148)
-0.168 (0.216)
-0.180 (0.173)
Effect in 2011
0.014 (0.013)
0.015 (0.010)
0.073*** (0.028)
0.063*** (0.022)
0.056 (0.049)
0.038 (0.039)
-0.158 (0.188)
-0.269* (0.149)
-0.202 (0.217)
-0.220 (0.173)
Effect in 2012
0.070*** (0.013)
0.069*** (0.010)
0.049* (0.028)
0.039* (0.022)
0.045 (0.050)
0.045 (0.039)
0.260 (0.191)
0.072 (0.153)
-0.208 (0.217)
-0.239 (0.173)
Controls Observations R-square Municipalities
Yes 9,436 0.599
Yes 9,436 0.726 953
Yes 3,701 0.369
Yes 3,701 0.502 383
Yes 5,964 0.165
Yes 5,964 0.237 609
Yes 731 0.369
Yes 731 0.486 83
Yes 1,449 0.291
Yes 1,449 0.336 154
Biodiesel
0.023 (0.020)
OLS
FE
OLS
FE
0.090*** (0.021)
0.948*** (0.205)
-0.210*** (0.061)
0.008 (0.124)
0.149*** (0.037)
0.088* (0.052)
0.260 (0.191)
-0.044 (0.147)
-0.095 (0.237)
-0.153 (0.192)
0.051 (0.035)
-0.191 (0.131)
0.009 (0.168)
Note: a) Controls used were: municipal fleet of trucks and tractors as a demand proxy, the municipal collection deflated taxes, the amount of credit granted to municipalities deflated via pronaf, and the annual rate of population growth. All presented inexpressive values of coefficients, but significant at 1%. b) The results were calculates on Ordinary Least Squares (OLS) and Fixed Effects (FE) in panel data for the period between 2003 a 2012. The PNPB, represented by Biodiesel variable was significant for all variables. The dashed line shows the identification hypothesis of our model, which aimed to evaluate the effects of Poles Project before and after the year 2007. It can be seen that for the average income and wages, there is an effect on these variables after 2008 and 2009, respectively. Meanwhile to the productivity, there is no effect at all. Standard deviation in parentheses. Significance: ∗ ∗ ∗p < 0.01, ∗ ∗ p < 0.05, ∗p < 0.10
484
Biodiesel Production, Soybean Cultivation and Family Agriculture: Evaluation of Brazilian Experience
and productivity when compared to other soybean producing municipalities. This can not be verified in the estimation in FE, because the value of the dummy be constant between the municipalities over time. Conversely, the time dummy shows no significant value, except for the amount calculated in FE for productivity. How the national program has a huge soybean dependence it’s expected that South and Midwest regions shows a major participation over the total effect found in Table 3. In this sense, the Tables 4, 5 and 6 report the results estimated to which one of the dependent variables by region. The Table 4 shows the effect of average yield. It’s found that, for the South and Midwest regions the effects were positive and significative right after 2007 as the identification hypotesis proposal to the model. This result was expected because of the tradition of both regions in the production of domestic soybeans. In this sense, no significant amount reported in other regions also was expected. The Table 5 shows the effect over salaries paid. Although the South and Midwest regions are most traditional in soybean cultivation, the Southeast region has the largest estimated values compared with the others, while the South has the lowest calculated values. Table 5. OLS and FE Diff-in-Diff Wages Results South OLS FE Biodiesel
Midwest OLS FE
Southeast OLS FE
47.93**86.30***-455.16*** -114.97 256.67*** 18.32 (24.20) (17.62) (129.70) (117.42) (72.38) (23.79)
Time dummy -17.753 11.310 39.040 (23.559) (16.643) (43.272) Pole dummy 20.472 (21.596)
Northeast OLS FE 525.67 (353.88)
164.21* (86.55)
North OLS
FE
832.68*** 83.63* (160.13) (46.61)
19.080 172.488**138.870**-937.120*** -599.303*** -264.104 -252.516 (33.991) (79.247) (58.401) (328.540) (207.975) (306.275) (244.699)
9.495 (38.520)
111.153** (47.750)
157.279 (225.609)
16.850 (217.220)
Effect in 2004 -4.41 3.39 (30.39) (18.40)
20.22 (53.77)
5.77 (35.42)
5.60 (68.07)
6.85 (44.30)
-223.56 (318.94)
-268.96 (204.52)
-70.51 (279.89)
-92.36 (220.51)
Effect in 2005 4.79 4.10 (30.40) (18.41)
71.00 (54.09)
32.02 (35.64)
59.72 (67.51)
54.45 (43.93)
-347.29 (319.63)
-353.23* (204.98)
-131.74 (279.96)
-135.25 (220.15)
Effect in 2006 28.87 30.23 (30.35) (18.39)
73.50 (53.55)
34.34 (35.41)
76.69 (67.23)
77.89* (43.74)
-468.66 (318.90)
-458.28** (204.68)
-174.06 (279.86)
-170.92 (219.96)
Effect in 2007 34.26 32.49* (30.39) (18.44)
96.51* (54.05)
54.79 (35.81)
118.16* 115.97*** -491.75 (67.25) (43.79) (320.45)
-526.90** (206.73)
-183.56 (279.93)
-179.70 (219.95)
Effect in 2008 41.44 32.74* (30.46) (18.51)
99.59* (54.13)
63.73* (35.81)
124.70* 119.18*** -575.53* (67.84) (44.25) (321.61)
-599.30*** -264.10 (207.97) (306.27)
-252.51 (244.69)
Effect in 2009 38.65 38.90** 126.73** 70.31** 167.84** 161.12*** -646.11** -681.29*** -285.67 (30.35) (18.47) (53.53) (35.45) (67.52) (44.00) (321.16) (207.69) (279.83)
-296.06 (219.84)
Effect in 2010 40.68 37.25** 168.31*** 110.18***243.07***238.22*** -711.76** -762.45*** -364.05 (30.38) (18.55) (53.66) (35.62) (67.26) (43.81) (322.23) (209.26) (279.99)
-342.86 (219.94)
Effect in 2011 45.85 40.17** 216.71*** 156.00***341.32***318.56*** -772.36** -838.28*** -461.55* -434.53** (30.33) (18.58) (53.90) (35.91) (67.52) (44.11) (324.20) (211.69) (280.15) (220.15) Effect in 2012 47.03 31.76* 211.06*** 183.25***399.43***408.11*** -937.12*** -1,003.29***-635.71**-617.47*** (30.36) (18.65) (54.28) (36.34) (68.13) (44.58) (328.54) (216.63) (280.45) (220.57) Controls Yes Observations 9,436 R-square 0.271 Municipalities
Yes 9,436 0.429 953
Yes 3,691 0.411
Yes 3,691 0.553 382
Yes 5,964 0.172
Yes 5,964 0.224 609
Yes 731 0.374
Yes 731 0.523 83
Yes 1,449 0.357
Yes 1,449 0.385 154
Note: a) Controls used were: municipal fleet of trucks and tractors as a demand proxy, the municipal collection deflated taxes, the amount of credit granted to municipalities deflated via pronaf, and the annual rate of population growth. All presented inexpressive values of coefficients, but significant at 1%. b) The results were calculates on Ordinary Least Squares (OLS) and Fixed Effects (FE) in panel data for the period between 2003 a 2012. The PNPB, represented by Biodiesel variable was significant for all variables. The dashed line shows the identification hypothesis of our model, which aimed to evaluate the effects of Poles Project before and after the year 2007. It can be seen that for the average income and wages, there is an effect on these variables after 2008 and 2009, respectively. Meanwhile to the productivity, there is no effect at all. Standard deviation in parentheses. Significance: ∗ ∗ ∗p < 0.01, ∗ ∗ p < 0.05, ∗p < 0.10
This fact is a consequence of the South be intensive in soybean cultivation on small farms of family farmers, which characteristics is to be intensive in family hand labor composed by the owners working in their fields, while in the Midwest
and Southeast regions, the labor-work used to be formal because of the increased number of large commodities companies in both regions. However, despite the traditional cultivation in the South region be predominantly composed by small rural farmers, it is perceived that after 2007 the estimate in FE occurs on wages similar to the Midwest, where in previous years, the calculated values have no significance. Therefore, although the effect is less, after Production Poles policy, the South region possibly started to increase its quantity of formal workers. The Table 6 releases the values estimated to soybean productivity by region. None of the regions was possible to check positive and significatives effects after the year of 2007. It appears that, even in the South and Midwest, there is no effect in any of the years analyzed for productivity. So, the production poles project contributed to the support of average yield and wages in the selected municipalities, not only this project, but also the biodiesel program positively affect these variables in the Brazilian regions analyzed. However, the soybean productivity have been contributing with other problem to the national biodiesel program. The PNPB already presents a strong soy-dependence to refine the biofuel and additionally this paper showed that the productivity of this crop have been increasing with decreasing rate and after 2010 the rate reached negative level. Comparing the poles municipalities (treatment) that are more exposed to politics with other soybean producing municipalities (control) that are not identified as producing areas, it was expected that not only the average income received by the producer and the wages paid were impacted after implementation of the policy, but productivity, should also have been affected positively. This is because the purpose of public policies: design Production Poles, ATER and own PNPB is not only to insert the family farmer in the marketing of agricultural products, but also to provide technical assistance to them in order to they reach production levels and competitive productivity. But despite the efforts to provide technical assistance to small farmers, it is not clear effect on the municipal yield of soybean with empirical proposed strategy. All these findings just ilustrate how the public policy about this biofuel needs to be improved, especially about the transparency of the results disclousure by the brazilian government. According to public information avaible at [14], the government just release the number of farmer families contemplated by PNPB, but all the issues that surround the policy are not discussed with academic community and accurated datas are not even published, such as: agricultural cooperatives financial sheets. Once these kind of cooperatives are considered as public policies by brazilian laws, it‘s necessary that the public evaluate how this kind of affirmative action is working. Much of these agricultural co-op are located at North and Northeast, regions that concentrate a large part of the pour families of the country and none of results tables reported significant positive effect in this areas. However, the results of this research show that PNPB just got better the regions already concentrate the soybean crop, South and Midwest ones.
Advances in Economics and Business 5(8): 476-486, 2017
485
Table 6. OLS and FE Diff-in-Diff Productivity Results South
Midwest
Southeast
Northeast OLS FE
North
OLS
FE
OLS
FE
OLS
FE
Biodiesel
-0.289*** (0.065)
-0.042 (0.056)
-0.213 (0.130)
0.992** (0.397)
-0.260 (0.259)
0.218** (0.096)
2.102* (1.080)
Time dummy
0.174*** (0.063)
-0.097* (0.053)
-0.069 (0.134)
-0.242** (0.115)
-0.075 (0.283)
-0.026 (0.235)
1.559 (1.003)
Pole dummy
0.201*** (0.058)
Effect in 2004
-0.576*** (0.082)
-0.571*** (0.059)
-0.522*** (0.166)
-0.543*** (0.120)
-0.463* (0.243)
-0.489*** (0.178)
0.510 (0.974)
0.410 (0.704)
-0.161 (1.156)
-0.150 (0.885)
Effect in 2005
-1.039*** (0.082)
-1.046*** (0.059)
-0.416** (0.167)
-0.400*** (0.121)
-0.116 (0.241)
-0.162 (0.177)
1.375 (0.976)
0.966 (0.706)
-1.197 (1.157)
-1.159 (0.884)
Effect in 2006
-0.209** (0.082)
-0.196*** (0.059)
-0.330** (0.165)
-0.378*** (0.120)
-0.111 (0.240)
-0.143 (0.176)
1.030 (0.974)
0.542 (0.705)
-1.321 (1.156)
-1.265 (0.883)
Effect in 2007
0.032 (0.082)
0.039 (0.059)
-0.199 (0.167)
-0.208* (0.121)
-0.123 (0.240)
-0.184 (0.176)
0.719 (0.978)
0.023 (0.712)
-1.533 (1.157)
-1.496* (0.883)
Effect in 2008
-0.393*** (0.082)
-0.385*** (0.059)
0.001 (0.167)
-0.007 (0.121)
0.055 (0.242)
-0.044 (0.178)
1.165 (0.982)
0.544 (0.716)
-1.623 (1.265)
-1.896* (0.982)
Effect in 2009
-0.077 (0.082)
-0.068 (0.059)
-0.106 (0.165)
-0.151 (0.120)
0.010 (0.241)
-0.049 (0.177)
0.332 (0.980)
-0.478 (0.715)
-1.599 (1.156)
-1.620* (0.883)
Effect in 2010
-0.078 (0.082)
-0.056 (0.059)
0.021 (0.166)
-0.009 (0.120)
0.145 (0.240)
0.070 (0.176)
0.361 (0.984)
-0.496 (0.720)
-1.567 (1.157)
-1.496* (0.883)
Effect in 2011
0.010 (0.082)
0.036 (0.059)
-0.003 (0.167)
0.003 (0.121)
0.062 (0.241)
-0.041 (0.177)
0.357 (0.990)
-0.634 (0.729)
-1.495 (1.158)
-1.449 (0.884)
Effect in 2012
-0.611*** (0.082)
-0.595*** (0.059)
-0.273 (0.168)
-0.209* (0.123)
-0.006 (0.243)
-0.003 (0.179)
1.559 (1.003)
0.117 (0.746)
-1.446 (1.159)
-1.454 (0.886)
Controls Observations R-square Municipalities
Yes 9,436 0.241
Yes 9,436 0.390 953
Yes 3,701 0.067
Yes 3,701 0.054 383
Yes 5,964 0.038
Yes 5,964 0.019 609
Yes 731 0.196
Yes 731 0.196 83
Yes 1,449 0.172
Yes 1,449 0.110 154
0.372*** (0.119)
0.500*** (0.171)
OLS
FE
-0.416 (0.298)
0.295 (0.662)
0.882*** (0.187)
0.544 (0.716)
-1.623 (1.265)
-1.896* (0.982)
-1.277* (0.689)
0.741 (0.898)
Note: a) Controls used were: municipal fleet of trucks and tractors as a demand proxy, the municipal collection deflated taxes, the amount of credit granted to municipalities deflated via pronaf, and the annual rate of population growth. All presented inexpressive values of coefficients, but significant at 1%. b) The results were calculates on Ordinary Least Squares (OLS) and Fixed Effects (FE) in panel data for the period between 2003 a 2012. The PNPB, represented by Biodiesel variable was significant for all variables. The dashed line shows the identification hypothesis of our model, which aimed to evaluate the effects of Poles Project before and after the year 2007. It can be seen that for the average income and wages, there is an effect on these variables after 2008 and 2009, respectively. Meanwhile to the productivity, there is no effect at all. Standard deviation in parentheses. Significance: ∗ ∗ ∗p < 0.01, ∗ ∗ p < 0.05, ∗p < 0.10
Analyzing these findings and comparing with USA, Germany and Argentina, Brazil tried to inovate with social inception, but the loss of productivity could explain why the country occupy the fourth position within the main world producers4 .
5
Final remarks
This article presents new evidence on the Brazilian market for biodiesel production, especially with regard for PNPB socio-economic impacts on small soybean producers. The empirical strategy is based on the identification and comparison of results between municipalities Production Poles producers of soybeans and others soybean producers, in order to evaluate possible effects over social guidelines focusing on family agriculture of PNPB . About the income concentration, which is indirectly observed, there is income increasing of small producers from the production of soybean encouraged by the Social Seal. 4 United States of America is the first biodiesel producer with 15.4% followed by Germany with 15%, Argentina with 13.1% and Brazil 12.6% [26]
However, with the results estimated, it can be seen that the municipal soybean productivity is declining, which refutes the assumption both PNPB and production poles project to provide technology access and technical service efficiently. Comparing poles and not poles productivity trend it’s possible verify that, although with a lower level, the not poles ones have been increasing their trend while the production poles report a productivity that grows with decreasing rate, and, since 2011, this trend falls. On the other hand, estimates of the difference in differences model brings further evidence that the PNPB had positive impacts on the average income and wages, considering family soybean production. In general, the policy of biodiesel combined with poles production project have generated income as for soybeans producer as for workers in the sector. If the level of this income is below or above the proposed, was not the object of the present study. But criticism to be made is to conduct an agricultural policy that stands income of the soybean industry and do not watch out for the productive counterpart, where the constant loss of production efficiency, can generate problems of insolvency of agents participants as well as
486
Biodiesel Production, Soybean Cultivation and Family Agriculture: Evaluation of Brazilian Experience
the breakdown of the biodiesel market.
Acknowledgements
[12] Brasil. Decreto no 5.297, de 06 de dezembro de 2004. dispon´ıvel em: http://www.planalto.gov.br. 2004. URL http://www.planalto.gov.br.
The authors thanks CNPq and FAPEMIG by funding via doctoral scholarship and research assistance.
[13] CensoAgro. Censo agropecu´ario - instituto brasileiro de geografia e estat´ıstica (ibge), 2006. URL http://www.sidra.ibge.gov.br/.
REFERENCES
[14] MDA. Portaria mda n.60, 2012. Dispon´ıvel em: http://www.lex.com.br/legis23694594PORTARIAN60DE6DE SETEMBRODE2012.aspx, 2012. URL http://www.planalto.gov.br.
[1] U.S.A. Public law 109-58 - energy policy act of aug. 8, 2005., August 2005. URL https://lpo.energy.gov/wp-content/uploads/2010/ 09/EPAof2005.pdf. [2] E.U. Directiva 2009/28/ce do parlamento europeu e do conselho de 23 de abril de 2009. Jornal Oficial da Uni˜ao Europ´eia, Abril 2009. URL http://eur-lex.europa.eu/LexUriServ/LexUriServ .do?uri=OJ:L:2009:140:0016:0062:pt:PDF. [3] R.H.C. Dolabella. Biocombust´ıveis na argentina: pol´ıtica p´ublica e evoluc¸a˜ o recente. Cadernos Aslegis, 39:269–292, jan-abr 2010. [4] MDA. Cartilha do programa nacional de produc¸a˜ o e uso de biodiesel. secretaria da agricultura familiar do minist´erio do desenvolvimento agr´ario. dispon´ıvel em: www.mda.gov.br/biodiesel. 2010. [5] Joy Clancy. Biofuels and Rural Poverty, volume 1. Routledge, 2013. [6] D. Cesano. Are biofuels a feasible option to reduce poverty in a changing climate? learning from the brazilian experience. dispon´ıvel em: www.trocaire.org/resources/tdr-article/arebiofuels-feasible-option-reduce-poverty-changing -climate-learning, 2008. URL www.trocaire.org/resources/tdr-article/are -biofuels-feasible-option-reduce-poverty -changing-climate-learning. [7] V. Raswant, N. Hart, and M. Romano. Biofuel expansion: Challenges, risks and opportunities for rural poor people. In How the poor can benefit from this emerging opportunity, pages 1–13, 2008.
´ [15] BiodieselBR. Estoques de Oleo. BiodieselBR, (38), dez/jan 2014. [16] J. N. Garcez, C. A. G. e Vianna. Brazilian biodiesel policy: Social and environmental considerations of sustainability. Energy, 34(5):645–654, maio 2009. [17] PAM. Produc¸a˜ o agr´ıcola municipal. dispon´ıvel em: http://www.ibge.gov.br/home/estatistica/economia/pam/, 2012. URL http://www.ibge.gov.br/home/estatistica/ economia/pam/. [18] RAIS. Relac¸a˜ o anual de informac¸o˜ es sociais. minist´erio do trabalho. dispon´ıvel em: http://portal.mte.gov.br/rais/, 2014. URL http://portal.mte.gov.br/rais/. [19] Biodieselbr. Leil˜oes de biodiesel. Biodieselbr, (7), out/nov 2008. ano 2. [20] BCB. Banco central do brasil. dispon´ıvel em: https://www3.bcb.gov.br/sgspub/localizarseries, 2014. URL https://www3.bcb.gov.br/sgspub/localizarseries/ localizarSeries.do?method=prepararTelaLocalizar Series. [21] M. Bertrand, E. Duflo, and S. Mullainathan. How much should we trust in differences−in−differences estimates?. Quarterly Journal of Economics, 119:249–275, 2004. [22] Denatran. Departamento nacional de trˆansito. dispon´ıvel em: http://www.denatran.gov.br/frota.htm, Acesso em: abr 2014.
[8] C.A.G. Garcez. Uma an´alise da pol´ıtica p´ublica do programa nacional de produc¸a˜ o e uso de biodiesel (pnpb). Master’s thesis, Centro de Desenvolvimento Sustent´avel - Universidade de Bras´ılia, 2008.
[23] Censo. Censo demogr´afico - instituto brasileiro de geografia e estat´ıstica (ibge). dispon´ıvel em: http://www.sidra.ibge.gov.br/cd/cd2010rgaadagsn.asp, 2010. URL http://www.sidra.ibge.gov.br/.
[9] L. Peskett, R. Slater, C. Stevens, and A. Dufey. Biofuels, agriculture and poverty reduction. Natural Resource Perspectives, 107:1–6, 2007.
[24] Tesouro Nacional. Dispon´ıvel em: http://www3.tesouro.fazenda.gov.br/estadosmunicipios/, 2011.
[10] P. C. R. Lima. O biodiesel e a inclus˜ao social. Estudo, Consultoria Legislativa, Maro 2004. URL [25] J.D Angrist and J. S. Pischke. Mostly harmless econometrics: An Empiricists Companion, volume 1. Princeton University http://www2.camara.leg.br/documentos-e-pesquisa/ Press, 2009. publicacoes/estnottec/pdf/2004 676 Estudo.pdf. [11] Brasil. Lei no 5.764, de 16 de dezembro de 1971. dispon´ıvel em: http://www.planalto.gov.br. 1971. URL http://www.planalto.gov.br.
[26] Minist´erio de Minas e Energia. Boletim Mensal dos Combust´ıveis Renov´aveis. http://www.mme.gov.br, Acesso em: abr 2012. URL http://www.mme.gov.br.