Algal Research 8 (2015) 161–167
Contents lists available at ScienceDirect
Algal Research journal homepage: www.elsevier.com/locate/algal
A euryhaline Nannochloropsis gaditana with potential for nutraceutical (EPA) and biodiesel production Madhusree Mitra a,b, Shailesh Kumar Patidar a, Basil George a, Freny Shah a, Sandhya Mishra a,b,⁎ a b
Salt and Marine Chemicals Discipline, CSIR — Central Salt and Marine Chemicals Research Institute, Bhavnagar 364002, India Academy of Scientific and Innovative Research (AcSIR), CSIR — Central Salt and Marine Chemicals Research Institute, Bhavnagar 364002, India
a r t i c l e
i n f o
Article history: Received 21 August 2014 Received in revised form 29 January 2015 Accepted 2 February 2015 Available online xxxx Keywords: Nannochloropsis gaditana Salinity Light intensity Photoperiod Eicosapentaenoic acid Saturated fatty acids Biodiesel
a b s t r a c t The holy grail of the present work was to study the effects of salinity (20, 30, 35, and 40 g/L), light intensity (60 and 150 μmol photons m−2 s−1) and photoperiod (24 h:0 h, 18 h:06 h, 12 h:12 h, 06 h:18 h and 00 h:24 h light:dark) on selective nutraceutical properties of Nannochloropsis gaditana with a focus on eicosapentaenoic acid production. The maximal biomass (45.01 ± 1.01 mg L−1 day−1) and lipid productivities (14.63 ± 0.79 mg L−1 day−1) were obtained at a salinity gradient of 20 g/L, whereas the maximal eicosapentaenoic acid (EPA) productivity was found at 60 μmol photons m−2 s−1 and a photoperiod regime of 18 h:06 h (light:dark), which yielded high EPA contents of 37.83 ± 0.37% and 32.16 ± 0.40%, respectively. Low salinity augmented both the chlorophyll-a and carotenoid contents (11.71 ± 0.40 and 4.32 ± 0.15 μg/mL, respectively) compared with high salinity. The eicosapentaenoic acid (C20:5) content of the strain was in the range of 19.13 ± 0.08 to 37.83 ± 0.37%. Principal component analysis demonstrated a correlation between saturated and monounsaturated fatty acid synthesis. After significant extraction of long-chain PUFA (EPA and AA), the residual oil can be used for the production of biodiesel that complies with the European standards for biodiesel. This study investigated the nutrient profile of EPA-enriched microalgae N. gaditana, which can be used for nutraceutical production, and established that the remaining oil (excluding EPA and AA) may be a promising biodiesel feedstock due to its high SFA and MUFA contents. © 2015 Published by Elsevier B.V.
1. Introduction Microalgae are among the promising contenders for the commercial production of pigments (carotenoids and phycobiliproteins), PUFA (eicosapentaenoic acid, docosahexaenoic acid, -linolenic acid and arachidonic acid), single-cell proteins, and various cosmetic products [1, 2]. Their importance is increasing due to their significant utility for carbon sequestration, bioremediation, and the production of biodiesel and high-value products. To date, many oleaginous microalgae have been investigated for PUFA production. PUFAs are essential fatty acids for humans with various benefits that are fulfilled by seafood, fish and some plants. It is true that the majority of the human population consumes a PUFA-deficient diet. Although fish contain EPA and DHA, they acquire long-chain n3 PUFAs principally from their micro-algal diet [3]. Nannochloropsis sp. is one of the commercially important oleaginous microalgae that is well known to produce PUFAs and is also a potential candidate for biodiesel production [4,5]. However, Nannochloropsis sp. exhibits a varied fatty acid composition due to their physiological and eco-physiological variabilities [6]. Although various stress parameters ⁎ Corresponding author at: Salt and Marine Chemicals Discipline, CSIR — Central Salt and Marine Chemicals Research Institute, Bhavnagar 364002, India. E-mail address:
[email protected] (S. Mishra).
http://dx.doi.org/10.1016/j.algal.2015.02.006 2211-9264/© 2015 Published by Elsevier B.V.
are known to improve fatty acids for either PUFA or biodiesel production, there is insufficient knowledge regarding strain-specific responses. Nannochloropsis sp. is also known for its carotenoid production characteristics. Some of the major causes affecting physicochemical stress conditions for PUFA synthesis are salinity, light intensity, photoperiod, temperature and nutrients [7,8]. The present study addresses the assessment of Nannochloropsis gaditana CCNM 1032 of Indian origin for nutraceutical production under varying salinity, light intensity and photoperiods. Furthermore, the selective separation of high-value products, such as EPA (eicosapentaenoic acid) and AA (arachidonic acid), from the total lipids was assessed, and the potential of using the remaining oil for biodiesel production was further investigated. 2. Materials and methods 2.1. Isolation and identification of microalgal strain The microalgal sample collected from the Indian coast is enriched in Conway medium. The strain was isolated using the serial dilution and streak plate methods, and a pure culture was maintained. The isolated colonies were morphologically identified as Nannochloropsis sp. based on the following characteristics.
162
M. Mitra et al. / Algal Research 8 (2015) 161–167
The cells remained green during the log phase but changed to greenish brown in the stationary phase. The chloroplasts appear to be peripherally arranged and segmented. A dark-orange pigment was prominently observed in the cells during the stationary phase. The cells are spherical, oblong, ovoid and solitary. The cell size ranged from 2.4 to 3.0 μm in breadth and from 3 to 3.9 μm in length. The cell wall was smooth, and no distinct pyrenoids were observed. Furthermore, for molecular identification, a partial 23S ribosomal gene sequence was submitted to NCBI and assigned the Accession Number KF937214.1. Thus, the sample was genetically identified as N. gaditana. The strain was deposited in CSMCRI's microalgal culture facility with Account No. CCNM-1032. 2.2. Microalgal cultivation and experimental conditions N. gaditana CCNM 1032 was cultivated in modified Conway medium containing 1 mL/L of Conway stock solution, 1 mL/L of A5 trace metal mix, 0.5 mL/L of B6, and GeO2 (0.12 mg/L) in sterilized sea water [9]. One liter of Conway's stock solution contained 100 g/L of KNO3, 20 g/L of NaH2PO4, 45 g/L of Na2EDTA, 33.4 g/L of H3BO, 1.30 g/L of FeCl3·6H2O and 0.36 g/L of MnCl2·4H2O. One liter of the A5 trace metal mix contained 2.86 g/L of H3BO3, 1.81 g/L of MnCl2·4H2O, 0.222 g/L of ZnSO4·7H2O, 0.39 g/L of NaMoO4·2H2O, 0.079 g/L of CuSO4·5H2O, and 0.00494 g/L of Co(NO3)2·6H2O in 1 L of distilled water, and 1 L of B6 solution contained 22.96 mg/L of NH4NO3, 96 mg/L of K2Cr2(SO4)4·24H2O, 47.85 mg/L of NiSO4·7H2O, 17.94 mg/L of NaSO4·7H2O, 40 mg/L of Ti(SO4)3, and 49.48 mg/L of Co(NO3)2·6H2O in 1 L of distilled water. The cultures were maintained in 1 L of bacterial cotton-plugged Erlenmeyer flasks at 25 °C, and illumination was provided by cool white fluorescent lamps. A monoalgal culture from the subsequent log phase was harvested by applying centrifugal force (8000 rpm). The fresh pellet of microalgal cells was washed twice with sterile water and recentrifuged. The inoculum in the form of a fresh wet pellet was resuspended in 500 mL of autoclaved Conway media for the experiments under sterile conditions. N. gaditana was cultivated at four different salinity levels (20, 30, 35 and 40 g/L) with 40 μmol photons m−2 s−1 and a photoperiod of 12 h:12 h (light:dark) cycle, under two different light intensities (60 and 150 μmol photons m−2 s−1) with 30 g/L of salinity and a photoperiod of 12 h:12 h light:dark cycle, and at five different photoperiod regimes (24 h:00 h, 18 h:06 h, 12 h:12 h, 06 h:18 h and 00 h:24 h; light:dark) with 30 g/L of salinity and 40 μmol photons m−2 s−1 for an experimental period of 18 days. Each set of experiments was performed in triplicate. An independent experiment was conducted to investigate the effect of nitrate limitation on biomass productivity and the percent total lipid content. Conway media with four different nitrate concentrations (1, 35, 65 and 75 ppm) and a photoperiod of 12 h:12 h (light:dark) were used in this study. 2.3. Measurement of micro-algal growth The absorbency and DCW (dry cell weight) were used to characterize the growth of N. gaditana. The absorbance at 750 nm was measured using a UV–vis spectrophotometer to monitor the growth on every third day. A certain volume of culture was centrifuged, and the cell pellet was then dried overnight in an oven at 80 °C. The dried biomass was weighed gravimetrically. 2.4. Analytical methods 2.4.1. Chlorophyll and carotenoid estimation A known volume of N. gaditana culture was centrifuged, and the residue was mixed with 100% methanol and incubated overnight at 10 °C. The chlorophyll and carotenoid contents in the pooled extract were estimated spectrophotometrically by measuring the absorbances at 652.4, 665.2 and 470 nm and quantified using a previously described method
[10] with the following equations: Chlorophyll a; Chl‐a ðμg=mlÞ ¼ 16:72 A665:2 –9:16 A652:4 Chlorophyll b; Chl‐b ðμg=mlÞ ¼ 34:09 A652:4 –15:28 A665:2 Total Carotenoids ðμg=mlÞ ¼ ð1000 A470–1:63 Chl‐a–104:9 Chl‐bÞ=221:
2.4.2. Metal concentration determination The metal content of the freeze-dried biomass was determined by the modified acid digestion method [11]. The dried biomass was weighed in a crucible, mixed with concentrated HNO3 and maintained in a muffle furnace at 400 °C for 4 h. Then, the furnace was switched off, and the sample was left inside undisturbed to cool down. The resultant ash was then mixed with SupraPure HNO3 (Merck, Germany), diluted with MQ water (Millipore, USA) and filtered with a 0.45-μm membrane filter. Mineralogical analysis was performed through inductively coupled atomic emission spectroscopy (Perkin-Elmer, Optima 2000, USA) using ICP multi-element standard solution (MerckMillipore). 2.4.3. Lipid extraction and transmethylation Lipids were extracted from the freeze-dried biomass by ultrasonication of the suspension in a mixture of chloroform:methanol (2:1) [12] and quantified gravimetrically. The lipid samples were dissolved in hexane, and the fatty acids were then converted to their fatty acid methyl esters (FAMEs) by transmethylation of the extracted lipids with 15% NaOH in methanol–water (1:1) and heating for 15 min at 55 °C. Subsequently, methanolic HCl was added, and the mixture was heated for a further 15 min at 55 °C. FAMEs were extracted with hexane. 2.4.4. Fatty acid analysis GC–MS detection was performed for the identification of fatty acids using a Shimadzu GC 2010 chromatograph coupled with an autoinjector, Mass GC–MS QP 2010 and a fused silica capillary column (RTX-1, 30 m × 0.25 mm, i.e., film thickness = 0.25 μm, Restek, Bellefonte, PA). Helium was applied as the carrier gas at a flow rate of 1.00 mL/min. The temperature of the injector was set to 240 °C, and that of the detector was set to 240 °C. The temperature of the oven was programmed as follows: 50 °C for 1 min, increased to 200 °C at a rate of 25 °C/min, increased to 230 °C at a rate of 3 °C/min and maintained for 18 min. The FAME peaks were analyzed by comparing their retention time with those of the standards (37 FAME mix, Supelco, Sigma-Aldrich) through GC–MS post-run analysis and quantified by area normalization. 2.4.5. Biodiesel properties The theoretical biodiesel properties were analyzed by incorporating the fatty acid percentages into the Biodiesel Analyzer v1.1 software [13]. 2.4.6. Principal component analysis The fatty acids (C14:0, C16:0, C16:1, C18:1, C18:1n9c, C18:2n6c, C18:3n6, C20:4n6 and C20:5n3) and fatty acid properties ( SFA, MUFA, PUFA, n3PUFA, n6PUFA, n6/n3 and UI) were selected for PCA using the XLSTAT 2014 software. All of the variables were normalized using (n − 1), and Kaiser normalization was then performed prior to construction of the PCA biplot. In the resultant PCA biplot, the A, B, C, and D groups were circled according to their distinct cluster formation. 3. Results The total lipid (%) and EPA (%) of N. gaditana studied in the present work were in the ranges of 22.30 ± 1.73 to 38.63 ± 1.41 and 20.5 ± 0.14 to 37.83 ± 0.37, respectively, as shown in Table 1. In previous studies, different species of Nannochloropsis (Nannochloropsis oceanica,
M. Mitra et al. / Algal Research 8 (2015) 161–167
163
Table 1 Fatty acid profile of Nannochloropsis gaditana under varying growth conditions. TFA
Fatty acids
% DCW
% Total fatty acids
32.47 ± 1.88 29.40 ± 0.52 22.30 ± 1.73 24.23 ± 1.91 22.43 ± 1.21
ND 4.98 ± 0.11 5.38 ± 0.26 5.79 ± 0.08 4.15 ± 0.43
38.63 ± 1.41 31.07 + 2.55 27.43 ± 1.80 30.53 ± 0.75 32.73 ± 2.19 31.44 ± 0.19
C14:0
Salinity
Light intensity
Photoperiod
20 g/L 30 g/L 35 g/L 40 g/L 60 μmol photons m−2 s−1 150 μmol photons m−2 s−1 24L:00D 18L:06D 12L:12D 6L:18D 00L:24D
C16:0
C16:1
C18:1n9c
C18:2n6c
C18:3n6
C20:4n6
C20:5n3
26.44 ± 0.17 29.51 ± 0.35 23.41 ± 0.023 24.66 ± 0.37 17.65 ± 0.32
35.59 ± 0.18 26.81 ± 0.16 32.00 ± 0.02 33.35 ± 0.20 19.52 ± 0.22
1.18 ± 0.03 0.58 ± 0.01 0.38 ± 0.00 0.29 ± 0.04 5.41 ± 0.00
10.51 ± 0.18 11.72 ± 0.51 10.73 ± 0.03 11.45 ± 0.08 7.09 ± 0.03
1.71 ± 0.06 1.32 ± 0.02 1.78 ± 0.01 1.43 ± 0.18 3.50 ± 0.06
3.96 ± 0.00 4.16 ± 0.03 4.40 ± 0.21 3.85 ± 0.06 4.84 ± 0.07
20.5 ± 0.14 21.10 ± 0.07 21.98 ± 0.07 19.13 ± 0.08 37.83 ± 0.37
5.98 ± 1.34
17.82 ± 0.19
24.34 ± 0.00
3.84 ± 0.90
8.19 ± 0.23
2.50 ± 0.39
8.80 ± 0.16
28.50 ± 0.52
6.49 ± 0.09 5.81 ± 0.30 5.44 ± 0.11 6.83 ± 0.13 5.37 ± 0.07
25.96 ± 0.09 23.88 ± 0.18 22.41 ± 0.33 24.06 ± 0.12 23.32 ± 0.61
27.69 ± 0.21 22.22 ± 0.69 25.19 ± 0.05 31.95 ± 0.18 34.81 ± 0.34
0.56 ± 0.03 0.58 ± 0.04 0.83 ± 0.15 0.59 ± 0.01 0.58 ± 0.03
10.24 ± 0.54 6.03 ± 1.00 7.07 ± 0.05 7.69 ± 0.13 11.74 ± 0.00
2.93 ± 0.11 3.62 ± 0.03 2.48 ± 0.37 3.32 ± 0.31 1.86 ± 0.03
4.15 ± 0.19 5.67 ± 0.22 5.64 ± 0.46 4.30 ± 0.11 1.72 ± 0.00
21.98 ± 0.01 32.16 ± 0.40 30.91 ± 0.02 21.26 ± 0.19 20.60 ± 0.26
Nannochloropsis salina, Nannochloropsis oculata, and N. gaditana) had exhibited an optimal total lipid percentage of approximately 20–50% under varying nutrient and physicochemical conditions. The strain investigated in this study showed an analogous total lipid percentage, which was in accordance with previous results. The EPA content of the studied N. gaditana strain (7.4–28.8%) was found to be comparatively superior to that of the previously mentioned species of this genus [7, 14,15].
previous studies [7]. As the salinity was decreased from 30 g/L to 20 g/L, the C18:1n9t concentration increased up to 2.85-fold, indicating that this fatty acid is more responsive to low salinity compared to other fatty acids. Low salinity (20 g/L) also decreased the C20:4n6 concentration up to 3.10-fold. The optimal salinity levels for C18:3n6 (1.78 ± 0.01%) and C16:1 (35.59 ± 0.18%) production were 30 g/L and 20 g/l, respectively. The results indicated that certain fatty acids can be attuned
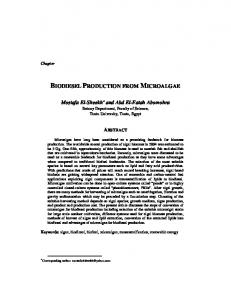
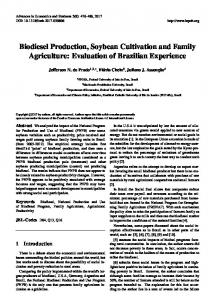
3.1. Effect of salinity Different salinity levels affected the biomass productivity and lipid productivity of N. gaditana. The maximum and minimum lipid productivities were 45.05 ± 1.01 mg L−1 day−1 and 38.57 ± 1.14 mg L−1 day−1 at salinities of 20 g/L and 40 g/L, respectively (Fig. 1). The highest EPA productivity was 9.13 ± 0.07 mg L−1 day−1 at 20 g/L, increased as the salinity was increased to 30 g/L and remained stable as the salinity was further increased to 40 g/L. However, the chlorophyll-a and carotenoid concentrations remained stable at different salinity levels. The results showed that chl-a-to-carotenoid ratio remained very stable at a range from 2.6 to 2.8. The chlorophyll-a-to-carotenoid ratio remained constant under certain environmental conditions, which was in accordance with the results of previous studies [16]. The highest chlorophyll-a and carotenoid concentrations were 11.71 ± 0.40 μg/mL and 4.32 ± 0.15 μg/mL, respectively (Fig. 2). One could infer that chlorophyll and carotenoids were not affected significantly in N. gaditana at the studied salinity range of 20 to 40 g/L. Salinity is an important parameter that affects osmoregulatory function, but its effect varies depending on the characteristics of the species [17]. The results showed that N. gaditana was euryhaline without a significant loss in the lipid percentage and the biomass content over the studied salinity range of 20 to 40 g/L. Conversely, the EPA productivity with the optimal lipid and biomass productivities was maximal at a salinity of 20 g/L, although the EPA percentage was at a minimum at this salinity. It was significant that a salinity of 20 g/L may be optimal for the economic production of EPA from N. gaditana cultivation. The major fatty acids of N. gaditana over the studied salinity range (20–40 g/L) were C16:0, C16:1 and C20:5n3, which were detected in ranges of 23.41 ± 0.02 to 29.51 ± 0.35%, 26.81 ± 0.16 to 35.59 ± 0.18%, and 19.13 ± 0.08 to 21.98 ± 0.07%, respectively, as shown in Table 1. At the salinity level was increased from 20 to 40 g/L, the content of C16:0 increased correspondingly, whereas some of the fatty acids, e.g., C20:4n6 and C20:5n3, increased in content up to the optimal salinity level (35 g/L) and then decreased as the salinity level was further increased to 40 g/L. The C18:1n9t content was highest (1.18 ± 0.03) under low salinity conditions and successively decreased with an increase in salinity (0.38 ± 0.00). A similar increase was observed for this fatty acid in
Fig. 1. Effects of salinity, light intensity and photoperiod stress conditions on the biomass, lipid and EPA productivities of Nannochloropsis gaditana.
164
M. Mitra et al. / Algal Research 8 (2015) 161–167
0.18 μg/mL and 4.24 ± 0.21 μg/mL at 60 μmol photons m−2 s− 1 and 150 μmol photons m−2 s−1, respectively. The total carotenoid contents were 1.43 ± 0.07 μg/mL and 1.57 ± 0.08 μg/mL at light intensities of 60 μmol photons m−2 s−1 and 150 μmol photons m−2 s−1, respectively. Both the carotenoid and chl-a contents increased with an increase in the light intensity due to increased photosynthetic activity. The EPA contents obtained under high and low light intensities were 28.50 ± 0.52% and 37.83 ± 0.37% (Table 1) with lipid productivities of 8.38 ± 0.25 mg L− 1 day− 1 and 13.86 ± 0.89 mg L− 1 day− 1 (Fig. 1), respectively. This higher lipid percentage obtained with a higher light intensity suggested that the studied strain could be used for lipid production. Nevertheless, a higher light intensity did not result in a higher EPA percentage even though the absolute content was 1.17-fold higher due to the higher biomass productivity obtained. The elevated lipid productivity and biomass productivity obtained with higher light intensity increased the EPA productivity. Hence, economic EPA production may be achieved under a high light intensity due to the greater biomass productivity obtained even though a lower EPA percentage is obtained. The saturated fatty acid composition (%) increased with a major increment in C16:0, whereas the MUFA and PUFA contents decreased. However, the C20:4n6 content was elevated under higher light intensity to approximately 1.8-fold (from 4.84 ± 0.07 to 8.80 ± 0.16%), as shown in Table 1. 3.3. Effect of the photoperiod
to achieve a desired fatty acid concentration to a certain extent by changing the salinity of the medium. An increase in the salinity level increased the percentage of saturated fatty acids (SFAs) and decreased the overall monounsaturated fatty acid (MUFA) content due to an intrinsic response of the membrane of N. gaditana. The n6/n3 ratio obtained under different levels of salinity changed but remained within the range of 0.76 to 0.87.
The biomass and lipid productivities as well as the fatty acid composition were assessed in N. gaditana at a light intensity of 60 μmol photons m−2 s−1, and the effect of five different photoperiod cycles was studied for 18 days, as illustrated in Fig. 1. The biomass productivity was almost stable at light:dark cycles of 24 h:00 h (34.85 ± 0.83 mg L−1 day−1) and 18 h:06 h (37.19 ± 0.52 mg L−1 day−1) and decreased with a reduction in the number of light hours, i.e., at photoperiods of 12 h:12 h (31.62 ± 1.61 mg L− 1 day− 1) and 06 h:18 h (31.11 ± 0.84 mg L−1 day−1). However, the 12 h:12 h and 06 h:18 h (light:dark) cycles were similar in terms of biomass productivity. The culture grown in complete darkness showed no growth with very low lipid and EPA productivity. Although it could not grow, it survived under dark conditions, and a lipid content was observed. The survival of microalgal cells of some species under complete darkness has been previously reported [18]. The trend of biomass productivity was followed by the chlorophyll-a and carotenoid contents exposed to different light hours (r2 = 0.85). However, at a very low concentration of chlorophyll-a, carotenoids were abundantly found in the pitch-dark period. The dominant fatty acids (C16:0, C16:1 and C20:5) in terms of composition (%) varied with changes in the photoperiod, which may be due to the availability of different precursors for fatty acid metabolism and their concentration [19,20]. The major n3 (C20:5) and n6 (C20:4 and C18:3) fatty acids ranged in concentration from 19.57 to 31.61%, 1.19 to 3.94% and 1.11 to 3.92%, respectively, as shown in Table 2. The maximal compositions obtained for the major n3 (C20:5) and n6 (C20:4 and C18:3) fatty acids (32.16 ± 0.40, 5.67 ± 0.22, and 3.62 ± 0.03, respectively) were obtained at the 18 h:06 h (light:dark) photoperiod, as shown in Table 1.
3.2. Effect of light intensity
3.4. Effect of nitrate limitation
The biomass productivity of the culture was increased (30.59 ± 1.70 to 35.86 ± 1.09 mg L− 1 day− 1) under two different light intensities i.e., 60 and 150 μmol photons m− 2 s− 1, in cultures with a salinity of 30 g/L. The lipid productivity increased from 8.38 ± 0.25 to 13.86 ± 0.89 mg L− 1 day− 1 with an improvement in the lipid percentage, as shown in Fig. 1. As shown in Table 1, the total lipid content of the cultures with a salinity of 30 g/L at two different light intensities (60 and 150 μmol photons m− 2 s− 1) was 22.43 ± 1.21% and 38.63 ± 1.41%, respectively. The Chl-a contents were 3.85 ±
The biomass and lipid productivities of N. gaditana were examined under different nitrate concentration (1, 35, 65 and 75 ppm). The biomass productivities were 9.97 ± 1.20, 18.86 ± 1.09, 28.86 ± 1.02, and 47.75 ± 0.89 at 1, 35, 65 and 75 ppm of nitrate, respectively, whereas the total lipid percentages were 35.60 ± 0.65, 31.70 ± 1.12, 29.80 ± 1.01, and 27.61 ± 0.87, respectively. It was axiomatic that the total lipid percentage increased under nitrate-limitation conditions (1 and 35 ppm) and that there was decrement in the total lipid content (%) with further increases in the nitrate concentrations (65 and 75 ppm),
Fig. 2. Change in the chlorophyll-a and total carotenoid contents of Nannochloropsis gaditana under different salinity, light intensity and photoperiod stress conditions.
M. Mitra et al. / Algal Research 8 (2015) 161–167
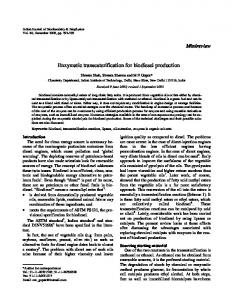
as shown in Supplementary Fig. 1. However, the biomass productivity was decreased under nitrate-limitation conditions. 3.5. Nannochloropsis sp. for human health In general, C20:4 (AA) and C20:5 (EPA) are both capable of producing eicosanoids in human. C20:4-derived eicosanoids give rise to inflammation, whereas, contrary to this, eicosanoids obtained from C20:5 show an anti-inflammatory response. The strain used in this study was rich in EPA and also contained a reasonable amount of AA and GLA. The results reported in the literature corroborate that GLA is a known potential precursor of AA synthesis through its metabolism [21]. Thus, the combination of GLA and EPA may be used to reduce the synthesis of the pro-inflammatory metabolite arachidonate to avert the risk of an elevated serum arachidonate level [22]. The literature suggests that the ratio of n6 to n3 FAs in the human diet should be close to 1. An n6/n3 FA ratio of at least 4:1 appears to induce risk of chronic diseases, such as cardiovascular disease, cancer, and inflammatory and autoimmune diseases [23]. In the present study, the n6/n3 FA ratio in N. gaditana was found to be 0.389–0.877, which is less than 4, and in most cases, it was proximate to 1; hence, this microalgae may be a very good supplement to achieve the PUFA requirements of a balanced human diet. 3.6. Principal component analysis All of the fatty acids obtained under the different salinity gradients, light intensities and photoperiod regimes analyzed in this study were selected for principal component analysis. The PCA biplot shown in Fig. 3 revealed four important clusters based on the PC 1 and PC 2 with variabilities of 65.07% and 12.87%, respectively. Inclusively, both PC 1 and PC 2 contributed 77.94% of the variability. Cluster A was encircled with the variables C16:0, 06 h:18 h, 24 h:00 h (light:dark), SFA, and SFA + MUFA, whereas cluster B consisted of variables 00 h:24 h (light:dark), C16:1, C18:2n6c, MUFA, n6PUFA, and n6/n3. Cluster C consisted of the variables C20:4n6 and C18:1n9c, and cluster D was encircled with variables 12 h:12 h (light:dark), C14:0, C18:3n6, C20:5n3, n3PUFA, PUFA and UI. The effect of a salinity of ‘30 s’ (30 g/L) was orthogonal to those obtained with salinities of ‘20 s’ (20 g/L), ‘35 s’ (35 g/L), and ‘40 s’ (40 g/L). The fatty acids obtained with salinities of ‘20 s’ (20 g/L), ‘35 s’ (35 g/L), and ‘40 s’ (40 g/L) were positively correlated to each other. Both C16:1 and C18:2n6c were negatively correlated to C18:3n6, as represented in clusters B and D, respectively. C16:0 was negatively associated with C18:1n9c and C20:4n6, as shown by clusters A and C, respectively. With a higher C16:0 fatty acid synthesis, the syntheses of C18:1n9c and C20:4n6 were hampered. It was evident that both C18:1n9c and C20:4n6 in cluster C together
165
were orthogonal to C16:1 and C18:2n6c in cluster B, as shown in the PCA biplot, because these fatty acids were not affected by each other during synthesis. During the conversion of C16:1 into C18:2, the Δ12 fatty acid desaturase enzyme introduces a double bond at the Δ12 position of C16:1. Similarly, the V3 fatty acid desaturase introduces a double bond at the Δ15 position of C18:2 to transform C18:2 into C18:3 [24,25]. The 12 h:12 h photoperiod was positively associated with the ∑PUFA and ∑n3PUFA scores, as shown in Fig. 3. This finding indicated that a 12 h:12 h photoperiod was optimal for the maximal production of ∑PUFA and ∑n3PUFA. The higher ∑PUFA was caused mainly by the synthesis of dominant ∑ n3PUFA, which contributed to the unsaturation index. The same photoperiod elevated the C20:5n3 and C18:2n6C fatty acid levels, as indicated in the biplot (Fig. 3). It was interesting to note that both the 6 h:18 h and 24 h:00 h (light:dark) cycles individually in combination with 30 s (cluster A) increased the ∑SFA and ∑MUFA levels. The set of more than one abiotic factor resulted in different fatty acid compositions [19]. ∑SFA and ∑MUFA are considered very important for biodiesel production [26]. The 6 h:18 h and 24 h:00 h (light:dark) cycles may be considered optimal conditions for higher SFA production, as demonstrated by the PCA biplot. 3.7. Biodiesel properties N. gaditana possessed a high proportion of long-chain PUFAs, ranging from 35.88 ± 0.11% to 53.26 ± 0.54%. The PUFAs comprised mainly of eicosapentaenoic acid (EPA, C20:5n3) and arachidonic acid (AA, C20:4n6), as exhibited in Table 2. Although high-value fatty acids are imperative for food and nutrition, their presence in total fatty acids may surpass the requirements defined by the international biodiesel standard for vehicles (EN14214). To meet the specified biodiesel standards for the PUFA ratio, EPA and AA can be selectively extracted and sequestered [27], and the remaining oil can be transformed to biodiesel. The fatty acid profile excluding EPA and AA was used to theoretically estimate the properties of the resultant biodiesel using Biodiesel Analyzer v1.1 [13,28], and the results were encouraging. After selective separation, the properties of the remaining oil were found to be in par with the European biodiesel standard [13,27]. The high SFA + MUFA content of the PUFA-free oil (N 80%) produced by this marine eustigmatophyte endorses superior oxidative stability (0–19.58 h), favors higher cetane numbers (53.44–59.97), and maintains the iodine value (49.94–79.71 b 120 g of I2/100 g) and density (0.87 g/cm3), as demonstrated in Table 4. 3.8. Mineral content The mineral element contents of the biomass (mg/100 g) were as follows: K (190.74–1424.4), Ca (751.68–2338.8), Mg (1490.1–3039.6),
Table 2 Fatty acid properties of Nannochloropsis gaditana under varying growth conditions. ∑ SFAa
∑ MUFAb
∑ PUFAc
∑ SFA + ∑ MUFA
∑ n6PUFA
∑ n3PUFA
∑ n6/n3
∑UId
36.7 ± 0.28 38.31 ± 0.28 38.80 ± 0.26 35.88 ± 0.11 53.26 ± 0.54 48.01 ± 0.27 39.30 ± 0.25 47.49 ± 1.14 46.11 ± 0.11 36.57 ± 0.33 35.91 ± 0.23
63.21 ± 0.28 61.69 ± 0.28 61.19 ± 0.26 64.11 ± 0.11 46.73 ± 0.53 51.98 ± 0.26 53.88 ± 0.11 52.50 ± 1.14 63.43 ± 0.32 60.69 ± 0.25 64.09 ± 0.22
16.1 ± 0.18 17.20 ± 0.33 16.82 ± 0.19 16.74 ± 0.19 15.44 ± 0.16 19.50 ± 0.79 17.32 ± 0.24 15.33 ± 0.74 15.19 ± 0.13 15.31 ± 0.29 15.31 ± 0.04
20.5 ± 0.09 21.20 ± 0.04 21.98 ± 0.07 19.13 ± 0.08 37.83 ± 0.37 28.50 ± 0.52 21.98 ± 0.01 32.16 ± 0.40 30.91 ± 0.02 21.26 ± 0.19 20.60 ± 0.26
0.78 ± 0.00 0.82 ± 0.02 0.76 ± 0.00 0.87 ± 0.14 0.40 ± 0.00 0.68 ± 0.04 0.79 ± 0.01 0.47 ± 0.01 0.49 ± 0.00 0.72 ± 0.02 0.74 ± 0.01
181. ± 0.75 176.75 ± 0.26 186.74 ± 0.87 172.98 ± 0.13 258.14 ± 2.61 229.84 ± 0.59 184.03 ± 0.21 229.24 ± 2.37 224.76 ± 0.79 181.38 ± 1.03 174.31 ± 1.52
% Total fatty acids Salinity
Light intensity Photoperiod
a b c d
20 g/L 30 g/L 35 g/L 40 g/L 60 μmol photons m−2 s−1 150 μmol photons m−2 s−1 24L:00D 18L:06D 12L:12D 6L:18D 00L:24D
=Saturated fatty acid. =Monounsaturated fatty acid. =Polyunsaturated fatty acid. =Unsaturation index.
26.4 ± 0.12 34.50 ± 0.17 28.61 ± 0.24 30.45 ± 0.41 21.80 ± 0.75 23.80 ± 1.17 32.44 ± 0.01 29.69 ± 0.49 22.85 ± 0.22 30.89 ± 0.22 28.70 ± 0.54
36.7 ± 0.15 27.19 ± 0.10 32.58 ± 0.02 33.65 ± 0.15 24.93 ± 0.21 28.18 ± 0.90 28.26 ± 0.24 22.81 ± 0.65 26.02 ± 0.10 32.55 ± 0.19 35.39 ± 0.31
166
M. Mitra et al. / Algal Research 8 (2015) 161–167
Fig. 3. Principal component analysis (PCA) of the fatty acid compositions under variable salinity, light intensity and photoperiod conditions.
Fe (91.68–214.32), Zn (23.4–52.68), Mn (11.52–75.12), Cu (7.44– 14.64), and Ni (3.96–4.68). The toxic element (As, Pb and Cr) contents were below the detection limits, as shown in Table 3. Thus, these contents may provide an adequate supply of minerals to meet the human mineral requirement standards [29,30]. 4. Conclusions Varying growth conditions (salinity, light intensity and photoperiod) can manipulate the chemical composition (fatty acids, minerals and pigments) of N. gaditana. The studied euryhaline eustigmatophyte may tolerate a relatively wide salinity range from 20 to 40 g/L, and the maximum biomass productivity was observed at 20 g/L. An increase in
salinity from 30 to 40 g/L can reduce the biomass productivity as well as the lipid and EPA productivities. The total fatty acid content (% of dry weight) was obtained in the cultures grown at a salinity of 20 g/L. A higher salinity gradient caused a slight decrease in the EPA content with an increase in the C16:0 and C16:1 contents. The high photon density (150 μmol photons m−2 s−1) promoted biomass productivity as well as lipid productivity but resulted in relatively lower EPA synthesis. The 18 h:06 h and 12 h:12 h (light:dark) photoperiods increased the EPA content (% of dry weight), whereas the 06 h:18 hand 00 h:24 h (light:dark) photoperiods caused a notable decrease in the EPA content. The 24 h:00 h (light:dark) photoperiod regime narrowed the EPA percentage. The PCA biplot revealed many interrelationships between fatty acids in relation to different light, photoperiod and salinity regimes
Table 3 Mineral component of Nannochloropsis gaditana (percent of dry matter). Mineral element content in Nannochloropsis sp. (mg/100 g of dry biomass) (mean ± SD) Macroelements K Salinity
20 g/L 30 g/L 40 g/L Light intensity 60 μmol photons m−2 s−1 150 μmol photons m−2 s−1 Photoperiod 24L:00D 18L:06D 12L:12D 6L:18D 00L:24D L:D indicates Light:Dark (hrs.).
Microelements Ca
Mg
397.74 ± 0.02 751.68 ± 0.01 1490.1 ± 0.08 381.48 ± 0.02 694.2 ± 0.01 2480.4 ± 0.19 190.74 ± 0.03 1262.1 ± 0.09 2115 ± 0.18 1424.4 ± 0.15 1906.8 ± 0.04 2947.2 ± 0.44 BDL 1257.6 ± 0.01 1640.4 ± 0.19 BDL 1180.56 ± 0.04 3039.6 ± 0.08 438.12 ± 0.02 1066.92 ± 0.04 2458.8 ± 0.28 560.88 ± 0.11 1498.8 ± 0.01 2977.2 ± 0.20 1248 ± 0.08 2338.8 ± 0.15 2950.8 ± 0.04 BDL 689.52 ± 0.06 1716 ± 0.20
Fe
Zn
Mn
Cu
121.44 ± 0.04 130.68 ± 0.10 186.6 ± 0.00 176.4 ± 0.01 139.32 ± 0.01 168.96 ± 0.07 115.44 ± 0.00 183.36 ± 0.00 214.32 ± 0.00 91.68 ± 0.01
38.7 ± 0.02 34.32 ± 0.02 36.24 ± 0.02 38.4 ± 0.01 33.24 ± 0.01 34.32 ± 0.01 23.4 ± 0.01 52.68 ± 0.01 33.72 ± 0.00 28.56 ± 0.02
45.78 ± 0.00 53.88 ± 0.00 34.26 ± 0.00 75.12 ± 0.00 39.72 ± 0.00 69.72 ± 0.00 69.36 ± 0.01 68.76 ± 0.00 47.76 ± 0.00 11.52 ± 0.00
12.72 ± 0.00 3.96 ± 0.00 8.4 ± 0.00 4.08 ± 0.01 8.88 ± 0.00 4.2 ± 0.00 14.64 ± 0.01 4.68 ± 0.00 9 ± 0.01 4.2 ± 0.00 11.64 ± 0.00 4.32 ± 0.00 14.4 ± 0.00 3.96v0.00 13.92 ± 0.00 3.96 ± 0.00 13.56 ± 0.00 4.08 ± 0.00 7.44 ± 0.00 4.08 ± 0.00
Ni
M. Mitra et al. / Algal Research 8 (2015) 161–167
167
Table 4 Biodiesel properties of Nannochloropsis gaditana oil (after selective separation of EPA). Salinity
Saponification value (mg KOH/g of fat) Iodine number (g I2100 g) Cetane number Long chain saturated factor Cold filter plugging point (°C) Cloud point (°C) Allilic position equivalents Bis-allilic position equivalents Oxidation stability (hrs.) High heating value (mJ/kg) Kinematic viscosity (mm2/s) Density (g/cm3)
Light intensity
Photoperiod
20 g/L
30 g/L
35 g/L
40 g/L
60 μmol photons m−2 s−1
150 μmol photons m−2 s−1
24L:00D
18L:06D
12L:12D
6L:18D
00L:24D
215.95 79.59 53.67 3.52 −5.42 13.51 33.5 18.16 9.98 39.1 1.22 0.87
217.54 71.58 55.28 3.72 −4.79 14.58 34.55 18.83 9.56 39.06 1.22 0.87
217.87 76.8 54.07 3.18 −6.49 11.71 34.45 19.34 9.56 39.05 1.21 0.87
216.86 54.53 59.2 5.18 −0.2 22.25 29.04 16.14 10.82 38.91 1.24 0.87
219.13 49.94 59.97 4.27 −3.06 17.48 8.18 0 0 39.05 1.24 0.87
219.58 62.52 57.09 3.44 −5.67 13.1 19.31 9.4 19.58 39.02 1.22 0.87
218.29 72.33 55.03 3.55 −5.32 13.7 31.84 19.66 10.27 39.04 1.21 0.87
218.88 70.33 55.41 3.84 −4.41 15.22 32.3 21.41 10.16 39.12 1.22 0.87
219.58 74.42 54.41 3.24 −6.3 12.02 30.68 19.02 10.57 39.18 1.21 0.87
218 73.62 54.77 3.5 −5.48 13.4 35.39 21.03 9.5 39.04 1.21 0.87
217.66 79.71 53.44 2.95 −7.21 10.55 35.74 19.88 9.33 39.04 1.2 0.87
due to varying synthesis routes. The most positive factor for the amelioration of fatty acids was the photoperiod, and this finding should be explored in future endeavors with other combinations of abiotic factors. Although the strain was rich in EPA and presented a relatively high level of PUFA, it may even be leveraged for biodiesel production after the selective separation of EPA and AA. The PUFA-free oil may be used for biodiesel production because the theoretical estimation suggested its suitability to comply with the prescribed European biodiesel standards [27]. Supplementary data to this article can be found online at http://dx. doi.org/10.1016/j.algal.2015.02.006. Acknowledgments The authors deeply acknowledge Dr. Pushpito Ghosh, Former Director, CSIR-CSMCRI and Dr. Arvind Kumar, DC, SMC, CSMCRI for providing the facilities and encouragement. MM is grateful to CSIR for financial support and AcSIR for PhD enrollment. The authors are thankful to CSIR-NMITLIMoES, CSC-0203 for financial supports. BG is thankful to SERB for his funding support. The authors would like to acknowledge Dr. K. Umadevi, Andhra University, for providing the samples for further isolation and characterization. The authors are also grateful to Dr. Parimal Paul, Head, Analytical Division and Mr. Harshad Brahmbhatt for providing analytical assistance. Mr. Abhishek Sahu (University of Chinese Academy of Sciences) is acknowledged for his help in molecular identification of the strain. We would like to express our gratitude to Mr. P.S. Balan (Ex-Stenographer; P.A. to the Director, CSMCRI) for his help in linguistic checking of the manuscript and Elsevier Language Editing Services for professional English grammar and language editing. This manuscript has been assigned as CSIR-CSMCRI-146/2014 registration no. References [1] Y. Chisti, Biodiesel from microalgae, Biotechnol. Adv. 25 (2007) 294–306. [2] Z. Yaakob, E. Ali, A. Zainal, M. Mohamad, M.S. Takriff, An overview: biomolecules from microalgae for animal feed and aquaculture, J. Biol. Res. (Thessaloniki) 21 (2014) 6. [3] J. Lunn, H.E. Theobald, The health effects of dietary unsaturated fatty acids, Nutr. Bull. 31 (2006) 178–224. [4] S. Leu, S. Boussiba, Advances in the production of high-value products by microalgae, Ind. Biotechnol. 10 (2014) 169–183. [5] L. Soh, M. Montazeri, B.Z. Haznedaroglu, C. Kelly, J. Peccia, M.J. Eckelman, J.B. Zimmerman, Evaluating microalgal integrated biorefinery schemes: empirical controlled growth studies and life cycle assessment, Bioresour. Technol. 151 (2014) 19–27. [6] A. Sukenik, Ecophysiological considerations in the optimization of eicosapentaenoic acid production by Nannochloropsis sp. (Eustigmatophyceae), Bioresour. Technol. 35 (1991) 263–269. [7] D. Pal, I. Khozin-Goldberg, Z. Cohen, S. Boussiba, The effect of light, salinity, and nitrogen availability on lipid production by Nannochloropsis sp. Appl. Microbiol. Biotechnol. 90 (2011) 1429–1441. [8] A. Solovchenko, A. Lukyanov, O. Solovchenko, S. Didi‐Cohen, S. Boussiba, I. Khozin‐ Goldberg, Interactive effects of salinity, high light, and nitrogen starvation on fatty acid and carotenoid profiles in Nannochloropsis oceanica CCALA 804, Eur. J. Lipid Sci. Technol. 116 (2014) 635–644.
[9] G.W. Griffith, M.A. Kenslow, L.A. Ross, A mass culture method for Tetraselmis sp. a promising food for larval crustaceans, Proceedings of the Annual Workshop—World Mariculture Society, 4, 1973, pp. 289–294. [10] H.K. Lichtenthaler, Chlorophylls and carotenoids: pigments of photosynthetic biomembranes, Methods Enzymol. 148 (1987) 350–382. [11] M. Scholz, Case study: design, operation, maintenance and water quality management of sustainable storm water ponds for roof runoff, Bioresour. Technol. 95 (2004) 269–279. [12] J. Folch, M. Lees, G.H. Sloane-Stanley, A simple method for the isolation and purification of total lipids from animal tissues, J. Biol. Chem. 226 (1957) 497–509. [13] A.F. Talebi, S.K. Mohtashami, M. Tabatabaei, M. Tohidfar, A. Bagheri, M. Zeinalabedini, H.H. Mirzaei, M. Mirzajanzadeh, S.M. Shafaroudi, S. Bakhtiari, Fatty acids profiling: a selective criterion for screening microalgae strains for biodiesel production, Algal Res. 2 (2013) 258–267. [14] T.A. Beachama, C. Bradley, D.A. White, P. Bond, S.T. Ali, Lipid productivity and cell wall ultrastructure of six strains of Nannochloropsis: implications for biofuel production and downstream processing, Algal Res. 6 (2014) 64–69. [15] I.K. Goldberg, S. Boussiba, Concerns over the reporting of inconsistent data on fatty acid composition for microalgae of the genus Nannochloropsis (Eustigmatophyceae), J. Appl. Phycol. 23 (2011) 933–934. [16] E. Vareschi, H. Fricke, Light responses of a Scleractinian coral (Plerogyra sinuosa), Mar. Biol. 90 (1987) 395–402. [17] G.O. Kirst, Salinity tolerance of eukaryotic marine algae, Annu. Rev. Plant Biol. 41 (1990) 21–53. [18] T.J. Smayda, B. Mitchell-Innes, Dark survival of autotrophic, planktonic marine diatoms, Mar. Biol. 25 (3) (1974) 195–202. [19] M.W. Fields, A. Hise, E.J. Lohman, T. Bell, R.D. Gardner, L. Corredor, K. Moll, B.M. Peyton, G.W. Characklis, R. Gerlach, Sources and resources: importance of nutrients, resource allocation, and ecology in microalgal cultivation for lipid accumulation, Appl. Microbiol. Biotechnol. 98 (2014) 4805–4816. [20] A. Mühlroth, K. Li, G. Røkke, P. Winge, Y. Olsen, M.F. Hohmann-Marriott, O. Vadstein, A.M. Bones, Pathways of lipid metabolism in marine algae, co-expression network, bottlenecks and candidate genes for enhanced production of EPA and DHA in species of Chromista, Mar. Drugs 11 (2013) 4662–4697. [21] M.M. Johnson, D.D. Swan, M.E. Surette, J. Stegner, T. Chilton, A.N. Fonteh, F.H. Chilton, Dietary supplementation with γ-linolenic acid alters fatty acid content and eicosanoid production in healthy humans, J. Nutr. 127 (1997) 1435–1444. [22] J.B. Barham, M.B. Edens, A.N. Fonteh, M.M. Johnson, L. Easter, F.H. Chilton, Addition of eicosapentaenoic acid to γ-linolenic acid-supplemented diets prevents serum arachidonic acid accumulation in humans, J. Nutr. 130 (2000) 1925–1931. [23] A.P. Simopoulos, The importance of the ratio of omega-6/omega-3 essential fatty acids, Biomed. Pharmacother. 56 (2002) 365–379. [24] T. Oura, S. Kajiwara, Saccharomyces kluyveri FAD3 encodes an ω3 fatty acid desaturase, Microbiology 150 (2004) 1983–1990. [25] S.Y. Murayama, Y. Negishi, T. Umeyama, A. Kaneko, T. Oura, M. Niimi, U. Kimiko, S. Kajiwara, Construction and functional analysis of fatty acid desaturase gene disruptants in Candida albicans, Microbiology 152 (2006) 1551–1558. [26] L. Yu, G.Y. Ge, J. Tan, C. He, X. Wang, H. Liu, W. Zhao, J. Guo, G. Fu, X. Feng, X. Wang, Experimental investigation of the impact of biodiesel on the combustion and emission characteristics of a heavy duty diesel engine at various altitudes, Fuel 115 (2014) 220–226. [27] J.L. Guil-Guerrero, E.H. Belarbi, M.M. Rebolloso-Fuentes, Eicosapentaenoic and arachidonic acids purification from the red microalga Porphyridium cruentum, Bioseparation 9 (2000) 299–306. [28] S.K. Patidar, M. Mitra, B. George, R. Soundarya, S. Mishra, Potential of Monoraphidium minutum for carbon sequestration and lipid production in response to varying growth mode, Bioresour. Technol. 172 (2014) 32–40. [29] Food and agricultural organization/world health organization, human vitamin and mineral requirements, Report of a Joint FAO/WHO Expert Consultation Bangkok, Thailand, 2002. [30] NRC, Recommended Dietary Allowance, Food and Nutrition Board NRC, 9th ed. National Academy of Science, Washington DC, USA, 1980.