BIOINFORMATICS APPLICATIONS NOTE Systems biology
Vol. 27 no. 8 2011, pages 1176–1178 doi:10.1093/bioinformatics/btr094
Advance Access publication February 23, 2011
A high-throughput processing service for retention time alignment of complex proteomics and metabolomics LC-MS data Isthiaq Ahmad1,2,3,† , Frank Suits4,† , Berend Hoekman1 , Morris A. Swertz2,3,5 , Heorhiy Byelas1,2,5 , Martijn Dijkstra1,2,6 , Rob Hooft2 , Dmitry Katsubo2 , Bas van Breukelen2,3,7 , Rainer Bischoff1,2,3 and Peter Horvatovich1,2,3,∗ 1 Analytical
Associate Editor: Alfonso Valencia
ABSTRACT Summary: Warp2D is a novel time alignment approach, which uses the overlapping peak volume of the reference and sample peak lists to correct misleading peak shifts. Here, we present an easyto-use web interface for high-throughput Warp2D batch processing time alignment service using the Dutch Life Science Grid, reducing processing time from days to hours. This service provides the warping function, the sample chromatogram peak list with adjusted retention times and normalized quality scores based on the sum of overlapping peak volume of all peaks. Heat maps before and after time alignment are created from the arithmetic mean of the sum of overlapping peak area rearranged with hierarchical clustering, allowing the quality control of the time alignment procedure. Taverna workflow and command line tool are provided for remote processing of local user data. Availability: online data processing service is available at http://www.nbpp.nl/warp2d.html. Taverna workflow is available at myExperiment with title ‘2D Time Alignment—Webservice and Workflow’ at http://www.myexperiment.org/workflows/.html. Command line tool is available at http://www.nbpp.nl/Warp2D_ commandline.zip. Contact:
[email protected] Supplementary information: Supplementary data are available at Bioinformatics online. Received on September 18, 2010; revised on January 12, 2011; accepted on February 14, 2011
1
BACKGROUND
Retention time alignment to correct non-linear retention time shifts (Podwojski et al., 2009) between different chromatograms is a crucial step in the processing of label-free liquid chromatography
∗ To
whom correspondence should be addressed. authors wish it to be known that, in their opinion, the first two authors should be regarded as joint First Authors. † The
1176
coupled to mass spectrometry (LC-MS) data for proteomics and metabolomics comparative profiling studies. A complex ‘omics’ chromatogram contains signals from thousands of compounds, and small shifts may lead to improper matching of peaks that are derived from the same compounds leading to inaccurate statistical analysis and possibly to erroneous conclusions on the experimental outcome (Christin et al., 2008, 2010; Suits et al., 2008). We have recently published a novel time alignment algorithm, Warp2D (Suits et al., 2008), that is based on correlation optimized warping (COW) (Christin et al., 2008; Nielsen et al., 1998; Tomasi et al., 2004; van Nederkassel et al., 2006) to maximize the total peak volume overlap between the reference and sample chromatograms using LCMS peak lists as input data. The peaks in these LC-MS peak lists are considered as three-dimensional Gaussian peaks in the retention time, mass to charge ratio and intensity space. Peak widths in the retention time and mass to charge ratio are related to the mass and chromatographic resolutions, and analytical formula can be derived to calculate the individual peak volume and peak volume of the overlap of multiple peaks. Overlap of multiple peaks is used in the benefit function of the COW procedure in Warp2D (Suits et al., 2008) to drive the retention time correction. By considering the overlap of three dimensional Gaussian peaks, Warp2D takes account for the separation of peak in mass dimensions beside the separation of the peaks in the retention time dimension when correcting for nonlinear retention time shifts. The concept of Warp2D is fundamentally new compared with other time alignment methods either using onedimensional mass traces (Eilers, 2004; van Nederkassel et al., 2006) in their benefit function, peak lists of multiple chromatograms with local regression techniques (Podwojski et al., 2009), algorithms using a two-dimensional benefit function such as a Hidden Markov Model combined with a Continuous Profile Model (Listgarten et al., 2007) or the recently introduced COW-CODA (Christin et al., 2008), PTW-CODA and DTW-CODA (Christin et al., 2010) algorithms combining COW, dynamic time warping (DTW) (Kassidas et al., 1998) and parametric time warping (PTW) (Eilers, 2004) with a Component Detection Algorithm (CODA) (Christin et al., 2008). We previously showed that Warp2D can successfully align peak lists of chromatograms obtained from complex serum and urine samples,
Downloaded from http://bioinformatics.oxfordjournals.org/ at University Library on May 30, 2012
Biochemistry, Department of Pharmacy, University of Groningen, Groningen, 2 Bioassist, Netherlands Bioinformatics Centre, Nijmegen, 3 Bioinformatics in Proteomics, Netherlands Proteomics Centre, Utrecht, The Netherlands, 4 Protein Science Group, IBM T.J. Watson Research Centre, Yorktown Heights, New York, USA, 5 Genomics Coordination Center, Department of Genetics, University Medical Center Groningen, Groningen, 6 Center for Medical Biomics, University of Groningen Groningen and 7 Biomolecular Mass Spectrometry and Proteomics Group, Utrecht University, Utrecht, The Netherlands
© The Author 2011. Published by Oxford University Press. All rights reserved. For Permissions, please email:
[email protected]
[11:57 5/4/2011 Bioinformatics-btr094.tex]
Page: 1176
1176–1178
Retention time alignment
A
B
even if compounds in these samples have large concentration variability with maximum 3–5 min of retention time shifts. Here, we report development of a high-throughput processing service to perform time alignment and quality assessment based on the Warp2D approach. This service is able to perform several hundreds of time alignments per hour for a large number of users by using the Dutch Life Science Grid (DLSG) through an easyto-use web interface available at the portal of the Netherlands Bioinformatics for Proteomics Platform.
2
EASY-TO-USE WEB PAGE FEATURES
Warp2D uses space-delimited ASCII peak lists with three columns containing the mass to charge ratio, retention time and peak quantity (height, area or volume). We have chosen this simple format because there is no accepted standard format to store LC-MS peak list. European Bioinformatics Institute is preparing the mzQuantML standard format for preprocessed LC-MS data such as peak lists and aligned peak matrix (Orchard et al., 2010) and currently the APML format introduced in Corra (Brusniak et al., 2008) LC-MS data processing framework is the only available format to store this type of data. We have, therefore, developed a tool that converts LCMS peak lists in APML format to our format and placed the converter as java command line tool at http://www.nbpp.nl/warp2d.html. As soon as the new official mzQuantML format will be available, we will provide the possibility to use data in this format. The full parameter list, input/output file formats with detailed explanations, tutorial and example dataset used in this application note are available at the web page of the Warp2D processing service (http://www.nbpp.nl/warp2d.html).
Warp2D generates three output files: the warped sample chromatogram peak lists with .wpks extension, the .tmap file containing the segment endpoint pairs in the time unit of the original peak list before and after time alignment and the quality file with .qual extension containing all parameters and quality scores reflecting the similarity of the reference and sample peak lists before and after time alignment. Since the .tmap file contains the retention time transformation of the sample chromatogram segment, one can use it to calculate any retention time shift by linear interpolation within the corresponding time segment. Details on the quality score and the most important parameters are provided in the Supplementary Material.
3
TAVERNA WORKFLOW AND COMMAND LINE OPTION
Downloaded from http://bioinformatics.oxfordjournals.org/ at University Library on May 30, 2012
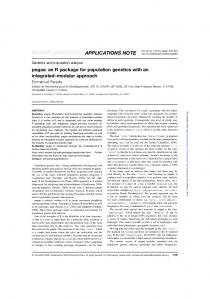
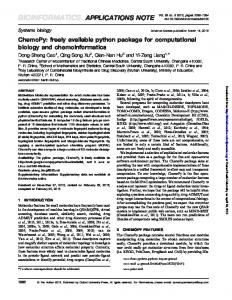
Fig. 1. Heat map showing the arithmetic mean of the overlapping peak volume calculated before (A) and after (B) time alignment using all possible alignment pairs between 24 chromatograms (576 time alignments) obtained in an experimental design study of a shotgun proteomics analysis of mouse serum (higher is better). Rearranging the order of the reference and sample peak lists using hierarchical clustering of the obtained quality scores after time alignment provides an overview over clusters with peak lists of high similarity, for which time alignment was successful. In this example, chromatograms obtained within the same laboratory form separate clusters, indicating that time alignment is only successful between files from the same laboratory using the applied parameters (mzwidth 0.1; rtwidth 0.2; Window size 50; Slack 20; Max peaks/segment 50; No. of time points 2000; Cons. time shift 0).
The web user interface provides a convenient easy-to-use access to the high-throughput Warp2D LC-MS time alignment service. This application is build on a web service, and to facilitate the reuse of this web service programmatically by bioinformaticians, we developed a Taverna (Hull et al., 2006) workflow and command line java tool (supporting material and http://www.nbpp.nl/warp2d.html, the web page contains a detailed description of these tools). These tools enable simple remote processing of data located on a user’s computer, automating the process of sending data to and from the grid computational resource. These tools allow the incorporation of the Warp2D LC-MS time alignment service into Taverna pipeline or in any other program or script while having the benefit of the vast processing power of the DLSG.
1177
[11:57 5/4/2011 Bioinformatics-btr094.tex]
Page: 1177
1176–1178
I.Ahmad et al.
4
CASE STUDY AND CONCLUSIONS
Funding: Bioassist program of the Netherlands Bioinformatics Center (reference NBIC/KvH/ff/2007.049); NWO (Rubicon
Conflict of Interest: none declared.
REFERENCES Brusniak,M.Y. et al. (2008) Corra: computational framework and tools for LC-MS discovery and targeted mass spectrometry-based proteomics. BMC Bioinformatics, 9, 542. Christin,C. et al. (2008) Optimized time alignment algorithm for LC-MS data: correlation optimized warping using component detection algorithm-selected mass chromatograms. Anal. Chem., 80, 7012–7021. Christin,C. et al. (2010) Time alignment algorithms based on selected mass traces for complex LC-MS data. J. Proteome. Res., 9, 1483–1495. Eilers,P.H. (2004) Parametric time warping. Anal. Chem., 76, 404–411. Hull,D. et al. (2006) Taverna: a tool for building and running workflows of services. Nucleic Acids Res., 34, 729–732. Kassidas,A. et al. (1998) Synchronization of batch trajectories using dynamic time warping. AIChE J., 44, 864–875. Listgarten,J. et al. (2007) Difference detection in LC-MS data for protein biomarker discovery. Bioinformatics, 23, e198–e204. Nielsen,N.P.V. et al. (1998) Aligning of single and multiple wavelength chromatographic profiles for chemometric data analysis using correlation optimised warping. J. Chromatogr. A, 805, 17–35. Orchard,S. et al. (2010) Tackling quantitation: a report on the annual Spring Workshop of the HUPO-PSI 28-30 March 2010, Seoul, South Korea. Proteomics, 10, 3062–3066. Podwojski,K. et al. (2009) Retention time alignment algorithms for LC/MS data must consider non-linear shifts. Bioinformatics, 25, 758–764. Suits,F. et al. (2008) Two-dimensional method for time aligning liquid chromatographymass spectrometry data. Anal. Chem., 80, 3095–3104. Tomasi,G. et al. (2004) Correlation optimized warping and dynamic time warping as preprocessing methods for chromatograpic data. J. Chemometrics, 18, 231–241. van Nederkassel,A.M. et al. (2006) A comparison of three algorithms for chromatograms alignment. J. Chromatogr. A, 1118, 199–210.
Downloaded from http://bioinformatics.oxfordjournals.org/ at University Library on May 30, 2012
Figure 1 presents two heat maps before and after time alignment showing the arithmetic mean of the sum of overlapping peak volume for 24 chromatograms obtained in an experimental design study to measure proteins quantity in serum from different mouse cancer models, treated with different depletion techniques, measured in different laboratories with different Quadrupole Time Of Flight mass spectrometers, from healthy mice or mice with cancer using a shotgun proteomics approach. The order of files was rearranged using hierarchical clustering of the arithmetic mean of the sum of overlapping peak area in order to identify chromatogram clusters with high similarity. The quality of the heat maps in Figure 1 indicates that chromatograms acquired within the same laboratory can be successfully aligned. The quality matrix that served for the heat maps can be used to select the best reference chromatograms for the final time alignment (e.g. the peak list having the highest quality score after time alignment) for the two peak list clusters. The user-friendly web interface destined for users with little bioinformatics experience allows the use of the Warp2D approach for alignment of large numbers of complex LC-MS chromatograms and provides an overview on the file clusters which can be successfully aligned within a given dataset. Execution time with regular settings of one alignment using peak lists of 5 MB containing 200 000 non deisotoped and non-decharged peaks takes 8–12 min on a regular PC (Intel® Core™ Quad CPU Q9300 @ 2.5 GHz processor and 8 GB of RAM), while 576 time alignments of 24 peak lists took 40–70 min using our web portal depending on the availability of the DLSG computational resources. The same number of alignments on a PC with single or four processing nodes would take 4 days or 1 day, respectively. The processing service includes free access to 10 GB of disk space to store the initial peak lists and processing results.
Grant 825.09.008); Netherlands Proteomics Center II (reference NPC II E4.2) for financing this research and SARA for providing access to DLSG.
1178
[11:57 5/4/2011 Bioinformatics-btr094.tex]
Page: 1178
1176–1178