A further visualization tool provided by BioJake is the representation of. Activation .... which queries are available for execution on the specified server and the.
Pacific Symposium on Biocomputing 4:392-400 (1999)
BioJAKE: A TOOL FOR THE CREATION, VISUALIZATION AND MANIP ULATIO N O F METABO LIC P ATH WAYS WAYNE SALAMONSEN, KEVIN YEE CHUEN MOK, PRASANNA KOLATKAR BioInformatics Centre, National University of Singapore, 5 Lower Kent Ridge Road, National University Hospital (Lily Lobby), Singapore 119074 S. SUBBIAH BioInformatics Centre, National University of Singapore, 5 Lower Kent Ridge Road, National University Hospital (Lily Lobby), Singapore 119074 and Wistar Institute, 3601 Spruce St, Philadelphia PA 19104, USA. The BioJAKE program has been created for the visualization, creation and manipulation of metabolic pathways. It has been designed to provide a familiar and easy-to-use interface while still allowing for the input and manipulation of complex and detailed metabolic data. In recognition of the detailed and diverse sources of data available across the Internet, it also provides a mechanism by which remote database queries can be stored and performed with respect to individual molecules within a pathway. This remote database access functionality is offered in addition to comprehensive local database creation, management and querying capability. The program has been developed in Java so as to provide for platform independence and maximum extendibility.
1.
Introduction
The creation and visualization of metabolic pathways has always posed a challenge to bio-researchers around the world. While the idea is a simple one, the actual creation of complex pathway drawings is no simple task. Historically, such diagrams were drawn on paper, a highly exacting task for complex pathways as changes could not easily be made as the drawing progressed, and indeed once finished, the drawing was static for its lifetime [5]. The advent of computers has made a huge difference to the drawing of pathways as it has for all such drawing and construction processes. Drawing packages exist to allow the manipulation and modification of images and drawings at any point within their lifetime. However, such packages do not simplify the actual drawing and creation of the metabolic pathway diagrams. A user must still take the information in terms of substrates, products and enzymes and construct the often highly complex drawings associated with the information. This remains a tedious and time-consuming task. Databases that display pathway information and link to other databases also exist [6], however they do not give the user the flexibility to rearrange and add information discovered in their own laboratory. BioJake is a program allowing for the creation, manipulation and visualization of metabolic pathways. It provides easy-to-use mechanisms by which pathways can be constructed either from scratch, or automatically from information stored within databases. The elements of these pathways can then
Pacific Symposium on Biocomputing 4:392-400 (1999)
contain and represent diverse information including state, location, comments and even associated remote database queries. It also has the ability to compute the reactions in which any given molecule is involved, or indeed the sequence of reactions required for a specific pathway to take place at all. The program has been entirely written in Java so as to provide platform independence and to harness the ever-growing functionality offered by the language. As such, tested versions of the program exist for the Windows 95/NT, Macintosh, and various UNIX operating systems. This paper begins by presenting an overview of the BioJake program in Section 2, with particular focus on the on-screen visualization and representation of the molecular pathways and associated information. Section 3 focuses specifically upon the use of Types and States to uniquely specify a molecule’s present state, while Section 4 highlights the remote database query capabilities of the program and more specifically the way in which they tie to individual molecules. Finally, Section 5 provides details on the various data sources that BioJAKE can use to create pathways, Section 6 describes the future directions planned for BioJAKE development and Section 7 summarizes and concludes.
2.
Data Visualisation and Representation
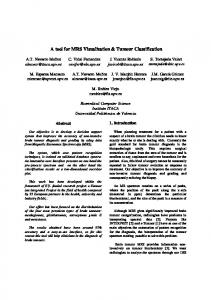
The interface to the BioJAKE program has been specifically designed in a familiar and easy to understand format, similar to that of many drawing programs available today (see Figure 1). It consists of 4 main components: a menubar, toolbar, palette and workspace. The workspace dominates the screen and represents the area in which a user actually creates, views and manipulates the current pathways of interest. The menubar, toolbar and palette provide the mechanisms by which the program’s various functionalities can be brought to bear upon the pathways presently displayed within the workspace. Pathways are represented on-screen as a series of molecules (images), connected together by reaction lines. These reaction lines illustrate the reaction binding the molecules together in terms of substrates, enzymes and products. New molecules can be created and connected together to form various reactions using the tools provided in the palette. In addition, each molecule has specific, detailed information associated with it. It is the combination of this associated information that makes a molecule unique. Associated information includes a molecule name, type, image, state, comments, and database queries. To avoid screen clutter and confusion, this information is not displayed directly upon the workspace but is made available for review at all times through the provided Information Window (see section 2.). There are 3 different forms of molecules available for creation: simple, complex and group. Simple molecules consist of a single molecule type while Complex molecules consist of multiple types (see Section 3). Group nodes represent multiple simple and complex molecules that have been clustered
Pacific Symposium on Biocomputing 4:392-400 (1999)
together to hide complexities and provide for various levels of information abstraction.
Figure 1: BioJAKE main screen 2.1 Molecule and Reaction Properties Each on-screen molecule or reaction has information or properties associated with it. It is the values of these molecular properties that determine which molecule is actually represented by the image on the screen. The properties specifiable are name, type, state and associated details, location, comments, and associated BioKRIS (Kleisli Related Integration Software) [3, 4] and other remote database queries. Each molecule is automatically provided with a unique name upon creation, which the user may alter as desired. Each molecule must also have a type specified. This type is based upon the underlying type database (see Section 3) and determines what the molecule actually is or represents. The available states and details for this molecule are dependent upon the choice of type. For example, type protein would give you choices of states including phosphorylation, glycosylation, and carboxylation. Each molecule also has a representative location: in cell, out cell, nucleus, membrane, or other organelle. This location is represented on-screen by a series of color bands surrounding the
Pacific Symposium on Biocomputing 4:392-400 (1999)
molecule’s image. Information in the form of comments is accepted to help provide details on the molecule and clear up any anomalies. Finally, a series of remote database queries may be associated with the molecule. These queries take two forms: BioKRIS database queries and Other queries such as Prosite, Entrez, and Blast. [1, 7, 9] (see Section 4 for more information on remote database queries). 2.2 Group Nodes for multiple abstraction levels Due to the complexities of many pathway diagrams, a grouping functionality has been built into BioJAKE. Using this facility allows a series of molecules and reactions within a pathway to be grouped together and represented by a single image or Group node. Groups may include other Group nodes and the workspace may be zoomed into a group in order to display the contents of that group to the user. The contents of the group can be fully altered while in this zoomed state. This combination of grouping, zooming and editing allows a pathway to be built as a series of information abstraction levels. In this way, a pathway can be built to display all high level general details, while allowing the user to zoom into specific areas of interest to see all the finer details. 2.3 Activation/Inhibition A further visualization tool provided by BioJake is the representation of Activation and Inhibition within a reaction. This involves the specification of all molecules that activate or inhibit a specific reaction by the user. Upon specification, the newly activated or inhibited state is represented on screen by a large + or – symbol alongside the reactions. Details, as always, appear within the Information Window. 2.4 Background images In order to facilitate the easy production of pathways based upon existing information, one can incorporate a background image behind the workspace. This image may then be used as a template for pathway construction. To further facilitate this generation process, portions of this background image may be selected and clipped in order to produce a new image for molecule representation within the pathway. This process is referred to as iconization. The exact process of iconization involves the selection of a given section of the background image. This section is saved as a new image and becomes the basis of a new molecule that is created. This molecule is given an “Unknown” type and placed in the same position from which it was originally cropped. Users may continue to use this same image as the basis for other molecules created in future. Once a user has created all the molecules they desire based upon the background template, they can choose to remove the background
Pacific Symposium on Biocomputing 4:392-400 (1999)
image. This leaves the molecules and any reactions they have created sitting upon an empty background creating a clear and precise molecular pathway. 2.5 Information Window The Information Window is a floating window that provides an instant point of reference for any information pertaining to the currently selected molecule or reaction. Information shown within this window includes such items as a molecule’s name, type, state, immediate reactions it is involved in, location, and comments. Similar information is displayed for reactions. In addition to this immediate information provision, it also acts as the starting point to other means of obtaining and specifying information. Via a series of buttons at the bottom of the window a user may execute queries associated with a molecule (see section 4), enter comments on a molecule or view the reaction hierarchy in which the reaction or molecule is currently involved. This reaction hierarchy is illustrated to the user as the series of reactions involving the reaction or molecule currently selected. The user may choose to see all of the reactions or can specify any hierarchical level for displaying reactions. Selection of a given reaction in the list causes the on-screen representation of that reaction to become highlighted in the specified color. Multiple reactions may be highlighted simultaneously using different colors. This will enable users to investigate the potential interplay of reactions.
3.
Type and State information
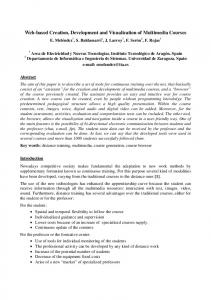
The basis underlying every molecule within a BioJAKE pathway is the idea of Types and States. It is the combination of the Type, State and molecule name that makes a node unique within the pathway. Types provide for the representation of entities such as protein or nucleic acid, while States allow for details such as phosphorylation or capping. It would clearly be an impossible task for any program to provide details on every Type in existence. However, by making use of the fact that all specific types can be represented by a few more general, generic types, this problem is solved by the provision of an initial type tree. This type tree has a series of top level types that can be used to describe all possible molecular types. Beneath these general types are more specific types, and beneath them, more specific types again. These Type relationships are illustrated schematically in Figure 2. Each of the top-level general types provides certain states that apply to all types within that general category. In this way, all specific types within the tree inherit their possible states from their most general parent Type. In a similar way, molecular icons or images are specified for the general types and inherited down the type tree.
Pacific Symposium on Biocomputing 4:392-400 (1999)
The provision is made however for a user to add new types to this tree. The only restriction placed upon the user when adding types is that the newly added type may not be one of the top level general types. That is, it must be classified beneath one of these general types. In this way, it inherits all of the state information for the type and the user may not specify new state information. The new type however may specify a new icon for the molecule that will override any icon inherited from a parent type. This method of allowing user defined types, provides a mechanism by which users can build up their own database of types, allowing the specific types most relevant to their field of interest to be represented.
Figure 2: Schematic example of Type hierarchy
4.
Remote Database Queries
One of the most useful and powerful functionalities that the BioJAKE program provides is the ability to store and perform remote database queries with respect to particular molecules within a pathway. Two forms of remote database queries are supported: BioKRIS queries and other queries. BioKRIS queries are designed to tie into the BioKRIS system, which provides a mechanism for performing queries across multiple databases. BioKRIS queries are performed via a server demon process running on a specified BioKRIS server. This daemon informs the BioJAKE program of which queries are available for execution on the specified server and the corresponding parameters that may be specified. In order to conduct a query, the user need merely select the query they wish to perform, customize the query by altering the necessary parameters and then execute it via the Information Window. Other Database queries are performed in a similar fashion. They do not however, rely upon a daemon server for any information. The list of available databases for queries is hard coded into the BioJAKE program along with their appropriate parameters and default values. The user once again need merely select the database they wish to query, fill in the query terms and any other required parameters and once again execute the query via the Information Window.
Pacific Symposium on Biocomputing 4:392-400 (1999)
Upon execution, a new thread is spawned to perform the database query, thus allowing the user to continue working while the query is performed. This thread maintains a status window to inform the user of the current status and any difficulties performing the query. Upon completion, the results of the query are displayed in html format in the user-specified web browser. If no web browser is specified then the user is given the filename in which the results are stored.
5.
Data Sources
Apart from the construction of new metabolic pathways molecule by molecule, there are a number of sources from which data can be taken to facilitate pathway creation, and indeed used for pure visualization purposes. These sources include previously created BioJAKE pathways, local BioJAKE specific databases, and existing third-party databases. The first of these sources is that of previously saved BioJAKE workspaces. These workspaces represent those that have been previously created using the BioJAKE program and saved to disk through the standard save mechanism. They are recreated on the screen in the exact same format as they were saved, including all molecules, reactions, and descriptive text boxes. A more interesting source of data however lies in the local BioJAKE specific databases. There are three such databases: molecule, reaction, and pathway. All of the information located in these databases is created and stored via the BioJAKE program. However, rather than simply saving the entire workspace contents to a file, they allow for the storage of individual molecules, reactions and pathways in a format that permits keyword searching and easy future incorporation into new pathways. The molecule database contains basic information pertaining to individual molecules including name, type, state and location. The reaction database contains information relating to individual reactions including the specification of the molecules involved within the reaction and their function within the reaction as a substrate, enzyme or product. Finally, the pathway database contains all the information necessary to recreate a full metabolic pathway. This information effectively consists of all the reactions that go to make up the pathway in question. The BioJake database structure yields much synergy and interaction between the individual databases. The pathway database contains a series of reactions involved in the pathway, but not the reaction specifics themselves. All of the reaction information is present within the reaction database and in turn, the molecules found within the reaction database have all of their respective details within the molecule database. The final source of information to the BioJAKE program is in the form of importation from other third-party databases. A number of existing databases, such as Swiss-Prot [2], are directly supported allowing the instant importation of pathways from those databases along with their associated molecular details. In addition, support for a more neutral import format is planned in the near future. This neutral format, necessitated by the lack of a general database standard in
Pacific Symposium on Biocomputing 4:392-400 (1999)
this area, will provide an easy, intermediate step for databases desiring to be supported by BioJAKE. Any third-party database that can convert its data to this neutral format will be guaranteed support in the form of importation into the BioJAKE program and access to all of the functionality provided therein.
6.
Future Directions
While the existing version of the BioJAKE program provides all of the basic functionality needed to visualize and manipulate metabolic pathways, there remains much that can be done to further improve and expand upon the existing program. This includes but is not limited to: multiple document format, enhanced pathway visualization, and reaction simulations. The idea behind a multiple-document format is to allow multiple workspaces containing pathways to be opened simultaneously. This has the obvious advantage of allowing the quick and easy transfer of information between documents through cut-and-paste or drag-and-drop functionalities. It also allows for easy on-screen comparison and simultaneous viewing of data from multiple pathway files. The main pathway visualization enhancement would be a move towards three-dimensional pathway representations. The provision of three-dimensional pathway visualization is an obvious one given that metabolic pathways are complex and multi-dimensional in nature and not the simplistic two-dimensions usually displayed. By presenting the user with a three-dimensional view, a better and more realistic understanding of the true relationships within a pathway can be gained. It is also anticipated that new users will find it easier to learn and use the product on the basis of this increased realism. As an additional form of visualization enhancement, further work will also be done in solving any ambiguities involved in edge crossings in both two and three-dimensional pathways. Finally, the addition of reaction simulations within the BioJAKE program would remove the necessity of exporting reaction information to third-party simulation applications, like MADONNA [8]. Given that the BioJAKE program already stores the information required for such simulations, it is a simple matter of adding the user interface elements required to start, manage and visualize the reaction process once an appropriate simulations systems is chosen.
7.
Conclusions
This paper has outlined the BioJAKE program as a method for creating, visualizing and manipulating metabolic pathways. It has provided an insight into the variety of functions offered by the program to users and provided a glimpse at the easy-to-use interface that acts as the main point of user
Pacific Symposium on Biocomputing 4:392-400 (1999)
interaction and pathway visualization. In addition, it presented a closer look at the underlying type and state model used to represent molecules within pathways and focused in some detail upon the program’s ability to link both local and remote database queries to individual molecules. A final look was also taken at the future directions in which program development is expected to continue. Acknowledgements We would like to acknowledge the significant work contributed to this project by the BioJAKE software development team. Specifically Marie Wong and Zac Leow, who along with Wayne Salamonsen and Kevin Yee Chuen Mok, have 1 produced the program this paper describes. We also thank Daphna Strauss and Oliver Wu for discussions on biological context. S.Subiah would like to acknowledge DOE grant DE-FG03-95ER62135 for partial support References 1. 2. 3.
4.
5. 6.
7. 8. 9.
1
Altschul S.F., Gish W., Miller W., Myers E.W. & Lipman, D.J., "Basic Local Alignment Search Tool". J. Mol. Biol. 215:403-410. 1990. Bairoch A., "The Swiss-Prot Protein Sequence Data Bank User Manual", available at http://expasy.hcuge.ch/txt/userman.txt Buneman P., Davidson S.B., Hart K., Overton C., & Wong L., “A Data Transformation System for Biological Data Sources”. In Proceedings of 21st International Conference on Very Large Data Bases, 158-169, Zurich, Switzerland. September 1995. Davidson S., Overton C., Tannen V. & Wong L., “BioKleisli: A Digital Library for Biomedical Researchers”. International Journal of Digital Libraries, 1(1):36-53. April 1997. rd Gerhard M. Biological Pathways, 3 ed., Boehringer Mannheim, Mannheim, Germany. 1992. Goto S., Bono H., Ogata H., Fujibuchi W., Nishioka T., Sato K., & Kaneisha M., “Organizing and Computing Metabolic Pathway Data in Terms of Binary Relations”. In Pacific Symposium on Biocomputing ‘97(ed. Altman R.B., Dunker K., Hunter L., & Klein T.E.),175-186. World Scientific Publishing, Singapore. 1996. Madden T.L., Tatusov R.L. & Zhang J., "Applications of Network BLAST Server" Meth. Enzymol, 266:131-141. 1996 Macey R.I. & Oster G.F, MADONNA numerical simulation program. Information at http://www.kagi.com/authors/ madonna/default.html Schuler G.D., Epstein J.A., Ohkawa H. & Kans J.A., “Entrez: Molecular Biology Database and Retrieval System”. Methods Enzymol 266:141-162. 1996
More information about the BioJAKE program and how to obtain a copy can be found at http://www.bic.nus.edu.sg/biojake