machine used is our SMILE Beowulf cluster [3,4]. ... Use an MPEG encoder application to convert a series of bit map images into MPEG-1 movies. Again ...
Building a Low-cost Visualization Tool for Simulated Fluidized Bed Flow Putchong Uthayopas, Tasama Sanprasert, Roungrote Mungkung
Sunun Limtrakul
T. Kawaguchi, Y. Tsuji
Parallel Research Group, Computer and Network System Laboratory Department of Computer Engineering Faculty of Engineering, Kasetsart University
Department of Chemical Engineering Faculty of Engineering, Kasetsart University
Department of Mechanical Engineering, Osaka University Osaka, Japan.
Abstract The study of fluidized bed flow is important and has a broad applicability in chemical industry. However, simulating this phenomenon usually generates huge amount of numerical data that is difficult to understand by engineers and scientists. Thus, visualization is crucial in interpreting the results obtained. This paper presents the work on building a simple visualization tool for simulated fluidized bed flow by employing many public domain software and TCL/TK script language. A GUI interface has been built to help researchers generate serie of images and MPEG movie from simulated data. In addition, we use parallel processing technique on Beowulf PC cluster to speedup the process of graphics rendering. The software obtained can be used effectively to visualize the simulated particle movements in a fluidized bed system.
1.
Introduction and Background
Fluidized bed flow simulation is a study of particle movement in fluidized bed by simulating the movement of each particle [1]. Due to the complex interaction among numerous particles in a fluidized bed, the particles movement can be tracked by performing flow simulation. The flow pattern of particles in fluidized bed is important for the design and operation of the bed itself. Generally, the simulation of a several hundreds time steps may generate tens of megabyte of numerical data. Although this data is useful for further analysis, understanding the information inherent in this data is usually beyond human perception. Thus, visualization can increase the understanding of the model dramatically. Many commercial software packages such as AVS or Iris Explorer can be used for this purpose. Yet, the cost of purchasing these softwares is prohibitively high. In this paper, we show that a simple and cost effective solution is to build the visualization by integrating publicly available tools using powerful script language. We use TCL/TK [2] as a development language for this purpose due to its ease of use, flexibility, extendibility, and strong GUI support. The result is a flexible and low-cost solution that is more suitable for our needs. Moreover, we have also applied some parallel processing technique to speedup the image rendering process. The machine used is our SMILE Beowulf cluster [3,4]. The organization of this paper is as follow. Section 2 presents the basic requirements. Section 3 describes the design and implementation of this tool followed by the results and discussion in section 4. Finally, the conclusion and project direction are presented in section 5.
2.
Basic Requirements
Before one can begin to develop any software, basic requirements must be specified clearly. In order to be useful for our purpose, the visualization tool must have these features: (a) Understand file format generated from simulation program. (b) Have simple to use GUI interface. (c) Enable user to easily change background scene and camera setup of the visualized graphic. (d) Generate series of graphics file that can later be used to build an animated GIF89. This feature enables users to publish the results on WWW easily. (e) Generates MPEG-1 Movies.
These requirements are not trivial. However, with the availability of many tools, it is possible develop a simple visualization software that serves these needs rapidly with only moderate effort.
3.
Design and Implementation
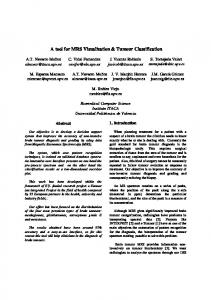
Figure 1 illustrates the steps used to generate animated visualization file. These steps are as explained below. 1. For each time step, generates an object description file for POVRAY public domain rendering software [5]. Each particle is expressed as a sphere object in POVRAY script language. This step generates one object description file for each time step. 2. Rendering each object description file to obtain a bit maps images in portable pixmap format (.ppm) of each time step. This is the most time consuming step. Since the rendering each scene requires no interaction among them at all, they can be done independently on separate computers. Recognizing this opportunity, we developed a script that distributes render tasks to multiple machines. We use this approach on our SMILE Beowulf Cluster to speeding up the rendering process. Output of this step is a serie of images; each image represents each simulation time step. 3. Use an MPEG encoder application to convert a series of bit map images into MPEG-1 movies. Again, a freeware MPEG encoder from University of California at Berkeley has been employed in this process. The final product from this step is an MPEG-I movie that can be played by standard MPEG player such as Xing MPEG Player under Microsoft Windows system.
Fluidize Bed Flow Simulation Data
Converter: Convert Data to Scene Description
Parallel rendering using PC Cluster
Image Sequence
Scene Description for Renderer Sequential Rendering
MPEG Movies
MPEG ENCODER
Figure 1 Steps used to Generate Visualization Graphics In order to build the interface for this software, we decided to use TCL/TK as a development tools. There are many reasons for our choice such as 1. Script based language provides a power environment for rapid prototyping.
2. TCL/TK is cross platform development tool, which is also available for all flavors of UNIX, Windows 95, and Windows NT. This enables us to port software to multiple platforms later. 3. TCL/TK has an easy to use and powerful command for GUI interface generation. 3.1
Converting Raw Data to Object Description File As user start the visualization program; the initial screen as shown in Figure 2 is displayed. User must input the name of input and output file, time step, amount of particles in input file, and the size of final image and movies. Then, user starts the conversion process by clicking at OK button.
Figure 2 ,QLWLDO��6FUHHQ�RI�9LVXDOL]DWLRQ�6RIWZDUH One factor that affects the final visualization is the camera setup. These parameters are illustrated in Figure 3. A special menu is provided to enable the user to define the camera parameters. This menu is depicted in Figure 4. If user do not define this parameter, the default one will be used in rendering process. The camera parameters that can be adjust are: • Location along x,y,z axis • Look at parameter along x,y,z axis • Right, Up, and Angle parameter along x,y,z axis 3.2
Converting Object Description File to Image Series Clicking on “Make Image” button in initial screen activates this step. There are two mode of operation for this step. In sequential mode, software performs the rendering sequentially on one computer by invoking POVRAY renderer. If parallel mode is selected, the rendering function will be distributed to multiple computers. However, there is a special requirement that must be setup in order to use parallel rendering that is: 1. Each participating node must have POVRAY installed in an accessible path. 2. Each node must share the same directory that the rendering graphic is resided.
When this process finish, a set of images in portable pixmap format is generated. This image set is used to generate animation later.
Figure 3 Camera Parameters
Figure 4 Camera Parameter Setting Screen 3.3
Converting Image Series to Animation When user select MPEG button on main screen. The MPEG encoder is invoked to convert image set from previous step into MPEG-1 movies file. We use freeware MPEG encoder from University of California at Berkeley to perform this task. Another alternative is to download all these image sequences onto PC and use a popular utility called GIF construction tool to build an animated GIF89 image. The advantage is that this image can be put on web page. When user retrieve the page, the graphic will be animated immediately. We have put one of the result animation on our web site at “http://smile.cpe.ku.ac.th” as an example.
4.
Results and Discussion
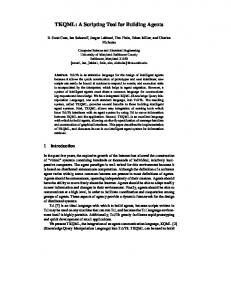
In Figure 5, the result generated from the visualization software is presented. This figure show the movement of particle at different time step when gas is flowing from underneath. From this work, we found that: • Simple software can be built rapidly using available public domain tools. This tool is view as components in software. Modern script language can be used as glue that bind these components together to form usable software rapidly. In addition, good GUI support in this script languages ease the development tremendously. • Even in our case, it is possible to apply techniques in parallel and distributed processing to speedup the task. Since, PC or workstation cluster becomes common nowadays. We expect that this kind of technique will be widely used in the future.
Figure 5 Visualization Result
5.
Conclusion
In this paper, we report our development of a simple and low-cost visualization tool for visualizing the movement of particle in fluidized bed. Using simple script language couples with some freely available software, we can build powerful and easy to use visualization system that suits our need in a very short time. The future developments of this tool will include better GUI interface, a port of this tool to Windows environment, and extension to handle broader type of data related to the movement of particle.
6.
References
1. Y. Tsuji, T. Kawaguchi, and T. Tanaka, “Discrete Particle Simulation of two-dimensional Fluidized Bed”, Powder Technology, 77(1993) pp.79-87.
2. Ousterhout, John K,”TCL and the TK toolkit”, Addison-Wesley, 1994. 3. Putchong Uthayopas, Supaket Katchamart, Jittat Fakcharoenpol, Panit Hemunnopjit, SMILE: Toward the Affordable High-Performance Computing Platform using Network-Based Multicomputer, First National Computational Science and Engineering Symposium, Bangkok, Thailand, March 1997. 4. Putchong Uthayopas, Thara Angskun, Jullawadee Maneesilp, “Building a Parallel Computer from Cheap PCs: SMILE Cluster Experiences”, Proceedings of the 2nd Annual National Symposium on Computational Science and Engineering, pp. 255-264, Bangkok, Thailand, March 1998. 5. ___,”POVRAY User Manual”, http://www.povray.org.