atocyte, or echinocyte. Error rates on this dataset range from 31% to 13.5% [4]. We used a 10-fold cross-validation protocol in which case a method al-.
Biological Image Classification with Random Subwindows and Extra-Trees Rapha¨el Mar´ee, Pierre Geurts, and Louis Wehenkel Bioinformatics and Modeling (CBIG/GIGA) Department of EE & CS, Montefiore Institute University of Li`ege, Belgium
Abstract We illustrate the potential of our image classification method on three datasets of images at different imaging modalities/scales, from subcellular locations up to human body regions. The method is based on random subwindows extraction and the combination of their classification using ensembles of extremely randomized decision trees.
1
Method
Given a set of training images labeled into a finite number of classes, the goal of an automatic image classification method is to build a model that will be able to predict accurately the class of new, unseen images. Our approach is described in details and evaluated on various kind of datasets in [5]. Its main characteristics are summarized as follows. During the training phase, a large number of square subwindows of random sizes are extracted at random positions from training images. Each subwindow is resized to a fixed scale, described by a feature vector of its raw pixel values, and labeled with the class of its parent image. A subwindow classification model is then built by an ensemble of extremely randomized decision trees algorithm [3]. Classification of a new image similarly entails extraction and description of subwindows, and the application of the model to these subwindows. Aggregation of subwindow predictions is then performed to classify the image: We assign to the image the majority class among the classes assigned to its subwindows by the different trees. Note that subwindow individual votes could also help domain experts to focus on discriminative regions in the images. The main parameters of the method are the
number of subwindows extracted during learning (usually a few hundred thousand) and prediction (a hundred or so per image), and the number of trees (about ten). As a general rule, the more subwindows we extract and trees we build, the better the accuracy is. The complexity of the machine learning algorithm is on the order of nT Nls logNls , where n denotes the size of the feature vector, T is the number of trees, and Nls is the total number of subwindows extracted from training images. The size of the Extra-Trees may grow substantially with very large datasets, but the prediction step is on the order of Ntest T d, where Ntest denotes the number of subwindows extracted from an image, and d the average tree depth (which is on the order of logNls ). Thus, the approach scales very well and, moreover, it is easy to parallelize.
2
Results
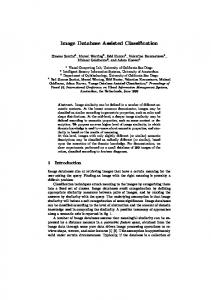
The three types of problems we consider in this paper are illustrated by Figure 1 and our results are provided in the following subsections.
Figure 1: Protein subcellular localizations (top), red blood cells (middle), body X-Rays (bottom).
41
2.1
Subcellular Protein Localization and competitive accuracy results on average, we
We collected from the LifeDB1 and Harvester2 databases a total of 96 pairs of images (corresponding to N- and C-terminal GFP). These pairs are classified in three protein subcellular localizations: nucleus, cytoplasm, and mitochondria. Our leaveone-out prediction error is 9.38%, that improves consequently the error rate of na¨ıve random guessing (66.67%). Of course, to be practically valuable, the method should be evaluated on a larger set of images of lower quality (such as in high-throughput microscopy screens) and that represent additional subcellular localizations [1].
2.2
Red blood cells (RBC)
This database3 contains 5062 RBC images that were labeled by an expert as either discocyte, stomatocyte, or echinocyte. Error rates on this dataset range from 31% to 13.5% [4]. We used a 10-fold cross-validation protocol in which case a method always guessing the most frequent class would achieve an 36% error rate. We observe that the prediction error of our method is lower if the random subwindow sizes are constrained between 80% and 100% of the image size instead of the full range of sizes, with a mean error rate over all subsets of 20.92%±1.53.
2.3
IRMA X-Rays
foresee the use of this automatic approach as a baseline method on various biological image classification problems where a manual approach could be a source of bias and would cause a bottleneck for high-throughput experiments. Moreover, preliminary results show that the extension of the feature vectors and/or minor parameter tuning could possibly improve the default results on specific problems. Extension of this approach to image sequence classification and segmentation also deserves to be studied. A Java software, PiXiT, implements the presented method and it is available upon request for research and evaluation purpose.4
4
Acknowledgments
Rapha¨el Mar´ee is supported by the GIGA interdisciplinary cluster of Genoproteomics of the University of Li`ege with the help of the Walloon Region. Pierre Geurts is a research fellow of the FNRS, Belgium. IRMA database courtesy of TM Lehmann, Dept. of Medical Informatics, RWTH Aachen, Germany.
References [1] C. Conrad, H. Erfle, P. Warnat, N. Daigle, T. L¨ orch, J. Ellenberg, R. Pepperkok, and R. Eils. Automatic identification of subcellular phenotypes on human cell arrays. Genome Research, 14:1130–1136, 2004.
Our first results on this 10000 image dataset (9000 for learning, 1000 for testing) were ranked in the 4th position among 41 methods [2]. Since then, [2] Paul Clough et al. The CLEF 2005 cross-language image retrieval track. In Proc. Workshop Cross– we observe that our 14.7% error rate is further imLanguage Evaluation Forum, LNCS, 2005. proved down to 13.7% if we simply extract more subwindows in the learning and testing phases. It is [3] Pierre Geurts, Damien Ernst, and Louis Wehenkel. even further improved if we add (x, y) absolute poExtremely randomized trees. Machine Learning, 36(1):3–42, 2006. sition coordinates to each subwindow feature vector, hence giving 13.1% error rate. A method al- [4] D. Keysers. Modeling of Image Variability for ways guessing the most frequent class would achieve Recognition. PhD thesis, RWTH Aachen Univer70.3% error rate on this 57-class dataset. sity, Germany, March 2006.
3
Conclusions
We illustrated the potential of our generic image classification method on different kinds of biological images. Thanks to its computational efficiency
[5] Rapha¨el Mar´ee, Pierre Geurts, Justus Piater, and Louis Wehenkel. Random subwindows for robust image classification. In Proceedings of the IEEE International Conference on Computer Vision and Pattern Recognition (CVPR), volume 1, pages 34– 40, June 2005.
1 http://www.dkfz.de/LIFEdb/ 2 http://gfp-cdna.embl.de/ 3 http://www-i6.informatik.rwthaachen.de/web/Research/ipresearch.php
4 http://www.montefiore.ulg.ac.be/∼maree/
42