Biomass Estimation Errors Associated with the Use of Published Regression Equations of Paper Birch and Trembling Aspen J.R. Wang, Faculty of Forestry and the Forest Environment, Lakehead University, 955 Oliver Road, Thunder Bay, Ontario Canada P7B 5E1; A.L. Zhong and J.P. Kimmins, Department of Forest Sciences, University of British Columbia, 2424 Main Mall, Vancouver, BC. Canada V6T1Z4.
ABSTRACT: Since forest biomass contributes a significant proportion of global carbon cycle, obtaining accurate estimate of forest biomass is important. The root mean squared error (RMSE), the percents of the mean observed values were used to compare the precision of local and published biomass equations for paper birch and trembling aspen. With the exception of stemwood biomass equations, the biomass equations for these two species tended to be stand specific. Measured as percent of mean observed values, the values of biomass/tree predicted from the published equations for paper birch varied from 49.9% to 140.2% for foliage and from 155% to 238.7% for live branches; the estimates for trembling aspen ranged from 71.8% to 81.3% for foliage and from 55.3% to 164.5% for live branches. There were large discrepancies between the measured data and the published equations in graphical form as well as biomass estimates, particularly for foliage, live branches, and stembark. Clearly, published regression equations should be checked for their applicability before they are used to estimate the biomass of particular stands. North. J. Appl. For. 19(3):128–136. Key Words: Biomass, equation, paper birch, aspen, estimation error.
Preparation of biomass regression equations for forest trees is expensive and time-consuming. Many biomass equations have been published over the past two decades (Ter-Mikaelian and Korzukhin 1997), and it is therefore natural that practicing foresters on limited budgets will want to use them to estimate individual stand biomass or regional biomass from a large-scale survey. However, biomass estimates for a particular stand obtained using published equations can vary greatly according to which equation is used. This results from differences in stand density, stand development history, and tree growth rates (due to differences in climates and soil, for example) between the stands on which the equations are based and the stands to which they are being applied. Koerper and Richardson (1980) found that substantial errors in biomass estimation could be produced when biomass regression equations established in one area were applied to another. Such estimation errors should be identified before the exist-
NOTE: Jian R. Wang can be reached at (807) 343-8451; Fax: (807) 343-8116; E-mail:
[email protected]. The authors thank Keith Thomas and Min Tsze for their fieldwork. Special thanks to V. LeMay for her valuable comments on this manuscript. The authors gratefully acknowledge the review comments from M. Williams of Rocky Mountain Research Station, USDA Forest Service, K.W. Gottschalk, editor of NJAF, and an anonymous reviewer. Copyright © 2002 by the Society of American Foresters,
128
NJAF 19(3) 2002
ing regional or site-specific biomass equations are used in different regions or sites. The allometric model (Y = aXb), in which X can be measured such as diameter at breast height (dbh), or dbh2 × total tree height, and Y is tree component biomass such as foliage, branch, stemwood or stembark, has been widely used in biomass studies (Feller 1992). Both the linear form [ln (Y) = A + B ln (X)] and nonlinear form (Y = aXb) of the allometric model can be used to develop biomass equations for different tree species. The precision of such allometric equations may be good for stem biomass but is often unsatisfactory for canopy biomass components. Other variables, such as stand age, stand density, crown geometry, and site index, which influence biomass production and allocation, may need to be added to the model to improve the accuracy for these components (Brown 1978, Carter et al. 1986). Paper birch and trembling aspen are the two major hardwood species in the interior of British Columbia. Biomass of the two species is used in the pulp and paper industry, as fuel wood and wafer-board manufacture. These two species are of importance in the functioning of boreal forest. The need to estimate the biomass of paper birch and trembling aspen stands has led to the development of many biomass equations for the two species (Gosz 1980, Ker 1980, Jokela et al. 1981, Pastor and Bockheim 1981, Schmitt and Grigal 1981, Freedman et al. 1982, Wang et al. 1995, 1996). However, the
applicability of published biomass equations developed on one site for biomass estimation on other sites is not well understood and needs to be studied. The relationship between biomass of tree components and corresponding dbh is affected by stand density (e.g., Brown, 1978). Barclay et al. (1986) reported that the proportions of Douglas-fir total biomass allocated to wood, dead branch, and bark decreased, but those in foliage and live branches increased in the thinned stands. The foliage and branch biomass of individual trees declines with increasing stand density in closed stands (Satoo and Madgwick, 1982, Keane and Weetman, 1987). Brown (1978) used stand density as an independent variable in addition to dbh, resulting in reduced residual variation for some conifer species. However, a competition index which reflects stand density and crown geometry may be superior to stand density because it can integrate the cumulative competitive influence of the trees around a subject tree. The objectives of this study were to compare the biomass estimated by a selection of published equations with the measured biomass data, and to demonstrate the magnitude of the biomass estimation error that can occur if a published equation is used without first checking the accuracy with which it describes tree biomass in one’s study area.
Materials and Methods Site Locations The paper birch study was conducted in the Interior CedarHemlock (ICH) zone in the Clearwater district, Kamloops Forest Region, British Columbia. The trembling aspen study area was located in the Boreal White and Black Spruce (BWBS) zone (Meidinger and Pojar 1991) in the Dawson Creek Forest District of northeastern British Columbia. The basic characteristics of study sites and stands for the published biomass regression equations of paper birch and trembling aspen were summarized in Tables 1 and 2. Selection of Sample Trees Age sequences of 5-, 15-, 25-, 54-, 65-, and 95-yr-old stands of trembling aspen, and of 2-, 8-, 15-, 45-, 60-, and 75year-old paper birch stands on various sites (good, medium and poor) were selected in May 1991. Tree biomass was measured between July and August, 1991. The same sam-
pling procedures were used for both trembling aspen and paper birch. Three sample plots (20 × 20 m) were set up in each stand (total sampled 18 plots for each species), and the dbh (≥5 cm dbh) or basal diameter ( 5 cm was taken; for trees with dbh less than 5 cm, 100% of the crown was taken. All leaves were separated from the sampled branches. Fresh weight of all tree components was determined in the field. Subsamples of leaves, live and dead branches, stemwood, and bark were oven-dried at 70°C to determine field moisture content, which was used to convert fresh weight to dry weight. Stem discs cut from the bottom of each stem section were measured to obtain moisture content, specific gravity and bark/wood ratio. Stem volume of each stem section was measured using Smalian formula. Dry weight of stemwood and stembark were calculated on the basis of the above measurements. Development of Biomass Regression Equations The linear form of allometric model [lnY= A + B ln (dbh)] was derived by the least squares method for the tree components (Y) of the 73 and 50 sample trees of paper birch and trembling aspen, respectively. The model was fitted to the data of the sample trees using the general linear model (MGLH) procedures of SYSTAT (Wilkinson 1998). The nonlinear form of the allometric model (Y = aXb) was also fitted to the biomass data of sample trees by Simplex iteration (Wilkinson, 1998). F-tests were performed for the linear model to test if the developed biomass equations were statistically acceptable. The equations derived from linear and nonlinear modelling were compared using the root mean squared error, the percent of mean observed values, and the average difference to select the best equations. The best nonlinear equations and linear
Table 1. Location of study areas for the local and published regression equations for biomass estimation of paper birch and trembling aspen.
Equation no. (source) Paper birch 1. (Wang et al.) 2. (Freedman et al.) 3. (Ker) 4. (Schmitt and Grigal) 5. (Jokela et al.) Trembling aspen 6. (Wang et al.) 7. (Freedman et al.) 8. (Pastor and Bockheim) 9. (Gosz)
Study area
Elevation or site quality
ICHmw subzone, Kamloops, BC Sugar maple–hemlock-pine zone, Central Nova Scotia Cumberland, Nova Scotia Generalized equations, varying locations: northern Wisconsin, New Hampshire, northcentral Minnesota, north western New BrunSWick, Maine (east + south) Cloquet Forestry Centre, University of Minnesota (46°43’N,92°29’W)
Varying (poor–good) — — Varying (poor–rich)
BWBS zone, Dawson Creek, BC Sugar maple–hemlock-pine zone, central Nova Scotia Northern Highlands State Forest, northern Wisconsin (45°50’N,89°40’W) Sangre de Cristo Mt., Santa Fe, New Mexico
Varying (poor–good) — SI50 = 21.5 m
SI50 = 15 m
3109–3231 m NJAF 19(3) 2002
129
Table 2. Characteristics of sampled stands for the local and published regression equations for biomass estimation of paper birch and trembling aspen.
Equation no. (source) Paper birch 1. (Wang et al.) 2. (Freedman et al.) 3. (Ker) 4. (Schmitt and Grigal) (generalized) 5. (Jokela et al.) Trembling aspen 6. (Wang et al.) 7. (Freedman et al.) 8. (Pastor and Bockheim) 9. (Gosz)
Stand age (yr)
Stand density (stems/ha)
Dbh range (cm)
Composition
2–75 — — — 66
627–11300 — — — 158/949*
0.8–39.4 1.1–34.1 2.7–32.8 0.0–29.5 7.1–23.1
Pure — — — Highly mixed
5–95 — 63 80
1025–10400 — 326/1341 2270
0.7–31.7 0.8–26.5 14.7–39.1 —
Pure — Highly mixed Pure
* Stems of birch or aspen/total stems per hectare.
equations, which were retransformed to allometric form, were solved for all trees measured on the sample plots, giving estimates of average plot biomass for the four tree components: foliage, branch, stemwood, and stembark. Comparison of Biomass Estimation Errors from the Published Equations The following two statistics were collectively used to compare the precision of the published biomass equations for paper birch and trembling aspen. Biomass estimates from the published equations then were compared with those measured. Root mean squared errors (RMSE) RMSE is the square root of mean squared error which was calculated as the average squared difference between the observed value versus the predicted value over all sample trees.
[Σ(Yˆ − Y ) ] i
i
N
where Yi = observed values (component biomass of tree samples), and Yˆ = estimates of local or published equations i
based on diameter of breast height of sample trees, and N = number of sample trees. Percent of mean observed values (P) The percents of the mean observed value for all sample data were also used to evaluate the precision of both local and published biomass equations. P was defined as:
[
P = ( ΣYˆi / N
]
[(ΣYi / N ] × 100% = (Yi / Yi ) × 100% ˆ
The equation with P nearest to 100% was deemed to be most precise in biomass prediction. Data points of sample trees and the published biomass equations were plotted together on the same graph for each of the biomass components of foliage, live branches, stemwood, and stembark in order to qualitatively examine the discrepancy. Where a local biomass regression equation proved to be significantly more precise than a comparable published equation, comparison of biomass estimation errors was made on the basis of the biomass estimates derived from the local 130
NJAF 19(3) 2002
Sampling Procedures for Published Biomass Equations of Paper Birch and Trembling Aspen The biomass sampling procedures used for the development of the published equations of paper birch and trembling aspen cannot be detailed here due to the many different methods involved. These procedures are summarized in Table 3
Results
2
RMSE =
equation. Both local and published equations for paper birch and trembling aspen were solved for each 5 cm dbh class from 5 cm to 40 cm, which was comparable to the data range of the sample trees. The estimates from the published equations were compared with those from the local equations, assuming that a biomass estimate derived from a local equation was 100%. Estimates were deemed to be “similar” if a biomass estimate derived from a published equation varied from the local equation by less than ± 20%.
Paper Birch Four sets of published biomass regression equations of paper birch were examined (Table 4). Comparison of root mean squared errors As indicated in Table 5, the root mean squared error (RMSE) was larger or largest for the published foliage equations No. 1 and No. 3, and for the live branch equations No. 3 and No. 4. RMSE was also the largest for the published stemwood equation No. 2 and stembark equation No.3. Comparison of percent of mean observed values As indicated in Table 6, the percent of mean observed value (P) was as low as 49.9% for the published foliage equation No. 1 and as high as 140.2% for No. 3. For the published live branch equations, P varied from 155.0% to 238.7%. The P value varied from 79.0% to 110.9% for the published equations for stemwood. It varied from 75.2% to 81.4% for the published equations for stembark. Graphical comparison As shown in Figure 1A, except for the published foliage equation No. 4, the rest of published equations deviated considerably from the actual data points. All the published live branch equations were clearly different from the data points (Figure 1B) especially for the larger diameter trees. Almost all the published stemwood equations were very
Table 3. Characteristics of sampled stands for the local and published regression equations for biomass estimation of paper birch and trembling aspen.
Equation no. (source) Paper birch 1. (Wang et al.)
No. of sample tree 73
Sampling procedures Stemwood and bark
T for dry (°C)
Random branch method (RBM) 10% crown harvested All branch harvest (ABH) branch (>8 cm) treated as stem Stratified clip (SC), 4 strata, regression method (RM) Mixed methods
Volume-based specific density method (VSDM) three sections/tree VSDM, 2 m/section
13–15
ABH, dry all except boles
DWC, 1.2 m/section
70
28 26 9 14
Same as Paper birch (I) Same as Paper birch (II) RBM, 5 branches/tree, ABH
VSDM, 2m/section VSDM, 2m/section
60 100
2. (Freedman et al.)
29–37
3. (Ker)
45
4. (Schmitt and Grigal) (generalized equations) 5. (Jokela et al.) Trembling aspen 6. (Wang et al.) 7. (Freedman et al.) 8. (Pastor and Bockheim) 9. (Gosz)
Foliage and branch
143–228
closely following the data pattern in graphical form (Figure 1C). This was supported by the fact that the percent of mean observed values varied only from 79.0% to 110.9% (Table 6). The four published equations for stembark did not estimate the stembark biomass accurately especially equation No. 3 (Fig.ure1D). It was concluded based on the above comparisons that: (1) there were significant differences in biomass estimation using different published equations, and (2) except stemwood, there were large differences of biomass estimates of foliage, stembark, especially live branch between using published biomass equations and the observed data, demonstrating that most biomass equations of paper birch are site and/or stand specific. Trembling Aspen Three sets of published biomass equations were examined (Table 4). Comparison of Root Mean Squared Errors As shown in Table 5, the root mean squared error (RMSE) was similar among the published foliage equations and was highest for the published live branch and stemwood equations No. 5, and for the stembark equation No.7. Comparison of Percent of Mean Observed Values As indicated in Table 6, the percent of mean observed values (P) ranged from 71.8% to 81.3% for the published foliage equations. It was 164.5% and 55.3% for the published live branch equation No. 5 and No. 7, respectively, 65.8% for the published stemwood equation No.5, and 71,3% for the published stembark equation No 7. Graphical Comparison As shown in Figure 2A, the graphical form of the published foliage equation No. 5 followed the data pattern more closely while the published equation No. 7 was clearly different from the measured data. All the published live branch equations deviated considerably from the data, indicating that large estimation errors would be produced if these published equations were used for branch biomass estimation for the trembling aspen stands (Figure 2B). With the exception of the published stemwood equation No. 1, the graphical forms of other published equations were similar to the mea-
Dry weight conversion (DWC) based on moisture content Mixed methods
70 105 105
sured data, which fitted well to the data points of the sample trees (Figure 2C). All the published stembark equations were reasonably close to the data pattern except for the larger diameter trees (Figure 2D). Conclusively, like those of paper birch, there were large differences of biomass estimates between all the published equations of live branches and stembark, and between some of the published equations of foliage and stemwood, indicating that the biomass equations of trembling aspen tended to be site-specific.
Discussion Selection of Biomass Regression Models The allometric model (Y = aXb) is commonly used for estimation of tree biomass because it accurately describes accumulation of biomass of tree foliage, branches, stemwood, and stembark. Both the linear form and nonlinear forms of the allometric model can be used to develop biomass equations for many tree species. In our study, the nonlinear form of the model seemed more suitable for the development of stemwood and stembark equations, while the linear form of the model gave the best fit to foliage and live branch data of the sample trees, especially for paper birch. This may be due to different sensitivities of the two forms to sample tree number and tree size. The nonlinear form tends to put much of its weight on large sample trees, while the linear form is more weighed by small sample trees. If the linear form of the model is employed, the distribution of data points of small sample trees has a strong influence on the overall graphical form of the equation, especially in data sets with many small and few large sample trees. In contrast, the small sample trees are often neglected, and large sample trees play a major role in determination of the graphical form of nonlinear allometric biomass equations. This may explain why the linear form of the model was more suitable for the foliage and live branches data which are relatively divergent and account for less amount of the aboveground biomass, while the nonlinear form fitted to the data points of stemwood and stembark better. In the allometric model, the independent variable (X) is usually diameter at breast height (dbh). In some studies, NJAF 19(3) 2002
131
Table 4. Local and published biomass equations of paper birch and trembling aspen.
No.
Equation
Paper birch 1
2†
3†
4
Trembling aspen 5
6†
7
In(F) = –4.0148 + 1.7139 In(dbh) In(B) = –1.4423 + 1.6429 In(dbh) In(SW) = 4.3827 + 3.0221 In(dbh) In(SB) = 5.0932 + 2.6627 In(dbh) N = 37 for F and B, and 29 for SW and SB; Units: kg; dbh: 1.1–34.1 cm In(F) = –4.2579 + 1.8735 In(dbh) In(B) = –4.4464 + 2.5073 In(dbh) In(SW) = –2.7623 + 2.4931 In(dbh) In(SB) = 3.9298 + 2.2795 In(dbh) N = 45, Units: kg; dbh: 2.7–32.8 cm. F = 0.0010††(dbh)3.005 B = 0.0012†† (dbh)3.275 SW = 0.0923†† (dbh)2.480 SB = 0.0407†† (dbh)2.015 N = 168, 177, 228 and 143 for F, B, SW and SB, respectively. Units: kg; dbh: 0.0–29.5 cm. log(F) = 2.58810 + 2.46315 log(dbh) log(B) = 2.17671 + 2.78660 log(dbh) log(SW) = –1.00380 + 2.39242 log(dbh) log(SB) = 1.49858 + 2.11051 log(dbh) N = 13 for F, and 15 for B, SW and SB; Units: kg dbh: 7.1–23. 1 cm In(F) = –4.0359 + 1.6093 In(dbh) In(B) = –1.7812 + 1.6262 In(dbh) In(SW) = –3.4039 + 2.5816 In(dbh) In(SB) = –3.9168 + 2.3528 In(dbh) N = 26, Units: kg, dbh: 0.8–26.5 cm log(F) = 1.615 + 1.492 log(dbh) log(B) = –2.420 + 2.768 log(dbh) log(SW) = –0.766 + 2.199 log(dbh) log(SB) = –1.360 + 2.146 log(dbh) N = 9, Units: kg, dbh: 14.7–39.7 cm In(F) = –0.46292 + 2.36788 In(dbh) In(B) = –0.37374 + 2.82759 In(dbh) In(SW) = –3.70031 + 2.82728 In(dbh) In(SB) = –4.02541 + 2.32646 In(dbh) N = 14,Units:gram for F and B, kg for stemwood and stembark, dbh: unknown cm
R 2*
SEE*
0.896 0.955 0.983 0.977
0.5263 0.3224 0.1720 0.1810
Freedman et al. (1982)
0.91 0.92 0.99 0.99
1.06 1.11 1.01 1.01
Ker (1980)
0.89 0.89 0.98 0.97
1.457 4.226 10.679 0.979
0.88 0.96 0.97 0.95
0.269 0.091 0.065 0.078
Jokela et al. (1981)
0.859 0.903 0.939 0.933
0.6145 0.5024 0.1678 0.1620
Freedman et al. (1982)
0.870 0.947 0.993 0.977
1.36 1.41 1.11 1.19
Pastor and Bockheim (1981)
0.92 0.88 0.97
0.206 0.302 0.139
Gosz (1980)
0.99
0.066
Source
Schmitt and Grigal, (1981)
* R2: coefficient of determination. SEE: standard error of estimate for ln or log unit unless otherwise indicated. † Equations with adjusted SEE in the unit of original data. N: number of sample trees. log : logarithmic base 10. †† Local equations; F: foliage, B: live branch, SW: stemwood and SB: stembark.
Table 5. Comparison of the root mean squared errors between local and published biomass regression equations of paper birch and trembling aspen.
Species Paper birch
Aspen
132
NJAF 19(3) 2002
Equation no. 1 2 3 4 5 6 7
Foliage 3.21 2.72 3.52 2.13 0.97 1.03 0.91
Branch 10.38 6.54 12.16 13.34 7.37 4.61 6.69
Stemwood 20.63 23.89 19.58 15.97 42.96 14.82 15.69
Stembark 3.36 4.18 5.81 5.08 8.23 7.28 11.33
Table 6. Comparison of percentages (%) of mean observed values for local and published biomass equations of paper birch and trembling aspen
Species Paper birch
Aspen
Equation no. 1 2 3 4 5 6 7
Foliage Branch Stemwood Stembark ............................................................. (%) .......................................................... 49.9 238.7 81.7 81.4 62.2 155.0 79.1 80.3 140.2 177.8 110.9 75.2 66.7 209.7 91.0 77.9 81.3 164.5 65.8 86.2 79.2 119.9 104.5 100.4 71.8 55.3 105.3 71.3
dbh2 × total tree height as the independent variable has led to more reliable stemwood and stembark biomass estimation probably due to its representation of basal area, a volume factor (Ker 1980, Freedman et al. 1982). Schmitt and Grigal (1981) reported that estimation error of paper birch bole biomass components was reduced by using height as an additional independent variable in the allometric model. Addition of height in multiple linear birch biomass equations resulted in higher R2 in comparison to the corresponding equation with dbh alone (Freedman et al. 1982). If tree height is involved in the allometric model,
it is certainly desirable that the height of each tree should be measured. However, this is often difficult and expensive. Consequently, where a model based on dbh alone has similar statistical significance in terms of R2 and standard error of the estimate to a model in which dbh2 × ht is used, the former will normally be preferred. Implications of Estimation Error from Different Equations The use of the published equations gave substantially different biomass estimates, especially for foliage and live
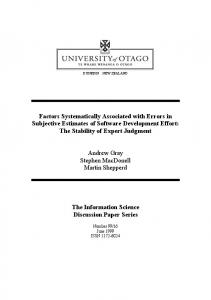
Figure 1. Scattering measured biomass data points and graphical forms of the published biomass regression equations of paper birch. Numbers of the equations are seen in Table 6 . ___ No. 1 ----- No. 2 ------- No. 3 ....... No.4 NJAF 19(3) 2002
133
Figure 2. Scattering measured biomass data points and graphical forms of the published biomass regression equations of trembling aspen. Numbers of the equations are seen in Table 6. ___ No. 5 ----- No. 6 ------- No. 7
branches, and particularly for paper birch. For the dbh classes 5-35 cm, some of the published equations were in reasonable agreement with the measured data over a portion of the dbh range; others produced very different estimates from the local equations over the entire tree size range. As one would expect, the deviation in estimates for a given equation were greatest beyond the dbh range of the data on which it was based, especially for foliage and branch biomass estimates (Table 2, Figures 1 and 2). These results suggest that biomass estimation errors can result from: (1) using an equation which was developed in an entirely different area without checking its applicability, (2) using an equation beyond its data range, and (3) using equations within their dbh range, but without comparable stand densities, age, site quality, and stand development. Effects of Stand Age on Biomass Estimation Errors Our results demonstrate the wide variation of biomass estimates that can result from different equations. Generally, the best agreement was for stands of similar age which resulted in similar dbh range. This is due to the 134
NJAF 19(3) 2002
change of patterns of biomass production and allocation and tree dbh distribution as stand ages change. Ratios of foliage, branch stemwood, and stembark biomass in total biomass vary with tree age. A larger portion of foliage and branch biomass is produced in young stands in comparison to other biomass components, while in mid-age or old stands, foliage and branch biomass account for a decreasing percentage of aboveground biomass. It was demonstrated in this study that as stand age increased, the proportion of foliage or branch biomass in relation to aboveground biomass decreased while proportion of stemwood biomass increased and that of stembark biomass was stable regardless of site quality for both paper birch and trembling aspen (Wang et al. 1995, 1996). As a result, large estimation errors may be produced if biomass equations developed in young stands are used to estimate biomass in old stands, and vice versa, whether or not these are in the same area. In addition, the graphical form of a biomass equation is mostly determined by medium and large sample trees, and small sample trees contribute little to the development of the biomass equations in old stands, especially when a nonlinear form of allometric models is used. If such
equations are applied to young stands, large biomass estimation errors may be produced; the larger the discrepancy of dbh or tree age, the greater the probable estimation errors. Baskerville (1983) reported that stand age accounted for much of the between-stand variation in foliage biomass regression equations for balsam fir. Geron and Ruark (1988) also reported that in addition to relative stand density and site quality, stand age was one of the sources for the variation of coefficients of biomass equations, and the coefficients changed when the biomass equations were fitted from one stand to another. Effects of Site Quality on Biomass Estimation Errors Tree biomass production and allocation are determined by resources available for plant utilization, including light, carbon dioxide, nutrients, and water. Site quality, based on soil nutrient and water availability, influences the patterns of tree biomass production and allocation (Keyes and Grier 1981, Gower et al. 1992). On dry or poor sites, more photosynthate is allocated to the growth and turnover of tree root systems (Grier et al. 1981, Gower et al. 1992), while aboveground biomass production, particularly foliage, is limited. Feller (1992) reported that the biomass equations derived from good sites in Douglas-fir plantations were significantly different from those from poor sites. It was found that urea fertilization changed greatly the coefficients of biomass equations of Douglas-fir in comparison to those derived from unfertilized stands (Barclay et al. 1986). Binkley (1983) reported that the proportion of stem in total Douglas-fir biomass was much higher on a fertile site than on an infertile site. For this reason, site-specific biomass regression equations may be necessary, especially for extreme site conditions such as drought and severe nutrient deficiency. Differences in methods employed to derive biomass equations may contribute to the between-equation variability in biomass estimates (Table 3). Factors such as the number of sample trees, the method of selection of sample trees, and procedures for quantifying biomass of sampled trees contribute to the problem. Potential Implications of Biomass Estimation There is considerable interest now in estimating the biomass of forests for both practical forestry issues and scientific purposes. Forest biomass estimation provides databases for use in assessing carbon fluxes in forest ecosystems (Kurz and Apps 1999), sustainable forest management (Seely et al. 1999) and in simulating forest productivity and nutrient cycling (Kimmins et al. 1999). Thus, accurate forest biomass estimation becomes very important in today’s forest management, especially when we are scaling up our predictions. As long as we are aware of the errors associated with biomass estimation, we can develop methods to minimize the errors. Further efforts should be made in predicting tree and forest biomass with inventory data readily available to address more complicated issues such as sustainable forest management, nutrient cycling, and climatic change.
Conclusions •
The nonlinear form of the allometric model was more suitable for the development of stemwood and stembark biomass equations, while the linear allometric form was well fitted to the data of foliage and live branch biomass of the sample trees, especially for paper birch.
•
The use of the published equations could produce large estimation errors, which, when expressed as percents of mean observed values, varied from 49.9% to 140.2% and from 155.0% to 238.7% for foliage and live branches, respectively, of paper birch. The errors ranged from 71.8% to 81.3% and from 55.3% to 164.5% for foliage and live branch, respectively, of trembling aspen.
•
There were large differences both in graphical form and biomass estimates between the local equations and the published equations, particularly for foliage, live branches, and stembark.
•
Published regression biomass equations should be checked for their applicability before they are used to estimate the biomass of particular stands.
Literature Cited BARCLAY, H.J., P.C. PANG, AND D.F.W. POLLARD. 1986. Aboveground biomass distribution within trees and stands in thinned and fertilized Douglas-fir. Can. J. For. Res. 16:438–442. BASKERVILLE, G.L. 1983. Balsam fir foliage regressions are age dependent. Can. J. For. Res.13:1248–1251. BINKLEY, D. 1983. Ecosystem production in Douglas-fir plantations: interaction of red alder and site fertility. For. Ecol. Manage. 5:215–227. BROWN, J.K. 1978. Weight and density of Rocky Mountain conifers. USDA For. Serv. Res. Pap. INT-197. 56 p. C ARTER , R.E., I.M. MILLER, AND K. K LINKA. 1986. Relationships between growth and stand density in immature Douglas-fir. For. Chron.62: 440–445. FELLER, M.C. 1992. Generalized versus site-specific biomass regression equations for Pseudotsuga menziesii var. menziesii and Thuja plicata in Coastal British Columbia. Bioresour Technol. 39:9–16. FREEDMAN, B., P.N. DUINKER, H. BARCLAY, R. MORASH, AND U. PRAGER. 1982. Forest biomass and nutrient studies in central Nova Scotia. Inf. Rep. No. M-X-134. 126 p. GERON, C.D., AND G.A. RUARK. 1988. Comparison of constant and variable allometric ratios for predicting foliar biomass of various tree genera. Can. J. For. Res.18:1298–1304. GOSZ, J.R. 1980. Biomass distribution and production budget for a nonaggrading forest ecosystem. Ecology 61(3):507–514. GOWER, S.T., K.A. VOGT, AND C.C. GRIER. 1992. Carbon dynamics of Rocky Mountain Douglas-fir: Influence of water and nutrient availability. Ecol. Monogr. 62(1):43–65. GRIER, C.C., K.A. VOGT, M.R. KEYES, AND R.L. EDMONDS. 1981. Biomass distribution and above-and below-ground production in young and mature Abies amabilis zone ecosystems of the Washington Cascades. Can. J. For. Res.11:155–167. HELGERSON, O.T., K. CROMARK, S. STAFFORD, R.E. MILLER, AND R. SLAGLE. 1988. Equations for estimating aboveground components of young Douglas-fir and red cedar in a coastal Oregon plantation. Can. J. For. Res. 18:1082–1085. J OKELA, E.J., C.A. SHANNON , AND E.H. P APER . 1981. Biomass and nutrient equations for mature Betula papyrifera Marsh. Can. J. For. Res. 11:298–304. KEANE, M.G., AND G.F. WEETMAN. 1987. Leaf area sapwood cross-sectional area relationships in repressed stands of lodgepole pine. Can. J. For. Res. 17:205–209. KER , M.F. 1980. Tree biomass equations for ten major species in Cumberland county, Nova Scotia. Inf. Rep. Maritime For. Res. Centre. No. M-X-108. iii + 26 p. NJAF 19(3) 2002
135
KEYES, M.R., AND C.C. GRIER. 1981. Above-and below-ground net production in 40-yr-old Douglas-fir stands on low and high productivity sites. Can. J. For. Res. 11:599–605. KIMMINS, J.P., D. MAILLY, AND B. SEELY. 1999, Modelling forest ecosystem net primary production: The hybrid simulation approach used in FORECAST. Ecol. Model. 122:195–224. KOERPER, G.J., AND C.J. RICHARDSON. 1980. Biomass and net annual primary production regressions for Populus grandidentata on three sites in northern lower Michigan. Can. J. For. Res. 10:92–101. KURZ, W.A., AND M.J. APPS. 1999. A 70-year retrospective analysis of carbon fluxes in the Canadian forest sector. Ecol. Applic. 9:526–547. MEIDINGER, D., AND J. POJAR. 1991. Ecosystems of British Columbia. Ministry of For., Victoria, BC, Canada. PASTOR, J., AND J.G. BOCKHEIM. 1981. Biomass and production of an aspenmixed hardwood-spodosol ecosystem in north Wisconsin. Can. J. For. Res. 11:132–138. SATOO, T., AND H.A.I. MADGWICK. 1982. Forest biomass. Forest Sciences, Martinus Nijhoff/Dr W. Junk Publishers, Amsterdam, The Netherlands. P. 152.
136
NJAF 19(3) 2002
SCHMITT, M.D.C., AND D.F. GRIGAL. 1981. Generalized biomass estimation equations for Betula paperifera Marsh. Can. J. For. Res. 11:837–840. SEELY, B. J.P. KIMMINS, C. WELHAM, AND K. SCOULLAR. 1999. Defining standlevel sustainability, exploring stand-level stewardship. J. For. June 1999. TER-MIKAELIAN, M.T., AND M. KORZUKHIN. 1997. Biomass equations of sixtyfive North American tree species. For. Ecol. Manage. 97:1–24. WANG, J.R., A.L. ZHONG, P. COMEAU, M. TSZE, AND J.P. KIMMINS. 1995. Aboveground biomass and nutrient accumulation in an age sequence of aspen (Populus tremuloides) stands in the Boreal Paper and Black Spruce zone, British Columbia. For. Ecol. Manage. 78:127–138. WANG, J.R., A.L. ZHONG, S.W. SIMARD, AND J.P. KIMMINS. 1996. Aboveground biomass and nutrient accumulation in an age sequence of paper birch (Betula paperifera) in the Interior Cedar Helmlock zone, British Columbia. For. Ecol. Manage. 83:27–38. WILKINSON, L. 1998. SYSTAT: the system for Statistics. Evanston, IL:SYSTAT, Inc. 923 p.