BIRF: Keeping Software Development under Control across the Organization Paulo Marques, Paulo Gomes, Marco Vieira
Juan Prieto
Vicente Navarro, Mauro Pecchioli
CISUC, University of Coimbra Coimbra, PORTUGAL {pmarques, pgomes, mvieira}@dei.uc.pt
ISFreelance Madrid, SPAIN
[email protected]
ESOC, European Space Agency Darmstadt, GERMANY {vicente.navarro, mauro.pecchioli}@esa.int
Abstract—Many organizations have to manage an increasingly large number of software projects. In many cases, these projects are outsourced to different companies or developed across several departments. This creates a problem because it is increasingly difficult for a project manager, responsible for several projects, to have an accurate view of all activities underway, being able to act proactively before problems occur. In this paper we present an approach and corresponding implementation for effectively tracking and managing multiple projects across an organization, offering an integrated view of the state of projects being implemented. This approach allows to effectively monitoring risks, progress, budget, deliveries, and other critical aspects, allowing responding in real-time. The system was implemented for the European Space Agency, being now successfully used in a number of projects. This paper also presents an accurate view on how software development and tracking takes place in the scope of missioncritical systems. Keywords: Software Development, Project Tracking, Project Control, Risk Management, Outsourcing.
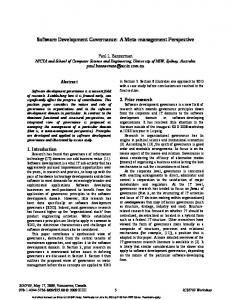
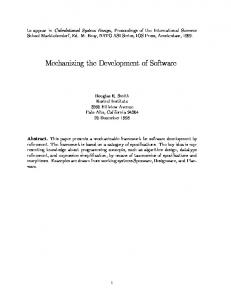
I. INTRODUCTION According to the 2009 Standish Report only 32% of all projects are delivered on time, on budget, and with the required functionality [1]. An impressive 44% have missed features, are late, over budget, or do not satisfy clients. But, most impressively, 24% never see the light of day. While some have questioned the data behind these numbers [2,3], the basic premise remains: building a software product on time, on budget, and with quality is a difficult engineering problem. Nowadays organizations are facing with an even more challenging problem. They don't run one software project; they run an increasingly number of them in parallel. Figure 1 illustrates a common situation in large software-intensive organizations. Organization A is structured in divisions which are responsible for business areas. Each division is furthermore partitioned in sections, each specialized in a certain area of business. Projects are actually carried out by project managers assigned to a particular section. Each project manager typically manages one or more projects reporting to his section head. In term, each section head reports to the division head and so forth. This type of organization is very common on large governmental agencies, large corporations with several product lines, custom development/consulting software houses. As an example, the European Space Agency
Organization A (outsources projects)
Division Head
Section Head Project Manager Project
Project Manager
Project
Organization B (sub‐contractor)
Section Head Project Manager
Project Manager
Project
Project Manager
Project Manager
Project Manager
Project
Project
Project
Organization C (sub‐contractor)
Figure 1. Project Development in a Large Organization
organizes its development in a structure not so different from the one shown in Figure 1. To complicate things further, given the current costs of development, many organizations opt to outsource their development overseas or to smaller more cost-effective organizations (Organization B and C in Figure 1). In a large organization ecosystem is now common to have projects developed in house, projects which are outsourced, and projects which have both parts developed in-house and by outsourcers. This makes it extremely difficult to keep software development under control. It also makes it difficult for the different interveners (project managers, section heads, division heads, etc.) to act proactively and in real time when challenges start to occur and not just after problems have materialized. This paper reports a joint research effort carried out at the European Space Operations Center, part of the European Space Agency, in conjunction with the University of Coimbra and ISFreelance. The objective was to develop an approach and system, named BIRF, which would allow realtime tracking and control of projects in software intensive organizations. In particular, it was an objective to enable each level of decision, from project managers to section and division heads, to have an accurate and current view of the health and challenges projects are facing at any given moment in time, allowing key players to act as proactively as needed. The system has now been validated in small scale,
tracking several different projects across the organization, and is expected to be used on a larger scale in the future. The rest of the paper is organized as follows. Section II presents a summary description of software development at the European Space Operations Center. While this description is limited to one organization, it is illustrative of some challenges that many software-intensive organizations face. Section III describes challenges and opportunities derived from that environment. Section IV describes the BIRF project and approach. Section V discusses related work. Section VI presents the conclusions. II. SOFTWARE DEVELOPMENT AT A LARGE ORGANIZATION Within ESA's Ground Systems Engineering Department, the Data Systems Infrastructure Division (OPS-GI) is in charge of the development and maintenance of all the infrastructure software utilized at European Space Operations Center (ESOC). ESOC is the entity responsible for operating all of ESA's satellites and spacecrafts being located in Darmstadt, Germany. In order to perform its task, OPS-GI relies on two key elements: 1) Software Processes and Methodologies; 2) Supporting Tools. In terms of Software Processes and Methodologies, OPSGI relies on a tailoring of the ECSS Software Engineering Standards [4] and on the ITIL Service Management Best Practices Framework [5]. Together they are used to define a solid approach to deal with requirements, design, development, maintenance and quality control, while at the same time placing existing methods and activities in a structured context that is oriented towards service provision. Such emphasis on proper design, implementation, quality control and service provisioning is of outmost importance as OPS-GI is responsible for mission critical software. As an example, OPS-GI is responsible for the SCOS product line, which is used for controlling all the spacecrafts being used on the different missions of ESA. As another example, OPSGI is also responsible for the operational simulators used for space operator training (SIMSAT infrastructure). Regarding Support Tools, ESA uses a large number of different tools on its Software Development Environments. This includes different tools for: a) requirements gathering, managing and tracking; b) software architecture and interface design; c) design and implementation engineering; d) software delivery, testing and acceptance; and e) software project management. While some of these tools are developed "in house" (e.g., for software testing and acceptance), most of the tools are actually commercial or open-source. On the managerial side information is handled at different levels of responsibility, from detailed analysis and reports for project managers, to indicators for higher management. Thus, project managers, section heads and division heads have different views of the performance of the administrative unit they are responsible for. They are also able to intervene at very different time frames. While a project manager may be able to rapidly act when issues occur in a project, it takes more time for someone higher in the hierarchy to take notice and understand the problems that are either affecting his administrative unit in global way or
are specifically affecting only part of it (e.g., just one or two projects, or one or two project managers). On the technical side, the systems and procedures involved in ESA activities are also complex and require a deep knowledge of professionals, reusing the experience from many years. The documentation containing the information is normally large and not so easy to access for a specific piece of data. There is a large amount of documents and databases, with relationships between them, which are difficult to handle. It should be noted that many missions operated by ESA stay in space more than a decade. During that time the corresponding software at the mission control system may go through a relevant number of different versions, with different functionality and limitations, as well as the hardware where it runs. Being able to actively and quickly locate vital information, such as designs, interface specifications, bug reports, and subsequent corrections, architectures or design, as well as how those evolved over time is critical for the day-to-day operations of ESA. Finally, in terms of software construction, the European Space Agency outsources most of its development to the European industry. Two types of contracts are normally used: study contracts and frame contracts. Study contracts allow ESA to prototype and understand key technology and how it may be applied to space. Generally, technology goes through different qualification states, from immature to ready to be deployed in mission-critical systems. Moving a technology up in the qualification ladder is usually done in the scope of study contracts. Frame contracts are done when a certain mature technology is going to be applied operationally in the scope of the agency. While ESA maintains tight control over all projects being developed, the implementation of projects in actually done by the space industry. Thus, the situation is quite similar to the one shown on Figure 1. ESA project managers define requirements, participate in all key architectural decisions, and are responsible for the acceptance of software artifacts, although the artifacts themselves are produced off-site. Industry has to follow the ECSS Software Engineering Standards, delivering artifacts such as: Software Requirement Documents (SRD), Software Design Documents (SDD), Interface Control Documents (ICD), Software Verification and Validation Plans (SVVP), among other. These are thoroughly reviewed. Redesign and redeliveries may be required before approval. ESA project managers are kept tightly in the entire development loop. Industry has to submit detailed monthly progress reports and monthly technical progress meetings take place. Also, the projects have standard milestones at critical points, including a SRRs (Software Requirements Reviews), PDRs (Preliminary Design Reviews), CDR (Critical Design Reviews), AR (Acceptance Reviews), among other, as mandated by the ECSS standard [4]. While this approach to software development is not the most agile, it has served and continues to serve ESA well. Development of multi-million euro mission-critical systems, which are deployed, have to operate and be maintained, in many cases, for more than a decade, requires extreme care, focus, and concern with quality.
III. CHALLENGES AND OPORTUNITIES While ESA is extremely successful in its software development activities, it does not mean there are no challenges. In particular, project management can be a challenge. Consider that: • Software development is generally done off-site by contracted companies. This creates communication difficulties and makes having an accurate view of the state of a project harder. • Each project manager is in charge of several different projects at the same time, where each project is continuously generating a large volume of information (monthly progress reports, meeting minutes, architectural and design specifications, test specifications and reports). Moreover, each one of artifacts being generated may have different iterations, revisions and issue numbers. • Due to this overflow of information, finding the critical information needed at any given moment, really understanding the state of a project, is challenging. • Higher levels of management have difficulty in having an accurate up-to-date view of the activities going on and if intervention is needed. In general, because of the delays in the information chain, actions are generally taken to correct problems that do occur and not to proactively manage and mitigate problems that can occur. Nonetheless, having a large volume of information continuously being produced about projects also creates a huge opportunity. The execution of the software processes and methodologies, supported by their associated tools, generates a large amount of data containing very valuable information. As an example, there is always updated information on the current number of requirements, number of problems, actions taken, technical progress being made, project costs, open and closed risks, among other key data. This information, properly filtered and consolidated, represents a key source of knowledge for managers and developers. It can be used to present an accurate and up-todate view of the current state of projects across an organization. It can also be used to create views appropriate to different management levels. For instance, while project managers may be concerned with key areas like budget, risks, and progress of their specific projects, section heads are much more concerned with the overall view of their section. They only want to view information from projects when they need to diagnose why a particular keyperformance indicator is below a certain threshold. Although all existing information represents an important opportunity for organizations, the extraction and processing of data from tools, in order to obtain indicators and relationships between concepts, is hindered by several factors: • Data distribution: information is managed under different domains of responsibility and tools.
• • •
Data heterogeneity: there is a lack of a common structure in the information preventing processing automation. Collection mechanisms: in the context of ESA, there are no tools or procedures to extract the information from the different repositories. Data consolidation and visualization: there are no tools for data analysis, filtering or presentation.
By addressing these key issues, it becomes possible to implement a system that allows for much more up-to-date and efficient project control in an organization. This applies not just to an organization as ESA but to any softwareintensive organization that runs different software projects in parallel, either outsourced or not. IV. THE BIRF PROJECT A. Introduction The BIRF project started in 2007 at the European Space Operations Center. It aimed on the definition of a platform for collection, integration, analysis, and presentation of project management and software development information that supported operations. The objective was to support three different types of users: • Managers: supporting project supervision, rapid decision making, planning of resources and costs for future activities and the definition of strategies. According to the level at which managers operate, different views of the activities should be provided. • Software Engineers: supporting code quality screening, automatic identification of test cases for regression testing and system-level knowledge searches over existing documentation. • Spacecraft Operations Engineers: supporting fast operational-level searches over documentation. Strategically, the organization needed a tool which: • Facilitated a proactive management strategy: by fostering early detection and correction of technical and managerial problems. • Supported technical activities: by providing mechanisms for technical activities like the identification of regression test scenarios or faulty subsystems. • Improved access to information repositories: by supporting developers and users to access technical information, ensuring that the knowledge is kept within the organization over long periods of time. • Allowed for rapid and accurate decision making: by helping decision makers to trade off cost, schedule, and technical quality against each other to best meet project and organizational targets. • Track specific targets: by giving a detailed view of the status of software processes and products. • Communicate effectively: by making available objective information across projects, reducing the ambiguity that often surrounds software projects.
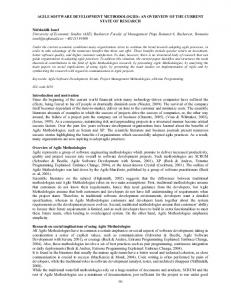
The major point was to move away from the existence of distributed and scattered ad-hoc information, to a system where information was consolidated, readily available, registered over long periods of time, and could be properly and easily visualized. B. Architecture BIRF collects information periodically from external operational systems and tools injecting it into a central repository. Additionally, it provides web-based functionality for reporting, showing Key Performance Indicators (KPI) in dashboards, searching and correlating information, and allowing drill-down on information over time. The next figure illustrates a high level view of BIRF. Reporting and Dashboarding
Data Import Layer
Operational Systems and Data Repositories
BIRF
c) A business layer for supporting dashboard operations, analytical operations over the data warehouse (OLAP), and information retrieval; d) A user-friendly web interface.
Web Interface User Interface Layer
OLAP
Information Retrieval
Dashboards
Business Layer
Data Warehouse
Knowledge Base Data Layer
ETL Tools for Data Warehousing
ETL Tools for Knowledge Management
Figure 2 – A high-level view of BIRF.
To develop the system we need to abstract the heterogeneity of the different tools where data was available (e.g., requirements gathering tools, architecture modeling tools, CVS code repository, test reports, etc.) from BIRF itself. Whenever possible, information was translated into XML, using a defined schema, and then imported. In some cases, it was not viable (or desirable) to do so. For instance, BIRF has access to source code repositories as well as PDF and Word documents containing software specifications. That information is treated, indexed and retrieved directly. In terms of architecture (Figure 3), BIRF was implemented using a layered approach. In terms of layers, the most important things that needed to be in place were: a) Adaptors which allowed information to be retrieved and processed into an intermediate format independently of the source and tools being used in the operational systems; b) An Extraction, Transformation and Loading (ETL) layer which allowed data to be imported into the BIRF repositories; b) A central repository composed of a Data Warehouse and a Knowledge Base. The data warehouse is used to store aggregated measures over time (e.g. number of requirements in a project over time, open risks, budget, etc.), allowing analytical queries to be performed and detailed project analysis. The Knowledge Base stores semi-structured information (e.g., documents) allowing users to find relevant information about the project (e.g., search for particular terms in a bug report repository, correlating that information to the patch that was created for correcting the bug; finding all places where a particular term is mentioned in the design documents of a product; etc.);
ETL Layer
XML Adaptor
DOC Adaptor
XLS Adaptor
(…) Data Import Layer
Operational Systems and Data Repositories Figure 3. Architecture of BIRF.
As it can be seen, the architecture of BIRF is fairly generic. As important as the architecture is what kind of operations and what kind of key performance indicators regarding software projects are relevant to the users of the system. Due to lack of space, in this paper, we will concentrate on the dashboard and OLAP features of BIRF. C. Deriving Measures For identifying what was important to measure and display, a hierarchal step-by-step approach was taken. The approach is readily applicable to any organization striving to implement a system as BIRF. The approach, based on SEI's Goal-Driven Software Measurement [6], consists in: 1) Identify the top-level goals of the organization while/for doing software development; 2) Decompose those goals into actionable/measurable goals. In particular, the following questions are asked: a) What are the contributions of this sub-goal to the overall
organization goal? b) What questions can be asked to assess if the sub-goal is being achieved? 3) Indentify the entities involved in achieving each one of the sub-goals. 4) Identify levels of aggregation for the information to be collected. 5) Define measures that can be taken to verify if each subgoal is being achieved. As a small example, one of the top level goals of OPS-GI is to "improve customer satisfaction of the users of OPS-GI products". This goal can be partitioned into sub-goals like: • Improve the quality of the products (software and documentation); • Improve monitoring and control of project schedule and plans; • Improve monitoring and control of project costs and resources; • Improve performance of change management; • Improve customer support and communication; On the second step of the process, each one of these subgoals is summarized. For example, for the first sub-goal, a table as shown next can be derived. Table 1. Example of a Sub-Goal
Sub-Goal: Improve the quality of the products (software and documentation) Contribution to the main goal: It will contribute to reduce the amount and criticality of problems, and a better achievement of user needs Questions to be asked: - Do our systems follow the defined quality standard? - Are the existing systems stable or changing? - Do the systems meet the user needs? - Are testing and inspection activities thorough enough? The third step of the approach is to identify all entities involved in achieving each one of the sub-goals. Entities are artifacts or people that are related to the sub-goal. Examples include "Requirements Specification", "Design Specification", "Test Specification", etc. In the case of people, we can have, for instance: "Project Manager", "User", "Administrator", etc. In the forth step the levels at which data should be aggregated are identified. Examples include "Project", "Section", "Division", among others. The final step consists in defining measures that can be taken from the identified entities and which can assess how well the goals are being achieved. As an example, for this sub-goal, some measures (over time) include: number of change requirements; number of TBD (To-Be-Defined) in the specifications; number of bug reports; number of failed test cases; and so on. Overall, in the BIRF system, we identified about 50 different basic indicators that can be tracked throughout a project. These indicators are then aggregated to provide an easy-to-use snapshot of the current status of a project.
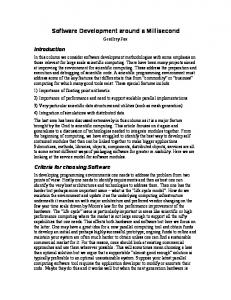
D. Key Monthly Indicators Although the defined indicators provide valuable information, we found that for keeping projects under control and offering key decision makers an instant snapshot on the status of projects, it was not necessary a lot of information. In fact, the problem faced by the organization was not lack of information – it was management of information. The most important data needed was already being provided in the monthly progress reports that contractors are obliged to provide. The main issue was that each contractor used its own format for the report, providing different information. Also, the information provided was not consistent from month-to-month. Finally, since the reports are just semistructured data (PDF/Word documents), it was hard to process them automatically. After the identification of goals, sub-goals, and measures, as defined on the previous section, a key advance was to standardize how monthly reports are structured. Thus, instead of submitting normal text documents, contractors were required to submit Excel spreadsheets that could be easily and systematically imported into BIRF. These spreadsheets require them to report, consistently on: • The Activities that took place during the last month (one entry per activity). • Issues faced by the development team during the last month (one entry per issue). • Actions during last month, dates and status (open, closed, etc.) • Current Risks (one entry per risk), their status, probability, severity, impact and last update date. • Milestones, including the dates on which each milestone was achieved. • Deliverables of the project, including current status and associated milestones. • Customer Furnished Items (CFIs). These are items (software, hardware, documentation) that ESA has to supply for a project by certain dates. The contractor has to report which CFIs were delivered by which dates. • Meetings, meeting type, when took place, location and status. • Technical Progress according to the plan of activities, showing percentage completed. • Staff currently allocated to the project and to what percentage. • Finance and Contract, including any ChangeRequest-Notices, budget, issue date, and type. • Payment Plan, including which payments took place, the amounts, dates and references. • Fixed Unit Activities, which corresponds to work performed in the project which is billed based on an hourly rate. It may seem a large overhead to fill in all this information. But, in fact, each one of these reports generally takes less than half-an-hour to fill. This format for progress reports represents a huge improvement when compared with the previous document-based approach. Figure 4 shows a
screenshot of one of the spreadsheet pages contractors have to fill in. As it can be seen, regarding milestones, the project manager of the contractor only has to update the status and date of each planned milestone, and just if any change occurred during the past month.
development process. The next figure shows how the dashboards are organized in terms of hierarchy and what key areas are measured. Division
Section
Section
(…)
Project
Project
(…)
Costs and Resources
Figure 4. Part of the Progress Report supplied by contractors on a monthly basis.
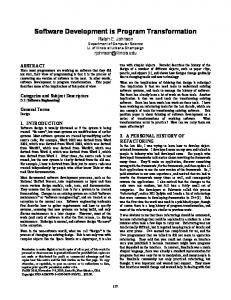
E. Dashboards In terms of end-user, BIRF offers an easy to use web interface. Whenever a user logs into the system he immediately sees a dashboard with a set of dials which allows him to see the "health" of his unit – starting from divisions down to projects. The next image shows the general aspect of those dials.
Cost Tracking
Effort Tracking
Behavioral Stability
Requirements Stability
Test Correctness
Quality Compliance
Schedule and Plans
Milestone Progress
Technical Progress
Software Process
Change Management
Project Management
Project Quality
Figure 6. Hierarchy of dashboards available for drill-down.
F. Online Analytical Processing (OLAP) Interface An important feature of BIRF is that raw data and all measures are stored over time. Thus, a user can always performed detailed investigations over information and time to assess what is really happening in the organization. Figure 7 shows a drill down over the actions on a project, across all sections, per responsible person. (The numbers, people and project shown are synthetic due to the confidential nature of the information.)
Figure 5. A simple dashboard showing the status of a division.
The user can drill down or up, investigating quickly the reasons why a certain status is show. For instance, the division head can easily find out which sections are having problems, in what areas those problems are occurring, and even what projects are problematic and why. At the project level a user can look at a set of dashboards for costs and resources, project quality, schedule, plans, and
Figure 7. OLAP interface for seeing data on the data warehouse.
One of the key strengths of the BIRF approach is that it allows managers to quickly get a current view of the status of the organization and act proactively if needed. Users are comforted with objective information, daily, without having to look though vast amounts of data. This is crucial for organizations that manage a large number of projects simultaneously, especially if several of them are outsourced to outside contractors. V. RELATED WORK There are currently many tools available for helping in the process of software development. These range from requirements gathering and management tools (e.g. Telelogic DOORS [7]), project management tools (e.g. Project [8]), configuration management tools (e.g., ClearCase [9]), quality control tools (e.g. Logiscope [7]), among many others. There is also a multitude of integrated project management systems which combine different facets of software development, including classical project management, collaborative working, issue tracking, resource management and document management. Some well known examples include Primavera [10], dotProject [11] and Trac [12]. BIRF does not aim to be a project management tool. The main objective of BIRF is to collect data from many different sources being used across an organization and give users instant feedback, in a multilevel way, on the current status of undergoing projects. The two closest areas to BIRF are Project Portfolio Management (PPM) and Capability Maturity Model Integration (CMMi). PPM [13,14,15] aims at analyzing and collectively managing a group of projects based on numerous key metrics. The main objective is to find out the correct way of organizing a set of ongoing projects in order to fulfill a number of organizational goals. In particular, emphasis is put on looking at projects as an investment where critical decisions have to be taken regarding budget, consumption of resources, return of investment, and alike. While the work described in this paper also analyzes projects in terms of key measurements, the objective is much more pragmatic. It is to, on a daily-to-daily basis, to allow for lean, efficient and proactive management of projects, with low overhead. Nevertheless, BIRF can also be used for implementing PPM. CMMi [16] is an approach developed by the SEI for software and organizational process improvement. It is organized in 5 levels. Its aim is providing organizations with a framework on how to progress from having ad-hoc processes (level 1) to actually having them managed (level 2), defined (level 3), qualitatively management (level 4) and continuously optimizing (level 5). The interesting aspect of CMMi, in this context, is that levels 4 and 5 actually require an organization to look at its project portfolio across the organization, objectively measuring key indicators. These are used for doing quantitative project management, perform organizational process performance improvement, and do casual analysis and resolution of problems. Given the architecture of BIRF, it could be easily used as a tool to drive the implementation of the higher levels of CMMi.
VI. CONCLUSION In this paper we presented an approach for allowing effectively managing multiple projects across an organization, offering an integrated view on the software development underway. This approach allows to efficiently monitoring risks, progress, budget, deliveries, and other critical aspects affecting software development, allowing acting in real-time. Information can be viewed in dashboards which are generated according to level of decision the user has access to. The system was implemented for ESA and is being successfully used at a small scale on a number of projects. BIRF is expected to be used on a larger scale in the future. We believe that the BIRF approach is applicable to any software-intensive organization that needs to offer its managers up-to-date information on projects in progress while at the same time requiring a low overhead to do so. Also, the software and its specifications are freely available to any European organizations that want to use it or enhance it. ACKNOWLEDGMENTS This work was done through a contract with the ESA (Ref. 19874/06/D/IM) and also partially supported by the FCT through CISUC (R&D Unit 326/97). REFERENCES [1] [2] [3] [4] [5] [6] [7] [8] [9] [10] [11] [12] [13] [14] [15] [16]
—, "The 2009 Chaos Report", Standish Group International, 2009. Summary available online at: http://www.standishgroup.com/newsroom/chaos_2009.php. R. Glass, "The Standish report: does it really describe a software crisis?" in Communications of the ACM, Vol. 49(8), ACM Press, August 2006. R. Glass, "IT Failure Rates–70 Percent or 10-15%?" in IEEE Software, Vol. 22(3), IEEE Press, May/June 2005. —, "ECSS Software Engineering Standards", European Cooperation for Space Standardization. Available online at: http://www.ecss.nl/ —, "IT Service Management Best Practices Framework", APM Group. Available online at: http://www.itil-officialsite.com/ R. Park, W. Goethert and W. Florac, "Goal-Driven Software Measurement – A Guidebook", Software Engineering Insitute, Ref. CMU/SEI-96-HB-002, 1996. —, "Telelogic Product Line", IBM. Available online at: http://www.telelogic.com/products/ —, "Microsoft Project", Microsoft. Available online at: www.microsoft.com/Project/ —, "IBM Rational ClearCase", IBM. Available online at: http://www-01.ibm.com/software/awdtools/clearcase/ —, "Oracle Primavera", Oracle. Available online at: http://www.primavera.com/ —, "dotProject Project Management", —. Available online at: http://www.dotproject.net —, "Trac Project Management", Edgewall Software. Available online at: http://trac.edgewall.org/ A. Sanwal, "Optimizing Corporate Portfolio Management: Aligning Investment Proposals with Organizational Strategy", ISBN 9780470126882, Wiley, 2007. R. Cooper, S. Edgett and E. Kleinschmidt, "Portfolio Management for New Products", ISBN 0201328143, Addison-Wesley, 1998. S. Rajegopal, P. McGuin and J. Waller, "Project Portfolio Management: Leading the Corporate Vision", ISBN 9780230507166, Palgrave Macmillan, 2007. —, "Software Engineering Institute CMMI", Software Engineering Institute. Available online at: http://www.sei.cmu.edu/cmmi/
All references were checked and accessed on June 9th, 2009.