information on physical phenomena from measures generally disturbed. Its most well know problem is the blind sources separation which is a specific method ...
International Journal of Computer Applications (0975 – 8887) Volume 130 – No.4, November 2015
Blind Audio Source Separation: State-of-Art Abouzid Houda
Chakkor Otman
RSAID Laboratory,University Abdelmalek Esaadi Tetouan , Morocco
RSAID Laboratory,University Abdelmalek Esaadi Tetouan , Morocco
ABSTRACT The word is surrounded by sounds what makes it difficult when it becomes impossible to obtain a desired speech because of the noisy environment. Thus, digital signal processing is a discipline that interest to extract useful information on physical phenomena from measures generally disturbed. Its most well know problem is the blind sources separation which is a specific method that in which several signals have been mixed and the purpose is to recover the original component signals from the mixed signals without any knowledge about the sources.
researchers in this field are essentially based on the assumption of the mutual independence of source signals, ie that the probability density of the source signals is equal to the product of their marginal probabilities densities. In this case the problem is also known by the name of the Independent Component Analysis ICA) [2].
This work, provides some of many existing algorithms solving the problem of blind source separation the most known in literature and at the end of this article there are some examples applied to real-world audio separation tasks using Matlab.
General Terms Algorithms, formulations and blind signal separation.
Keywords Blind source separation (BSS); convolutive mixture; instant linear mixture; independent component analysis; principle component analysis.
1. INTRODUCTION Source separation is a very active research topic because of its theoretical interest and its many practical applications. Its principle is to retrieve signals when no prior information of the sources or channel mixing system is available, so then the task is called Blind Source Separation (BSS). Source separation occurs in various applications such as locating, tracking radar targets and sonar, noise removal (cocktail party, deleting the vuvuzela, karaoke), detection and separation in multiple access communication systems, separating instruments in polyphonic music, remixing, transformations, etc [1]. The solutions proposed for this BSS differ according to the nature of the sources, the type of mixture (instantaneous or convolutive) and the case of mixture (over-determined, determined or undetermined). This problem has been intensively studied in the literature and many effective solutions have already been proposed.
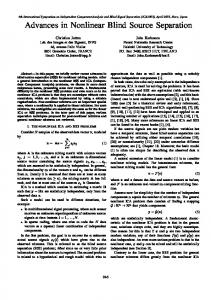
2. PROBLEM REFORMULATION Let's start by illustrating the problem of source separation by the following simple example: Robert is an old men he gives an order to Romeo while being listening to the radio. The voice of Robert arrives at the robot mixed with the signal from the radio and that can be recorded using the microphones or Romeo (acoustic sensor). Let's look at the figure (1); the two signals are the two sources that sounds are mixed before being received by each sensor. The subject interesting here is the blind audio source separation; therefore, the goal is to restore the signals transmitted using only the received signals. To do so,
Figure 1: Example of mixture (ref: https://tel.archivesouvertes.fr/pastel-00758370/document p: 20)
3. TYPE OF MIXTURES 3.1 Instant Linear Mixture In 1985, Hérault, Jutten and Ans published the first source separation algorithm. The algorithms of Hérault, al. and Cardoso and many others use the higher order of statistics (HOS) for the constraint of the independence of sources [3]. We consider m as unknown channels of signal with 1 ≤ i ≤ m and n Mixture of sensor signals 1 ≤ j ≤ n. The following figure illustrates this model of mixture: v (k) s(k)
x(k)
y(k) B(k)
A m
n
n
m
Mixing system
Separating system
Figure 2: Example of BSS for instant mixture Definition 1: it is said that a mixture is linear when the instantaneous source signals arrive simultaneously on all the sensors but with different intensities. m
x j (k )
a s (k ) v (k ) ji i
j
(1.1)
i 1
Where a ji the coefficients of the linear time-invariant mixing system are represented by the (n × m) matrix A and v j ( k ) is additive noise at the jth sensor.
1
International Journal of Computer Applications (0975 – 8887) Volume 130 – No.4, November 2015 The goal of BSS for instantaneous mixtures is to adjust the coefficients of an m × n separation or demixing matrix B such that:
easy to use because no parameters are required [7].The structure of the algorithm is illustrated in figure 3as below:
n
yi ( k )
b (k ) x (k ) ij
(1.2)
j
j 1
Where the coefficients (k) represent the impulse response of the multichannel separation system filter [4]. a)
The algorithm of JADE of J.-F. Cardoso
The JADE method collects second and fourth order statistics from segments of sound signals to form a set of matrices for joint orthogonal diagonalization, which provide an estimation of de-mixing matrix and independent sources. This algorithm is based on the joint diagonalization of a set of matrices. JADE algorithm starts with a bleaching step where the whitened observations are diagonal spectral matrix. This step is based on the use of the two order statistics. It makes independent observations in that order. Then a second step called rotation will be to make independent observations to order four by a criterion based on comulants of order four. The strongest point of JADE for applications of ICA is that it works without the using of parameter tuning. The weakest point of the current implementation is that the number of sources (but not of sensors) is limited in practice (by the available memory) to something like 40 or 50 depending on your computer [5, 6]. b)
The algorithm AMUSE of L. Tong and al
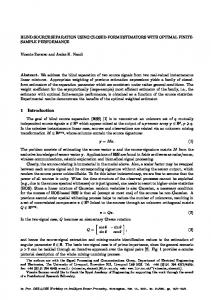
That algorithm belongs to the group of second-order-statistics spatio-temporal decorrelation (SOS-STD) BSS algorithms. It can be considered as two consecutive PCAs: First, PCA is applied to input data; secondly, PCA (SVD) is applied to the time-delayed covariance matrix of the output of previous step. The AMUSE algorithm is applied on the matrix
Rx
1)
Calculate the covariance matrix Rx X . X
2)
Find the singular values of Rx to determine the
T
.
three matrices: U as a unit matrix, V is the diagonal matrix for transformation and is the required
In the same way (colored sources of different spectra),based on second-order statistics, Belouchrani developed a new method of source separation instantly mixed and noisy , he uses the correlation property of the source signals which is performed by the matrix intercovariance several delays. SOBI algorithm utilizes the joint diagonalization procedure unlike AMUSE and FOBI which use EVD / SVD techniques. It operates on time delayed covariance matrices. SOBI utilizes the pre-whitening transformation similar to that described in case of AMUSE. This is followed by estimation of set of covariance matrices for a preselected set of time lags (
p1 , p2 ,..., pL ) mathematically, this means that for all time lags, the source correlation matrices are diagonal: T
(1.3)
Where represents the correlation matrix of the source signals. Considering that this equation holds for all values of, the mixing matrix A is the one that jointly diagonalizes all the correlation matrices [8]. d)
The algorithm of D.-T. Pham and J.-F Cardoso
Determine the covariance of X b and decompose it
In this work the authors developed a simple and efficient algorithm for separating non-stationary source signals with variable amplitude; for example for the separation of speech signals. The algorithm optimizes mathematically, "on-line" or "off-line", two cost functions using an approach based on maximum likelihood (vraisamblance) and as we know, this method, based on an observed sample, calculates the best values of a parameter of a probability.
to find its eigenvalues and the corresponding eigenvectors .
3.2 Convolutive mixture
matrix: Rx V ..U . Eliminate the Gaussian noise variance as the mean of the singular matrix with the equation
mean( .V . X ) : X b X . 2
5) 6)
The algorithm SOBI of A. Belouchrani
T
The method
4)
c)
Rx ( ) E{x(t ) x(t ) } = ARs ( ) A
following the steps below:
3)
Figure3:AMUSE algorithm (http://cate.fiu.edu/sites/default/files/Publications/Ve dala_JCNP_2012_0.pdf)
1.2
2
1/ 2
Obtain the transformation matrix H . .V . Finally, estimate the independent component as Y ( n) H . X . T
AMUSE is the faster algorithm that its processing speed is mainly defined by the PCA processing within it and it is very
The first known work for the convolutive mixing systems was introduced in the early 90s and it is still be considered present in the concerns of many researchers. Generally, all methods of blind sources separation for the context convolutional fall into three main classes: •Temporal approaches. • Frequency approaches.
2
International Journal of Computer Applications (0975 – 8887) Volume 130 – No.4, November 2015 • Time-frequency approaches. The methods in context convolutional like instant context exploit at least one of the following assumptions: independence, non-stationary, non gaussianity and temporal consistency (ie non-white sources) sources. Definition2: the convolutive mixture is due to time delays resulting from sound propagation over space and the multipath generated by reflections of sound of different objects, particularly in rooms and other enclosed settings. As a result, the m sources are mixed by a time-dispersive multichannel system as:
xj k
m
l
i 1
a s k l V (k ) jil
i
j
(1.4)
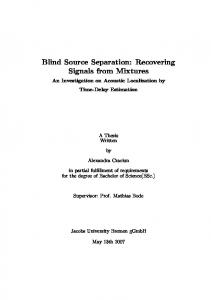
g) MSICA algorithm of T. Nishikawa and al.
Where { x j k }, 1 ≤ j ≤ n are the n sensor signals and {a jil } are the coefficients of the discrete-time linear time-invariant mixing system and the matrix A is of dimension (n × m). e)
FPICA algorithm
Suppose that we have a prewhitenid random vector x , which is a collection of linear mixtures of independent sources. 1.
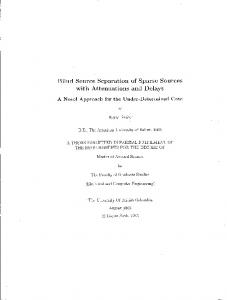
Figure 4: Input and output relations in SIMO-ICA: ref [10]
In this algorithm two ICA (INDEPENDENT COMPONENT ANALYSIS) approaches, time and frequency, are combined to build a more strong separation procedure, using only forth order statistics of the data. Its speed of convergence and its robustness to the spatial correlation (unknown to the receiver) of Gaussian noise makes it one of the most efficient algorithms at present.
To estimate one independent component : We choose a random initial vector w(0) of norm 1. Let k 1 .
2.
w(k ) E{x( w(k 1 ) x) } w(k 1) , and then divide w( k ) by its room.
3.
If
r
3
w(k ) w(k 1) is very different from 1, let r
k k 1 and go back to step 2 and output the vector w( k ) .This means that can separates one of the non-Gaussian signal. For more information about the estimation of several independent components go to reference [9]. f)
SIMO-ICA algorithm of T.Takatani and al
The authors propose in this work a new algorithm for the separation of acoustic signals in a system with one input and multiple outputs. The input is a single source and the outputs are its transmitted signals observed at multiple microphones. The algorithm is composed of (L − 1) principal component analysis and fidelity controller separation system. The experiment of this algorithm shows a good quality of the separate audio signals (see the figure 4). The separated signals of the first ICA (l = 1, · · ·, L − 1) are defined by:
y( ICAl ) (t ) [ yk( ICAl ) (t )]k1 n 0 w( ICAl ) (n) x(t n) D 1
w( ICAl ) ( z ) x(t )
(1.5)
Each element of the separation matrix is represented as an FIR
filter and w( n) wij ( n)
is the separation filter matrix, ij
w( z ) is the z-transform of w( n) and D is the filter length of w( n) [10].
Figure 5: MSICA algorithm using FDICA and TDICA: ref [11] h)
The algorithm of J. Anemüller and B. Kollmeier
Anemüller and al. have studied the separation of convolutive mixtures of speech signals. The algorithm that they proposed for this is derived from the principle of decorrelation by amplitude modulation. This algorithm collects information necessary for the separation of multiple frequencies simultaneously. From the analysis of a speech spectrogram, the authors conclude that the production of the human voice naturally follows the amplitude change based on the time variable of the spectrogram in different frequencies. That is why they call this property "amplitude modulation correlation" (Amcor)[12].
4. PCA PCA is a classical method of second order statistics in order to find a simple representation of data for its visualization and exploration. This process is also called “sphering” or “whitening” because the independence is forced onto the data through the orthogonality of axes which provide the decorrelation so thus it is based on the decomposition of the
3
International Journal of Computer Applications (0975 – 8887) Volume 130 – No.4, November 2015 covariance matrix of input data and the goal is to find wh with x wh .x .
1.
PCA can be accomplished by EVD or SVD
methods:
A Gaussian noise of 20dB was added to the signals and with no filtering at the beginning. Test 1: starting by testing the AMUSE algorithm with its defaults settings. The results obtained are as follows:
PCA with EDV: to obtain wh , we use EDV method to
1
0.5
decompose the input correlation matrix Rxx E{xx } witch
s1
T
0
-0.5 4
is symmetrical and find the eigenvectors and eigenvalues:
2
s2 0 -2
Rxx EDE
T
-4
(1.6)
4
2
Where E is an eigenvector matrix and: D diag ( d1 , d 2 ,..., d n )
s3 0 -2
-4
200
diagonal matrix of eigenvalues. 1/ 2
1
1/ 2
T
T
T
800
1000
1200
1400
1600
1800
2000
1
5
y1
T
E{wh xx wh } wh E{xx }wh T
600
Figure 6: The three signals selected
Rxx EDE ED D E E{xx } T
400
T
0 -5 5
y2
wh k SU T
(1.7)
From (1.6) we obtain this:
0 -5 5
y3
0 -5
wh ( ED1/ 2 ) 1 D1/ 2 E 1 D 1/ 2 E T
(1.8)
200
400
600
800
1000
1200
1400
1600
1800
2000
Figure 7: Mixture of sources Where D
1/ 2
1/ 2
diag (d1
1/ 2
1/ 2)
, d 2 ,..., d n
) [13].
5
y1
1. PCA with SVD :singular value decomposition is another way more robust and simple to decompose the observation X AZ into X USV where S is
0 -5 5
y2 0
T
a diagonal matrix with S diag ( 1 , 2 ,..., n ) is a singular value. Then the whitened data can be seen as: R
T
xx
E{xx}
1
XX
T
k
1
-5 5
y3
0 -5
200
400
600
800
1000
Where UU
k
I and VV I . T
T
x
kv and wh T
y2 T
T
k SU [14]
(1.9)
5. TEST AND MEASUREMENT This section presents some simulation results on MATLAB. After loading a benchmark and selecting the data file desired for example “Sergio.mat”. This benchmark contains seven sources (some of them are asymmetrically distributed). This benchmark was proposed by Sergio Cruces. It is a particular case (three signals and three sensors) with a sampling frequency of 500 Hz. The matrix of the mixture is the orthogonal matrix as seen in the following figure:
0.468883 0.759592 0.450742 H 0.822756 0.561236 0.089928 0.321281 0.328685 0.888113
has the same appearance as
differences in magnitude and also
we obtain:
1600
1800
2000
is almost similar to s3 ,
y1
T
From x w x and X USV
1400
Figure 8: Estimated sources
2 T T T T USV (USV ) US V
A simple observation shows that T
1200
s2
but there are some
y3 is similar to s1 .
In general, and from the figures its shows that there is a permutation in the sources, which means that the estimated sources do not keep the same order as the original sources, also there is a difference in the scale assumed by the difference of magnitude of each estimated signal. 5
x1
0 -5 5
x2
0 -5 5
x3
0 -5
200
400
600
800
1000
1200
1400
1600
1800
Figure 9: The estimated sources after the “lowpass filtering (butterworth)”
With det (H) =1 and cond (H) = 1.
4
2000
International Journal of Computer Applications (0975 – 8887) Volume 130 – No.4, November 2015 Test 2: SOBI algorithm Again with the same previous data and their parameters without the step of preprocessing. The algorithm is executed. The result is obtained as shown in the following figure: 2
y1
The table below shows the performance of some algorithms have been seen before: Table 1. Performance of separability of algorithms Algorithm
Performance of semi/orthogonality
AMUSE
0.1404316741
Performance Index of separability 0.0732550592
SOBI
0.1396732656
0.0727586825
FPICA
0.0383082425
0.0188579223
FCICA
0.8054618179
0.2663797978
0 -2 2
y2
0 -2 2
y3
0 -2
200
400
600
800
1000
1200
1400
1600
1800
2000
Figure 10: The sources estimated by SOBI Here,
y1 and y 2 are almost similar to their original sources
y3
like those shown in AMUSE algorithm but for the signal it is upturned from its original order. 2
y1
0 -2 2
y2
0 -2
Basically, the literature is very rich in many algorithms of blind source separation of instant mixtures where the dependency criteria are so different, and separation results are very good. However, these algorithms do not have the ability to separate the signals which are in the majority of the actual physical situations, which correspond to the convolutive case and where the mixture is under-dermined. The next step will be to develop a new algorithm which separate audio signals from its mixture and its application will be for the humanoid robot in reverberate environment.
0 -2 2
y3
6. CONCLUSION
200
400
600
800
1000
1200
1400
1600
1800
2000
7. REFERENCES [1] R.Badeau .‘’separation de source audio, projet et applications musicales (PAM) , master ATIAM‘’. TelecomPerisTech.
Figure 11: Result of SOBI after filtering Test 3: FPICA algorithm
[2] A. Ikhlef and D. Le Guennec, "A Simplified Constant Modulus Algorithm for Blind Recovery of MIMO QAM and PSK Signals : A Criterion with Convergence Analysis," EURASIP Journal on Wireless Communications and Networking, vol. 2007, Article ID 90401, 13 pages, 2007. doi :10.1155/2007/90401.
5
y1
0 -5 5
y2 0 -5 5
y3 0 -5
200
400
600
800
1000
1200
1400
1600
1800
2000
[4] S. Makino, T.-W. Lee, and H. Sawada,“Blind Speech Separation”. Springer, 2007.
Figure 12: Estimated sources by FPICA algorithm It can be noted from the Figure 12 that a good results of estimated sources have been obtained and almost they are perfectly seems like their original signals. Test 4: FCICA (Fast Constrained ICA) algorithm
0 -5 5
y2 0 -5 5
y3
0 -5
200
400
600
800
1000
1200
1400
1600
[5] J.F,Cardoso and A.Souloumiac. “Blind beamforming for non-Gaussian signals”.IEE PROCEEDINGS–F, vol.140,No.6,December 1993. [6] Y. Li, D. Powers, and J. Peach, “Comparison of blind source separation algorithms,” Adv. Neural Networks Appl., no. C, pp. 18–21, 2000.
5
y1
[3] A.Tamaber and S.Mouheb. these.“La séparation aveugle de sources non stationnaires,”. 2012–2013.
1800
2000
Figure 13: Estimated signals by FCICA Obviously, the signals are badly built; the purple line shows the shame of the original sources as they have to be instead of the blue line.
[7] K .Velada, I.Yaylati , M.Cabririzo,M.Goryawala and M.Adjaoudi.”Peak detection of somatosensory evoked potentials using an integrated principal component analysis-walsh method”, journal of clinical neurophysiolog,vol.29,number 2,April.2012. [8] V. Matic and W. Deburchgraeve, “comparison of ICA algorithms for ECG artifact removal from EEG signals. IEEE-EMBS Benelux Chapter Symposium, 2009.
5
International Journal of Computer Applications (0975 – 8887) Volume 130 – No.4, November 2015 [9] Hyvarinen, A. and Erkki ,O. (1997) . A fast fixed-point Algorithm for Independent Component Analysis. IEEE Neural computation, 9:1483-1492. [10] Takatani,T.Nishikawa,T Saruwatari,H and Shikano,K .(2003).High-fidelity blind separation of scoustic signals using simo-model-based ICA with informationgeometric learning. IWAENC 2003. [11] Nishikawa, T. Saruwatari, H and Shikano, K .Stable and low –Distortion Algorithm based on overdetermined blind separation for convolutive mixture of speech. Springer-Verlag Berlin Heiderburg.2004.
IJCATM : www.ijcaonline.org
[12] Project funded by the European Community under the “Information society Technologie”Programme 19982002.”Technical report on implementation of linear methods and validation on acoustic sources”.2003.BLISS, IST-1999 14190. [13] T. Zeman,”BSS-Preprocessing Steps for Separation Improvement”.CTU FEE.Dept of Circuit Theory, May.2000. [14] O.chakkor, Carlos Garcia Puntonet, Mohammed Essaadi. A Survey of Signal Separation Algorithms. International Journal of Computer Applications, Volume 54 - Number 8, 2012.
6