4th International Symposium on Independent Component Analysis and Blind Signal Separation (ICA2003), April 2003, Nara, Japan
BLIND SEPARATION IN LOW FREQUENCIES USING WAVELET ANALYSIS, APPLICATION TO ARTIFICIAL VISION Danielle Nuzillard*, Sorin Curila*, **, Mircea Curila*, ** Laboratoire d'Automatique et de Microélectronique*, Université de Reims Champagne-Ardenne, Campus du Moulin de la Housse B.P. 1039, 51687 REIMS Cedex 2, FRANCE, Tel: +33.(0)3.26.91.82.16, Fax : +33.(0)3.26.91.31.06 University of Oradea**, 3700 Oradea, ROMANIA, str. Armatei Romane 5 e-mail:
[email protected],
[email protected],
[email protected]
ABSTRACT We propose a method for image enhancement in colour word when a scattering environment reduces the vision. The main advantage of blind technique is that it does not require any a priori information about the scattering environment but supposes that the observed signals are linear mixtures of sources. Here, the natural logarithm of the degraded image provides an approximative additive mixture of reflectivity and transmittivity coefficients, the colour images provide three coloured mixtures (red, green, blue). They are processed by a Blind Source Separation (BSS) method in low spatial frequencies to display gray levels of pertinent features, which help one to vision enhancement. To display a cleaner vision, the set of mixtures is enriched thanks to classical signal processing technique. The chrominance information is restituted using post-processing techniques on HSV (Hue, Saturation, Value) space of degraded colour image. Experiments are made on images for which scattering environment is simulated in the laboratory. Keywords- Scattering environment, Artificial vision, Blind Source Separation, Second order blind identification, Independent component analysis, Wavelet denoising
1. INTRODUCTION The goal of computer vision is to develop techniques applied to artificial vision for which performance matches or exceeds that of human. Computer vision systems must include methods that enable applications for detecting objects through scattering environment, in bad weather conditions such as fog, rain, haze, snow, etc. The proposed topic is scientifically innovative because it associates the classical physics (radiative transfer in the scattering environment) to modern signal and image processing techniques as Blind Source Separation (BSS). The application of BSS methods for the improving the vision in fog conditions has for justification that the statistical properties of the scene are different from those of the environment between the scene and the observer. In the literature, the atmospheric propagation and the distribution of particles participating in effects such as light scattering correspond to an atmospheric model. We chosed to use a simple description that yields the properties of an actually model but only takes care of the image contrast
77
degradation by surface radiation and atmospheric radiation phenomena. The simple model is described in section 2. To enhance the vision, we propose an approach presented in sections 3. The searched sources, using BSS methods, are the depth distribution (related to the transmittivity coefficient for an homogeneous scattering environment) and the reflectivity coefficient of the scene. The separation takes place in low frequencies domain due to environment distribution. Histogram equalization and its variations are very flexible since no assuming is made about the physics of the scene. But the results of these methods suggest that they are less effective in enhancing degraded images under scattering environment than model-based methods. The performances of the proposed method show a gain of 25% compared to the histogram equalization. Image processing techniques on HSV (Hue, Saturation, Value) space, proposed in section 4, complete the enhanced process to yield a colour image. Experimental results are available in section 5. An intense research activity falls out to describe the scattering environment properties and to enhance the image quality under such conditions. We mention here those whose aims are very close to our work. National Oceanic and Atmospheric Administration (NOAA) Science Center [19] catches images from two geostationary operational environmental satellites and combines them to create a product for the detection of fog and low status clouds at night. The "Fog Image" is obtained by a subtraction of the short-wave infrared window channel (3.9 micron wavelength) temperatures from the long-wave infrared window channel (10.7 micron) temperatures. The image is a special enhancement that estimates the thickness of a low cloud layer, based on the temperature difference between the two infrared channels. S. K. Nayar studies the visual manifestations of different weather conditions. Based on his observations, he develops models and methods for recovering pertinent scene properties such as three-dimensional structure from images taken under poor weather conditions [13]. D. Jackel presents a method for rendering of the atmosphere by means of Mie-scattering. The method is
based on a concentric atmospheric model, which is divided into four submodels: for clear air, aerosol, ozone and rain [10]. E. Dumont proposes a physical model, which describes the degradation of contrast for both surfaces and light sources in daytime and nighttime atmospheric conditions [7]. J. P. Oakley introduces a method for reducing image contrast degradation in situations in which the scene geometry is known. His method involves two steps: a) an estimation problem is solved to recover the statistical model parameters; b) the estimated scatter contribution is subtracted from the pixel value and the remainder is scaled to compensate for aerosol attenuation [16]. MODTRAN [18] is computer code which describes models for predicting atmospheric radiance and transmittance. The models calculate atmospheric transmittance, atmospheric background radiance, singlescattered solar and lunar radiance, direct solar and lunar radiance and multiple-scattered solar and thermal radiance.
light due to the aerosol particles between the scene and the observer is given by: d L (λ ) = L (λ )β (λ ) e− β (λ ) x dx = L (λ ) 1−e− β (λ ) d (3) AR
∫
S
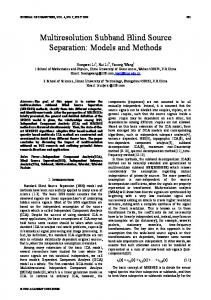
L(λ,k)=LS(λ) r0(λ,k) τ + LS(λ) (1-τ(λ,k))
τ1
surface radiation
τ1
where τ(λ,k)=exp(-β(λ) d(k)) and r0=L0/LS are respectively the transmission and the reflection coefficients. The left hand side is the radiance at the sensor element k, the first term of the right hand side corresponds to the surface radiation and the second term corresponds to the atmospheric radiation. scene sky light
camera
AR SR
( )
[
atmospheric radiation
]
d(k)
(1)
Fig. 1: Degradation model (SR-Surface radiation effect; AR- Atmospheric radiation effect)
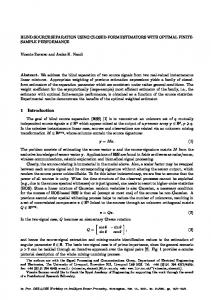
3. BSS APPLICATION TO VISION ENHANCING
Sources
Noise N1
scattered light by the earth surface
where Lv represents the radiance observed by a satellite (the used parameters are described in [18]). When the observed scene is very close to the camera, the solid angle of the observation is very weak, the term corresponding to the reflection of the sky light is very weak as well and negligible (without affecting the pertinence of the model). The resulting model includes the two terms described below. Surface radiation (SR). A light beam gets attenuated due to scattering by atmospheric particles. Mie's law [12] gives the following representation of the radiance LSR of an object observed at a distance d: LSR(λ)=L0(λ)e-β(λ) d
dx
The simplest BSS model assumes that m observed signals X=(X1, X2,…, Xm )T are linear mixtures of n unobserved source signals S=(S1, S2,…, Sn)T where m > n, with mixing matrix A and added noise sensor N.
+ ∫ k ∫0 ∫−1Pv (µ',φ ')Lv(τ , µ',φ ') dµ'dφ ' e −(t µ ) dt µ τ !!!!!!!!#!!!!!!!!" $ 2π 1
(4)
x
A general formula of the atmospheric model for radiation transmission of radiation is described in MODTRAN. It contains three terms, the surface radiation, the atmospheric radiation and the scattered light including that by the earth surface:
( )
)
where LS is the sky radiance. Degradation model. The image degradation model is depicted in figure 1. The radiance of the observed image is described for each wavelength λ and at each pixel k in the image by the equation:
2. ATMOSPHERIC MODEL
Lv = ε e B v Te e − (τ1 µ ) + ∫ ε a B v Ta e −(t µ ) dt µ $!! !#!!! " $ τ !!!#!!! "
(
S
0
(2)
where λ is the wavelength, β is the scattering coefficient and L0 is the object radiance. Atmospheric radiation (AR). The scattering of sky light is due to water droplets in the atmosphere. Total radiance at the observer after attenuation of the scattered
78
τ r0 LS
Mixing System
Σ ..
Low frequency
N2 ... Nn
Σ Σ
X X2 Xn
DWT
Estimated sources
τˆ '
c1 c2 cn
BSS
rˆ '0 Lˆ'S
wn ... w2 w1 Unknow Threshold. scheme
rˆ 0
IDWT
..
Fig. 2: Application of BSS to vision in scattering environment
A full identification of the mixing matrix A is impossible because it is always possible to exchange a fixed scalar factor αj or to permute a column of A and a row in the source vector S.
aij α j S j + Ni (5) αj The covariance matrices of the observed signals have the following form: X i =∑ j
Rx(0) = E[x(k) xT(k)] = A Rs(0) AT T
T
Rx(p) = E[x(k) x (k - p)] = A Rs(p) A , p ≠ 0
(6) (7)
The source signals have unit variance and are assumed to be uncorrelated. Under the above assumptions, the covariance matrices of the source vector equals: Rs(0) = E[s(k) sT(k)] = I
(8)
T
Consequently both Rs(0) = E[s(k) s (k)] and Rs(p) = E[s(k) sT(k - p)] are non-zero distinct diagonal matrices, and it follows that Rx(0) = A AT. 3.1. Experimented tools 3.1.1. Second Order Blind Identification (SOBI) The first step of SOBI, developed by Belouchrani et all [2], consists of whitening the observed signals X(t). The observation vectors are normalized and orthogonalized by the m x n whitening matrix W so that the covariance matrix RWX becomes the identity matrix: RWX(0)=E[WX(k)XT(k)WT]=WRX(0)WT=I
(9)
The whitening matrix equals: W = [λ1-0,5 v1, λ2-0,5 v2, … , λm-0,5 vm]
(10)
where λ1 ≥ λ2 ≥ ... ≥ λm are the m largest eigenvalues arranged in decrease order and v1, v2, … , vm are the corresponding eigenvectors of covariance matrix RX(0). The whitened covariance matrices can be rewritten as: RWX(0)=W RX(0) WT=W A AT WT =W A (W A)T=I T
T
T
∀ p ≠ 0 RWX(p) = W RX(p) W = W A RS(p) A W
(11) (12)
From eq. (11) it follows that U = WA is a n x n unitary matrix. Consequently, the determination of m x n mixture matrix A is reduced to that of a unitary n x n matrix U. Since RS(p) is diagonal, any whitened covariance matrix RWX(p) is diagonalized by the unitary transform U. This matrix jointly diagonalizes the set ΜR={RWX(p)| p =1,...,P}. The joint diagonalization consists of computing the unitary matrix U as matrix of Givens rotations. When the unitary matrix U is obtained, the mixing matrix is estimated by A = W+ · U and the unmixing matrix is then given by UT W, where "+" denotes the pseudo-inverse. Nuzillard adapted SOBI in f-SOBI [15] to determine the structure of a small molecule and the composition of a mixture of chemical substances. Algorithms were extended in 2-D to deal with astronomical images [14]. 3.1.2. FastICA algorithm FastICA, implemented by Hyvarinen and Oja [7], minimizes an objective function called "contrast function". An approximation of negentropy that can be used to construct a measure of nongaussianity is given by: LG(y)=|Ey{G(y)}-Ev{G(v)}|p
g(y)=tanh(ay); G(y)=exp(-ay2/2), g(y)=y·exp(-ay2/2). FastICA for one unit uses a computational unit, or an artificial neuron, having a weight vector w that the neuron updates by a learning rule. Thus, based on a fixed-point scheme, this finds a direction w such that the projection wTX maximizes nongaussianity. The variance of wTX must be constrained to unity such that the norm of w equals unity. In BSS context the final vector w given by algorithm separates one of the nongaussian source signals, so that wTX equals one of the source signals. To estimate several independent components one needs to run the one unit algorithm using several units with weight vectors w1,…,wn. It must decorrelate the outputs w1TX,…,wnTX after each iteration. The algorithm works in two different ways: a symmetric solution is used for which the source are computed simultaneously, or deflation one for which the sources are extracted one by one. 3.1.3. Positive matrix factorization Two algorithms for matrix factorization are retained. The first one is non-negative matrix factorization (NMF) originally established by [11]. NMF factorizes the X matrix into n x r matrix and an r x n matrix S approximately (X ≈ A S) with a constraint so that no negative element is allowed in A and S. Minimizing the cost function that measures the distance between X and AS, optimizes this algorithm. Two alternative formulations of the cost function are available: the Euclidean distance or the Kullback-Liebler divergence. The following update rule minimizing the Euclidean distance is retained for the current application. S ijt +1 = S ijt
( AT X ) ij
Aijt +1 = Aijt
where v corresponds to the Gaussian variable which has the same mean and the same variance as y. Generally p is equal to 2. G(y) is used in its derivative form g(y), the couple (G(y), g(y)) can be chosen among the following functions: G(y)=y4, g(y)=y3; G(y)=log(cosh(ay)),
79
( X S T ) ij
(15)
( At S S T ) ij
The second algorithm, non-negative sparse coding (NNSC) [9], includes a sparse coding and the constraint of nonnegative matrix factorization. It is based on the minimization of 1 (16) C (A, S ) = X − AS 2 + λ S
∑
2
ij
ij
under the constraint: ∀ ij: Aij≥0; Sij≥0 and ∀ i: ||αi||=1, where αi denotes the i-th column of A. It is also assumed that the constant λ is positive. This measure of sparness is a linear activation penalty, and the objective function is quadratic in S. The objective (eq.15) is non-increasing under the following multiplicative update rule: S ijt +1 = S ijt
(13)
(14)
( AT A S t ) ij
( AT X ) ij
(17)
( AT A S t ) ij
Because of the normalization of columns of the matrix, one uses just the projected gradient descent. Each step is composed of three parts: a) A' = At - µ(At S - X) ST;
b) any negative value in A' is set to zero; c) each column of A' is rescaled to unit norm, then set At+1=A'. 3.2. BSS in low frequencies Wavelet transform can localize information of the image in spatial frequencies domain. This property is essential for noise reduction in real images, these encompass the scene (low frequency components bound to the environment distribution) and of an additive noise in high frequency. These features are exploited to proceed to a blind separation in low frequencies and to de-noise images in high frequencies. The proposed method, as illustrated in figure 2, requires the following steps: 1. transform the image into orthogonal domains using Discrete Haar Wavelet Transform (Harr-DWT); 2. apply a BSS method on the average coefficients ci of low frequencies in order to separate the scattering environment and the scene; 3. threshold the wavelet coefficients wi of high frequencies; 4. perform the inverse Harr-DWT from the low resolution scene of obtained in 2. and thresholded coefficients obtained in 3. in order to restore the de-noised image. Each step in the forward Harr-DWT calculates a set of averages and a set of wavelet coefficients. If a data set contains n elements, there will be n/2 averages and n/2 wavelet coefficients. The averages become the input for the next step in the wavelet calculation. The Haar scaling function to calculate an average ci and wavelet function to calculate a wavelet coefficient wi from an odd and even element in the data set are given by: ci = (Xi + Xi+1) / 2, wi = (Xi - Xi+1) / 2
(18)
Using the inverse wavelet transform the original data can be perfectly reconstructed using the following equations: Xi = ci + wi, Xi+1 = ci+1 - wi+1
(19)
Noise reduction for the image affected by additive Gaussian noise is performed using either a soft or a hard thresholding. Let X(i)=V(i) + σN(i), 0 ≤ i ≤ m-1, be the signal observations, the signal of interest V(i) is corrupted by a noise with the power σ2 and N(i) is a unit-variance, zero mean, Gaussian white noise. The aim is to find an estimate Vˆ of V from the noisy observation X with a small mean-squared error. Assuming that M denotes the Discrete Wavelet Transform (DWT) matrix, the DWT of X is given by: (20) wX = M X = wV + σ wN where wV and wN are the wavelet coefficient vectors of the signal V and the noise N, respectively. From the inversely transform we have: (21) X = M T wX = M T wV +σM T wN An estimate Vˆ of V can be computed as:
80
Vˆ = M T wVˆ
(22)
where wVˆ represents the DWT of Vˆ . It was proposed in [3] [6] to derive the elements wVˆ by using either the soft threshold functions given by: sgn( w X (j,k )) ( w X(j,k ) − T ), if w X (j,k ) ≥ T (23) wvˆ ( j, k )= 0 otherwise or the hard threshold given by: w (j,k ), if w X (j, k ) ≥ T (24) wvˆ ( j, k )= X 0 otherwise where the threshold T, based on the minimax principle can be derived as T =σ 2log(m) . Wavelet coefficients below a threshold are left out and only the largest ones correspondent to features of the scene are kept. 3.3. Image processing technique to achieve more observations To get more data a pre-processing technique exploiting information of HSV space is proposed. Scattering is characterized by a strong radiance L (with in 80%) and an extremely low saturation level S(