Blind Separation of Cardiac Components and. Extraction of Input Function from H2. 15O. Dynamic Myocardial PET Using Independent. Component Analysis.
Blind Separation of Cardiac Components and Extraction of Input Function from H215O Dynamic Myocardial PET Using Independent Component Analysis Jae Sung Lee, Dong Soo Lee, Ji Young Ahn, Gi Jeong Cheon, Seok-Ki Kim, Jeong Seok Yeo, Kangjun Seo, Kwang Suk Park, June-Key Chung, and Myung Chul Lee Departments of Nuclear Medicine and Biomedical Engineering, Seoul National University College of Medicine, Seoul, Korea
The independent component analysis (ICA) method is suggested to be useful for separation of the ventricles and the myocardium and for extraction of the left ventricular input function from the dynamic H215O myocardial PET. The ICA-generated input function was validated with the sampling method, and the myocardial blood flow (MBF) calculated with this input function was compared with the microsphere results. Methods: We assumed that the elementary activities of the ventricular pools and the myocardium were spatially independent and that the mixture of them composed dynamic PET image frames. The independent components were estimated by recursively minimizing the mutual information (measure of dependence) between the components. The ICA-generated input functions were compared with invasively derived arterial blood samples. Moreover, the regional MBF calculated using the ICA-generated input functions and single-compartment model was correlated with the results obtained from the radiolabeled microspheres. Results: The ventricles and the myocardium were successfully separated in all cases within a short computation time (⬍15 s). The ICA-generated input functions displayed shapes similar to those obtained by arterial sampling except that they had a smoother tail than those obtained by sampling, which meant that ICA removed the statistical noise from the time–activity curves. The ICA-generated input function showed a longer time delay of peaks than those obtained by arterial sampling. MBFs estimated using the ICA-generated input functions ranged from 1.10 to approximately 2.52 mL/min/g at rest and from 1.69 to approximately 8.00 mL/min/g after stress and correlated well with those calculated with microspheres (y ⫽ 0.45 ⫹ 0.98x; r ⫽ 0.95, P ⬍ 0.000). Conclusion: ICA, a rapid and reliable method for extraction of the pure physiologic components, was a valid and useful method for quantification of the regional MBF using H215O PET. Key Words: PET; independent component analysis; myocardial blood flow J Nucl Med 2001; 42:938 –943
Received Oct. 12, 2000; revision accepted Jan. 17, 2001. For correspondence or reprints contact: Dong Soo Lee, MD, PhD, Department of Nuclear Medicine, Seoul National University College of Medicine, 28 Yungun-Dong, Chongno-Ku, Seoul 110-799, Korea.
938
THE JOURNAL
OF
O
n the basis of the differential equations of radiopharmaceutical kinetics, regional myocardial blood flow (rMBF) can be estimated using the time–activity curve of the blood pool and myocardial tissue measured by PET. Water labeled with 15O is an attractive tracer for the measurement of rMBF using PET because it is almost entirely extracted from the blood during its first pass across the myocardium and because it is metabolically inert. In addition, the short half-life of 15O facilitates repeated or combined measurements with other tracers (1– 4). In quantification of rMBF using H215O dynamic PET, the input time–activity curve can be obtained by sampling the blood from the artery or, alternatively, by drawing the region of interest (ROI) on the left ventricular (LV) area of the PET image. However, arterial blood sampling is a cumbersome method for both the patient and the operator because it should be performed in a rapid manner several times during the PET scanning process. In contrast, the noninvasive method of drawing the ROI can reduce the patient’s discomfort and the operator’s burden. However, it is difficult to identify the anatomic structure of the LV on a H215O PET image to draw the ROI because, with the bolus injection, the H215O is rapidly and evenly distributed over the entire cardiac region, such as the LV, the right ventricle (RV), and myocardial tissues. Therefore, it has been necessary to use an additional device to generate radioactive gas and to acquire a C15O PET image for determination of the LV area to obtain the exact LV input function (1,2). Factor analysis has been proposed to extract the LV input function and the tissue time–activity curve from the H215O PET without C15O PET scanning (5– 8). Although such factor analysis is considered an attractive tool to process dynamic image sequences, additional assumptions of a priori knowledge are needed to overcome the nonuniqueness of the solution (9,10).
NUCLEAR MEDICINE • Vol. 42 • No. 6 • June 2001
Recently, the biomedical application of blind source separation by independent component analysis (ICA) has received considerable attention because of its plausibility to biomedical signals (11–13). ICA is a statistical technique in which observed signals are linearly transformed into components that are maximally independent from each other. Using ICA, we can therefore recover independent sources given only observed data, which are unknown linear mixtures of the unobserved independent source signals. In contrast to correlation-based transformations such as principal component analysis (PCA), ICA not only decorrelates the signals but also reduces higher order statistical dependencies. Therefore, we could find a linear nonorthogonal coordinate system using ICA, although it is impossible by use of correlation-based transformations. In dynamic myocardial PET images, the image of each frame can be described as a mixture of the independent elementary activities, such as the LV and RV blood pool activities and the myocardial tissue activity, because their anatomic structures do not inherently overlap with each other in 3-dimensional space and their time courses are different from each other. The assumption of linear mixture for the application of ICA is also acceptable because the accumulation process of PET activities is linear within the range of activity that we generally use. The aim of this study was to blindly separate the cardiac components using ICA and to test whether they could be used for ROI definition to extract the input function for the quantification of rMBF. MATERIALS AND METHODS Theory Let us assume an M-dimensional random variable s(p) ⫽ [s1(p), . . . , sM(p)]T, such that the components si(p) are mutually independent. This means that the multivariate probability distribution function (PDF) of the variable s(p) can be rewritten as the product of marginal independent distributions. In a real environment, we can observe only the mixed signal x(p) ⫽ [x1(p), . . . , xN(p)]T at each sampling point p. If we assume the linear mixing situation, the relationship between the independent source and its mixture can be written as: x共p兲 ⫽ A ⫻ s共p兲,
RV blood pool, the myocardial tissue, and background, respectively, and have a dimension of 1 ⫻ P (P is the number of spatial element, such as voxel). Row vector Xi (1 ⫻ P) is the PET image of ith frame, and the time-dependent coefficient A . .,i represents the contribution of the activity of each anatomic structure to the PET image of ith frame. Equation 2 could be represented in matrix formulation as follows: X ⫽ A ⫻ S,
Eq. 3
where S (4 ⫻ P) is the matrix of the independent component map, A (N ⫻ 4) is the mixing matrix, and X (N ⫻ P) is the PET data matrix. If A is not an identity matrix, the observed data x(p) is different from the source signal s(p). Therefore, it is necessary to derive independent source signal s(p) from the data x(p). However, this is not easy to do because we do not know about the mixing matrix A. ICA makes it possible to derive an independent source signal from the observed data using the fact that source signals si(p) are mutually independent. The goal of blind source separation using ICA is to find a linear transformation W of the mixed signal x(p) to make its outputs as independent as possible, which is written as: u共p兲 ⫽ W ⫻ x共p兲 ⫽ W ⫻ A ⫻ s共p兲,
Eq. 4
where the u(p) is an estimate of the sources (14,15). A schematic diagram of this process is shown in Figure 1. The sources are recovered exactly when W is the inverse matrix of A up to a permutation and scale change (13). Among the many methods to find a linear transformation matrix W, we adopted the extended infomax ICA algorithm (13,16): a simple learning algorithm for a feed-forward neural network that blindly separates the linear mixtures of independent sources with a variety of distributions using information maximization theory (Appendix). Image Acquisition and Reconstruction H215O PET scans were performed on 7 dogs at rest and after pharmacologic stress using adenosine or dipyridamole. All scans were acquired with an ECAT EXACT 47 scanner (CTI/Siemens, Knoxville, TN), which has an intrinsic resolution of 5.2 mm full width at half maximum and images simultaneously 47 contiguous planes with thicknesses of 3.4 mm for a longitudinal field of view
Eq. 1
where A is an N ⫻ M mixing matrix—that is, source signals si(p) are mixed instantaneously by the unknown mixing matrix A. In H215O dynamic myocardial PET, the image of each frame is a mixture of the independent elementary activities and can be described by the following equations: X1 ⫽ ALV,1 ⫻ SLV ⫹ ARV,1 ⫻ SRV ⫹ ATI,1 ⫻ STI ⫹ ABG,1 ⫻ SBG X2 ⫽ ALV,2 ⫻ SLV ⫹ ARV,2 ⫻ SRV ⫹ ATI,2 ⫻ STI ⫹ ABG,2 ⫻ SBG · · · XN ⫽ ALV,N ⫻ SLV ⫹ ARV,N ⫻ SRV ⫹ ATI,N ⫻ STI ⫹ ABG,N ⫻ SBG, Eq. 2 where the row vector SLV, SRV, STI, and SBG represent the spatial distribution of elementary activities corresponding to the LV and
FIGURE 1. Schematic diagram of processor for blind source separation problem: Demixer extracts estimates of independent source signal from mixed input data by adjusting weights between its input and output nodes.
INDEPENDENT COMPONENT ANALYSIS
FOR
PET • Lee et al.
939
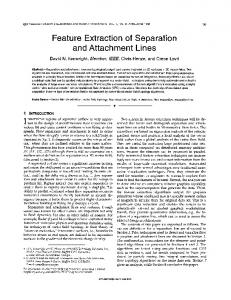
of 16.2 cm. Before H215O administration, transmission scanning was performed using 3 68Ge rod sources for attenuation correction. Dynamic emission scans (5 s ⫻ 12, 10 s ⫻ 9, 30 s ⫻ 3 ) were initiated simultaneously with the injection of approximately 555– 740 MBq H215O and continued for 4 min. Arterial blood samples were taken from the 7 dogs at 5-s intervals for the first 2 min to compare with the LV input function derived by the ICA. Transaxial images were reconstructed by means of a filtered backprojection algorithm employing a Shepp–Logan filter with cutoff frequency of 0.3 cycle/pixel as 128 ⫻ 128 ⫻ 47 matrices with a size of 2.1 ⫻ 2.1 ⫻ 3.4 mm. Microsphere Studies To compare with the rMBF using the ICA-generated input function, the MBF was measured with radiolabeled microspheres (NEN Life Science Products, Boston, MA) of 15.5-m diameter in 5 dogs. The microspheres labeled with 46Sc, 85St, or 113Sn were administered over approximately 10 –15 s into the LV simultaneously with the injection of water. After killing the dogs, the hearts were removed and cut into 1-cm-thick LV short-axis cross sections, and each cross section was further divided into 4 segments of anterior, lateral, and inferior regions and septum. The regional blood flow of each segment was calculated with the standard microsphere reference techniques (17). Processing of H215O PET Images The initial 18 frames (2 min) of PET images were used for analysis. Schematic representation of the various processing steps is given in Figure 2. The dynamic PET images were also reoriented to the short axis and resampled to have 1-cm thickness to increase the signal-to-
noise ratio. We reoriented each frame of the dynamic images using the parameters for rotation and the translation parameters determined on the static images obtained by summing the dynamic images. Then, only the cardiac regions were masked to remove the extracardiac components and to reduce the burden of calculation. The resulting masked images with a dimension of 32 ⫻ 32 ⫻ 6 ⫻ 18 (pixel ⫻ pixel ⫻ plane ⫻ frame) were reformatted to 18 ⫻ 6,144 (frame ⫻ pixel) matrices for further analysis. Before the application of ICA, PCA using singular value decomposition was performed to decorrelate the input images. The first 4 components with the largest variances were selected as input data for ICA, and the remaining noise components were discarded. A neural network with 4 input and 4 output nodes was trained to perform the ICA process. All data points were passed 25 times into the network through the learning rule using a block size of 100 for batch learning. The learning rate was fixed at 0.0005. The log-likelihood (Appendix) was computed continuously to measure the independency of the output of the network and to determine the optimal repetition time of the training. In the LV component images, the voxels with activities ⬎50% of the maximum were considered to be included in the LV, and these voxels were used as an ROI on each dynamic frame to obtain LV time–activity curves. We determined the threshold by comparing the time–activity curves obtained by ICA with those obtained by blood sampling and by the ROI on the LV region. Small changes of the threshold did not significantly alter time–activity curves because most of the LV component images have sharp boundaries. MBF Estimation MBFs were estimated using the ICA-generated LV input functions and tissue time–activity curves obtained from the ROIs on the identical regions defined in microsphere studies. We drew the ROIs on the independent component images of myocardium with the thickness of about 3 pixels and copied them onto the dynamic images to obtain tissue time–activity curves of those regions. MBF was estimated using the single-compartment model (18). Radioactivity in myocardial tissue can be described by the following equation: CT共t兲 ⫽
冉 冊
⫺Ft F , C (t) 丢 exp V a V
Eq. 5
where R denotes the convolution integral, CT (t) is the tissue time–activity curve observed in the myocardial region (counts/g), Ca(t) is the arterial blood input function (counts/mL), F/V is the rMBF per unit of tissue volume (mL/g/min), and is the tissue/ blood partition coefficient (mL/g). Because partial-volume and spillover effects contaminate the time–activity curve observed on the PET image, the tissue time– activity curve should be related to the true activities by the following relationship: CT,PET共t兲 ⫽ FMM
冋
冉 冊册
F ⫺Ft C 共t兲 丢 exp V a V
⫹ FBM ⫻ Ca共t兲, Eq. 6
FIGURE 2.
940
Flow chart of image-processing steps.
THE JOURNAL
OF
where CT,PET(t) is the observed PET tissue activity (counts/g), FMM is the recovery coefficient of tissue activity, and FBM is the fraction of blood activity observed in tissue activity. Tissue time–activity curves were fitted to Equation 6 to estimate F/V, FMM, and FBM with the fixed partition coefficient ( ⫽ 0.92).
NUCLEAR MEDICINE • Vol. 42 • No. 6 • June 2001
The correlation coefficient between the rMBFs obtained by the above 2 methods was computed. RESULTS
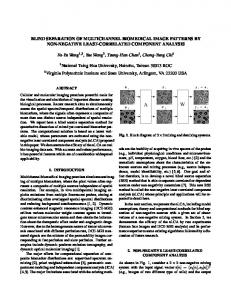
In all cases, we could obtain 3 cardiac components (RV, LV, and myocardium) using ICA as shown in Figure 3. LV was well identified in the central region of the mask. The log-likelihood increased rapidly and reached a plateau after 5–10 repetitions of training as shown in Figure 4. Even though we realized the ICA algorithm and reading process of the PET image with the low-speed computer language, Matlab (The Mathworks, Natick, MA), computation time for whole process was ⬍15 s on the workstation with 333-MHz central processing unit and 128-megabyte memory (DEC AlphaStation 600; Digital Equipment Corp., Maynard, MA). LV input functions were extracted successfully by the ICA method as well. The results were consistent in all 10 canine studies. Figure 5 shows the ICA-generated LV input function, which is compared with the input function by arterial blood sampling. Their shapes were very similar except for the smoother tail of the ICA-generated one, attributed to the removal of the statistical noise in the time–activity curve and the short time lags in the input function by arterial sampling. MBFs determined using the ICA-generated input function were in agreement with previously reported values. They ranged from 1.10 to approximately 2.52 mL/min/g at rest (mean ⫾ SD, l.80 ⫾ 0.372) and from l.69 to approximately 8.00 mL/min/g after stress (mean ⫾ SD, 4.19 ⫾ 2.10). MBFs obtained by ICA corrected well with those using microspheres as shown in Figure 6. The correlation coefficient was 0.95 (P ⬍ 0.000, n ⫽ 139), and the fitted line (y ⫽ 0.45 ⫹ 0.98x) had almost unit slope. DISCUSSION
In this study, we applied the ICA method, a new approach to linear decomposition and blind source separation, in
FIGURE 4. Plot of log-likelihood of PDF of observation during training as function of repetition time: It increased rapidly and reached a plateau after 5–10 repetitions.
extraction of physiologic factors from a dynamic sequence of PET images. For the ICA method to separate the activity of each cardiac component, its distribution must be spatially independent from each other. This does not mean that their time courses are mutually independent as well (11). They are possibly correlated with each other because the convolution process of tracer kinetics usually relates them. The assumption of spatial independence could be weakened by the partial-volume and spillover effects in the PET images—that is, spillover from the activity of a component would contaminate the activities in neighboring components. The slight blurring of the boundaries of the resulting images shown in Figure 3 might be a reflection of this effect, but the results are sufficient for us to identify the main cardiac components and extract their time–activity curves. Considering the very poor noise property and anatomic definition in raw dynamic image of H215O PET, the
FIGURE 3. Cardiac regions separated using ICA method. Short-axis views of independent component images of RV (A), LV (B), and myocardium (C).
INDEPENDENT COMPONENT ANALYSIS
FOR
PET • Lee et al.
941
CONCLUSION
Using the source separation by ICA, we could blindly separate cardiac components and noninvasively extract the LV input function. The ICA-generated input functions had the same shapes as those of the arterial samples, and the estimated MBF with ICA showed a good correlation with the result using microspheres. Because all processes were automatically achieved with very short computation time, this method will be clinically useful for quantification of the rMBF using H215O dynamic PET. APPENDIX Extended Infomax ICA Algorithm
FIGURE 5. LV input function by ICA (䊐) and by arterial blood sampling (}): Their shapes were very similar except for noiseless tail of ICA-generated one and short time lags in input function by arterial sampling.
ICA gave us satisfactory results. ICA can also reduce additional cost and remove possible erroneous factors, such as the misalignment between scans that might arise with the use of C15O PET images. Factor analysis has been the most common approach used to separate various components from the dynamic sequences used in nuclear medicine (5–10,19,20). Our group and others have also applied factor analysis to myocardial H215O PET images with the same purpose as this study and showed its validity (5– 8). We showed that the MBF obtained by factor analysis was also well correlated (r ⫽ 0.93) with that obtained by the microsphere method when we used the same data as those of this study (8). ICA and factor analysis can be used to mutually compensate each other, and their combination can be more suitable for some problems. Preprocessing of dynamic data using factor analysis instead of PCA and the apex finding by ICA, which is the critical step in factor analysis, are possible combinations. We have not yet addressed the MBF in the abnormal range. Additional investigation using the animal model of myocardial ischemia and infarction by coronary occlusion is necessary to further validate our method. Clinical investigation would, of course, be carried out on patients with coronary artery disease. In the case of human study, because more radiopharmaceutical is injected into humans than dogs, slower injection of water is required to reduce the dead time effect caused by the huge amount of radioactivity in the LV region. This dead time undermines the peak activity in the LV input function, so that the MBF using this input function is underestimated. On the other hand, a possible problem of slow injection of the bolus input is that the shapes of time–activity curves of the LV input function and myocardial activity will tend to resemble each other. This would prevent ICA from separating them. There should be some trade-off between the slower injection and the dead time effect.
942
THE JOURNAL
OF
The information maximization approach provides a general learning rule for the neural network for ICA (13,15,16). The learning rule can be derived by maximizing the output entropy H(y). The joint entropy at the outputs is: H共y兲 ⫽ H共y1, . . . , yN兲 ⫽ H共y1兲 ⫹ . . . ⫹ H共yN兲 ⫺ I(y1, . . ., yN),
Eq. 7
where H(yi) are the marginal entropies of the outputs and I(y1, . . . , yN) is their mutual information. Because the mutual information is the measurement of the dependency between the random variables, the minimization of mutual information results in the variables being as independent as possible. Bell and Sejnowski (15) showed that maximizing the joint entropy H(y) of the output of a neural processor can approximately minimize the mutual information among the output components (13).
FIGURE 6. Correlation of MBFs obtained using ICA method and microsphere technique (y ⫽ 0.45 ⫹ 0.98x; r ⫽ 0.95, P ⬍ 0.000).
NUCLEAR MEDICINE • Vol. 42 • No. 6 • June 2001
The extended infomax learning algorithm proposed by Lee et al. (16) to maximize the joint entropy provides a simple learning rule for sources with a variety of distributions. The extended infomax learning rule can be summarized as the following equation: ⌬W ⬀ 关I ⫺ K ⫻ tanh共u兲 ⫻ uT ⫺ u ⫻ uT兴W,
5.
6.
Eq. 8 7.
where K is an N-dimensional diagonal matrix, of which the diagonal element ki must be: ki ⫽ sign共E兵sech2共ui兲其E兵u2i 其 ⫺ E兵关tanh共ui兲兴ui其兲.
Eq. 9 9.
The log-likelihood of the PDF of the observation described as the following equation is a measurement of the independency between the estimates:
冘 log p 共u 兲.
8.
10.
11.
N
L共u, W兲 ⫽ log兩det共W兲兩 ⫹
i
i
Eq. 10
12.
i⫽1
13.
ACKNOWLEDGMENTS
14.
This work was supported in part by Seoul National University Hospital, by the Ministry of Science and Technology of Korea, and by Brain Korea 21 Human Life Sciences. REFERENCES
15. 16.
17.
1. Bergmann SR, Fox KAA, Rand AL, et al. Quantification of regional myocardial blood flow in vivo with H215O. Circulation. 1984;70:724 –733. 2. Araujo LI, Lammertsma AA, Rhodes CG, et al. Noninvasive quantification of regional myocardial blood flow in coronary artery disease with oxygen-15labeled carbon dioxide inhalation and positron emission tomography. Circulation. 1991;83:875– 885. 3. Lammertsma AA, De Silva R, Araujo LI, Jones T. Measurement of regional myocardial blood flow using C15O2 and positron emission tomography: comparison of tracer models. Clin Phys Physiol Meas. l992;13:1–20. 4. Bol A, Melin JA, Vanoverschelde J-L, et al. Direct comparison of [13N]ammonia
18.
19. 20.
and [15O]water estimates of perfusion with quantification of regional myocardial blood flow by microspheres. Circulation. 1993;87:512–525. Hermansen F, Ashburner J, Spinks TJ, Kooner JS, Camici PG, Lammertsma AA. Generation of myocardial factor images directly from the dynamic oxygen15-water scan without use of an oxygen-15-carbon monoxide blood-pool scan. J Nucl Med. 1998;39:1696 –1702. Frouin F, Merlet P, Bouchareb Y, et al., Validation of regularized factor images to measure coronary reserve using O-15 water scans versus intracoronary Doppler method [abstract]. J Nucl Med. 1999;40(suppl):8P. Ahn JY, Lee JS, Lee DS, Jeong JM, Chung J-K, Lee MC. Multi-plane factor analysis for extracting input functions and tissue curves from O-15 water dynamic myocardial PET [abstract]. J Nucl Med. 1999;40(suppl):77P. Ahn JY, Lee DS, Kim SK, et al. Validation study of factor analysis to estimate regional myocardial blood flow from dynamic myocardial H215O PET scan [abstract]. J Nucl Med. 2000;41(suppl):47P. Houston AS. The effect of apex-finding errors on factor images obtained from factor analysis and oblique transformation. Phys Med Biol. 1984;29:1109 –1116. Houston AS, Sampson WFD. A quantitative comparison of some FADS methods in renal dynamic studies using simulated and phantom data. Phys Med Biol. 1997;42:199 –217. McKeown MJ, Makeig S, Brown GG, et al. Analysis of fMRI data by blind separation into independent spatial components. Hum Brain Mapp. 1998;6:160 – 188. Makeig S, Westerfield M, Jung T-P, et al. Functionally independent components of the late positive event-related potential during visual spatial attention. J Neurosci. 1999;19:2665–2680. Lee T-W. Independent Component Analysis: Theory and Applications. Boston, MA: Kluwer Academic; 1998. Haykin S. Neural Network: A Comprehensive Foundation. 2nd ed. Upper Saddle River, NJ: Prentice-Hall; 1999:484 –544. Bell AJ, Sejnowski TJ. An information-maximization approach to blind separation and blind deconvolution. Neural Comput. 1995;7:1129 –1159. Lee T-W, Girolami M, Sejnowski TJ. Independent component analysis using an extended infomax algorithm for mixed subgaussian and supergaussian sources. Neural Comput. 1999;11:417– 441. Heymann MA, Payne BD, Hoffman JI, Rudolph AM. Blood flow measurements with radionuclide-labeled particles. Prog Cardiovasc Dis. 1977;20:55–79. Herrero P, Markham J, Myears DW, Weiheimer CJ, Bergmann SR. Measurement of myocardial blood flow with positron emission tomography: correction for count spillover and partial volume effects. Math Comput Model. 1988;11:807– 812. Di Paola R, Bazin JP, Aubry F, et al. Handling of dynamic sequences in nuclear medicine. IEEE Trans Nucl Sci. 1982;29:1310 –1321. Wu H-M, Hoh CK, Buxton DB, et al. Quantification of myocardial blood flow using dynamic nitrogen-13-ammonia PET studies and factor analysis of dynamic structures. J Nucl Med. 1995;36:2087–2093.
INDEPENDENT COMPONENT ANALYSIS
FOR
PET • Lee et al.
943