bootstrapping technique and robust methods in ridge regression model for data ..... extended to the other models such as logistic and Poisson regression model.
J. Appl. Environ. Biol. Sci., 4(7S)150-156, 2014
ISSN: 2090-4274
© 2014, TextRoad Publication
Journal of Applied Environmental and Biological Sciences www.textroad.com
Bootstrapped Parameter Estimation in Ridge Regression with Multicollinearity and Multiple Outliers Siti Meriam Zahari, Norazan Mohamed Ramli, Balkiah Mokhtar Department of Statistics and Decision Science Studies, UiTM Shah Alam Received: September 1, 2014 Accepted: November 13, 2014
ABSTRACT An estimation of a regression is said to be superior if it is robust and resistant towards the presence of multicollinearity, outliers or non-normality. With regard to these problems, estimation using the OLS is inefficient since it could not produce the least variance. Disregarding this problem would potentially lead to severe statistical problems. Therefore, the main objective of the study is to employ a combination of a bootstrapping technique and robust methods in ridge regression model for data with simultaneous problems of multicollinearity and multiple outliers. This study employed the fixed - x resampling technique for robust ridge regression. The proposed method was expected to reduce the effect of the problems to the estimation results by producing lower standard error values as compared to the existing methods. The results of the study showed that the proposed technique was able to produce better parameter estimates with lower standard error values. KEYWORDS: Bootstrap, Fixed-x resampling, Multiple Outliers; Multicollinearity 1 INTRODUCTION A linear regression is used mainly to model a relationship between two or more than two variables. In general, the most popular method used for regression is Ordinary Least Squares (OLS) for its ease and simplicity. The OLS method is claimed to be unbiased, efficient and consistent estimator as compared to other linear unbiased estimators. However, this superiority features can be held only if the assumptions of classical linear regression model are satisfied. If the assumption is violated, the OLS method will no longer produce the least variance, leading to the inefficiency in estimating a model. One of the assumptions is that there is no exact linear relationship between the explanatory variables. Multicollinearity is said to present if this assumption is violated. In the presence of multicollinearity, the OLS estimator will produce infinite variance, which could lead to misleading interpretation of test statistics. If the purpose of a study is merely to predict the values of the dependent variable, multicollinearity is not a problem. However, the real issue arises if the study aims for parameter estimation. This is due to that, multicollinearity inflates the standard error values. A severe issue is concerned when the situation is affected by the presence of outliers. In general, outliers can be regarded as an observation that behaves differently as compared to the rest of observations. The presence of outliers will distort the parameter estimation of a model, hence inflate the statistical test and lead to misleading conclusions. Most of regression analysis assumes normality assumption of the error distribution. However in practice, there is a situation where the error distribution is not normal. In this case, disregarding the non normality of the error distribution will affect the estimation of a model. Ridge regression was firstly initiated by Hoerl [4] and Hoerl and Kennard [5] by introducing a biasing parameter with more stable and precise than the OLS estimator in handling the multicollinearity problem. Robust estimation is used mainly to handle the outliers problem by downweighting the effect of outliers. Robust estimator used in this study is a MM - estimator that was introduced by Yohai [10]. The MMestimator is an extended version of M-estimator that was previously proposed by Huber [6]. This method is a combination of the properties of high asymptotic relative efficiency of M-estimator with the high breakdown of a class of S-estimator. Habshah and Marina [3] proposed a combination of ridge regression and robust techniques for multicollinearity and outliers problems. The study was further extended to
* Corresponding Author: Siti Meriam Zahari, Department of Statistics and Decision Science Studies, UiTM Shah Alam,
150
Zahari et al.,2014
weighted ridge regression with robust M-estimator (Siti Meriam et al., [11]) and robust MM-estimator (Siti Meriam et al., [12]). This study aims to propose an alternative method that is resistant to the presence of simultaneous problems of multicollinearity and multiple outliers, using a combination of bootstrapping technique and robust methods in ridge regression. We propose a slight modification from what have been found in the literatures, which is to combine the bootstrapping method and robust ridge regression. We would like to examine the superiority of the proposed method as an enhancement to the existing methods when handling simulataneous problems of multiple outliers and multicollinearity. Bootstrap is a re-sampling method that is commonly used to estimate bias, standard error and to construct the confidence interval of an estimator. Efron and Tibshirani [2] stated that bootstrap is about treating the sample data as a population from which the repeated samples are drawn. The standard errors and sampling distribution of the robust regression estimates can be estimated from the drawn samples. In regression, bootstrap method is preferred because it relaxes the assumption that the error distribution must follow the normality assumption (Norazan et al., [8]. According to Ohtani [9], bootstrap method is reasonable to evaluate the precision of parameter estimate obtained using ridge regression estimation by Monte Carlo experiments, which observed through its standard error. The classical bootstrap usually is based on the OLS estimate, which is not robust to the presence of outliers. Norazan et al. [8] proposed Weighted Bootstrap with Probability (WBP) in comparison with fixed-x resampling, random-x resampling and Diagnostic-Before Bootstrap estimates. The bootstrap method is able to produce better estimation, as the problem of outliers arise. This is due to that bootstrap sample is done by resampling with probabilities to ensure that the outlying observations have smaller probabilities of selection. They found that WBP is the best estimator as it is consistently provides good estimates and shortest confidence interval. This paper is organized as follows – methodology of this research is discussed in Section 2; in Section 3 the newly proposed technique and its performances are presented; and the final conclusion is made in Section 4. 2 METHODOLOGY A simulation study was designed to assess the performance of OLS and robust ridge regression estimator incorporated with the bootstrapping method. A simulated data were generated using the multiple linear regression model based on combinations of several regression conditions as follows: i) Sample size (n) is 25, 50, 100 and 200, ii) Two types of rho, ρ ; ρ is fixed to 0.9 and ρ is uniformly distributed, U(0.10, 0.98), respectively, iii) Percentage of outliers, α is 5%, 10%, 15% and 20%. Based on the condition stated above, we study the performance of the estimators according to severity of multicollinearity by using different degrees of correlation, ρ between the variables. In addition, the effect of sample size, n was also observed. Two explanatory variables were used. At the same time, the performances of estimators were observed by increasing the percentage of outliers, α . Thus, for the given values of n, α and ρ , the set of explanatory variables was generated and simulated for 1000 times for all five estimators. For this simulation study, the values of true parameters were set to 1. The clean and in-lying observations of predictor variables were generated using multivariate normal distribution. The outliers observations, bad.n = α % of n were generated based on percentage. The effect of outliers were exposed to both x and y-direction.
There are two commonly bootstrapping techniques used for linear regression analysis. They are fixed-x resampling and random-x resampling. This study employed the fixed-resampling technique. The procedure for bootstrapping robust ridge estimates with fixed x – resampling is discussed as follows:
151
J. Appl. Environ. Biol. Sci., 4(7S)150-156, 2014
Step 1:
Fit a model to the original sample of observations of size n to get βˆ using OLS estimator and the fitted values yˆi = f ( xi , βˆ )
Step 2: Compute the residuals Step 3:
Draw
εi*
ε i = yi − yˆ i
from
εi
and attach to
yˆi
to get a fixed-x bootstrap value
yi*
where yi* = f ( xi , βˆ ) + ε i* Step 4: Step 5:
Regress the bootstrapped values
yi* on the fixed X to obtain β *
Repeat Step 3 and Step 4 for B times to get
βˆ *1 ,...,βˆ *B
This algorithm was then applied using other existing estimators namely, the RIDGE, RMM, WRM and WRMM as a replacement to the OLS estimator. For each bootstrap method, B = 1000 bootstrapped random samples were generated. For each bootstrapped mth sample, where m=1, 2,..., 1000, Based on these
βˆ *m
were obtained.
βˆ *m , the standard errors and the mean value were respectively calculated. 1 B SE ( βˆ * ) = ∑ ( βˆ *m − β * ) B m =1 B
∑ βˆ β* =
(1)
(2)
*m
m =1
B 3 FINDINGS
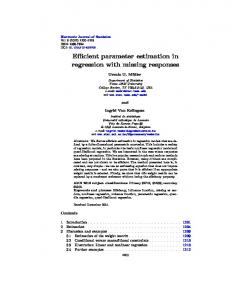
Table 1 presents a simulation result of the bias and standard error of the parameter estimates βˆ1 . The degree of multicollinearity is fixed to 0.9 to represent a high degree of collinearity among the explanatory variables. As we can see from the table, the performance of the OLS estimator is poor since the standard error is very high as compared to other estimators. The effect becomes severe as the percentage of outliers increases. The OLS estimator without bootstrapping technique shows the worst performance since the standard error is larger than the other existing estimators. On the other hand, the incorporation of the bootstrap technique reduces the standard error values of the OLS estimator. However, this estimator performes poorly as compared to robust ridge regression, particularly when the sample size and the percentage of outliers increase. Results from the table also display that the WRM seems to be the most resistant estimator towards the presence of 5% outliers, by producing the lowest values of bias, 1.078 and standard error, 0.134 as compared to the other methods. Further, when the effect of outliers is increased to 20%, it is reported that the WRMM estimator becomes the most superior, by producing the lowest standard error value of 0.0080. Surprisingly, the OLS estimator outperformed the others when the bias value is the lowest than that of other estimators. This scenario occurs when 10% and 20% of outliers were used in the sample. The results indicate that even the classical estimator such as OLS is able to outperform others when only the bootstrapping technique is considered.
152
Zahari et al.,2014
Table 1. Bias and standard errors (in bracket) based on with and without bootstrapping on 1000 runs for using
α % 5
Method OLS RIDGE
10
n=200 0.478 [1.654]
n=25 3.919 [4.281]
With Bootstrapping n=50 n=100 4.093 0.646 [2.311] [2.396]
n=200 2.107 [1.584]
RMM
0.485 [1.581] 0.483
0.474 [1.138] 0.467
0.468 [0.804] 0.467
0.555 [0.777] 0.491
1.141 [1.030] 1.253
0.511 [0.134] 0.515
0.617 [0.500] 0.790
WRM
[2.095] 0.482
[1.545] 0.472
[1.115] 0.470
[0.803] 0.468
[0.619] 0.473
[1.026] 1.078
[0.138] 0.520
[0.658] 0.752
WRMM
[2.349] 0.449
[1.656] 0.479
[1.172] 0.463
[0.818] 0.468
[0.427] 0.485
[0.976] 1.092
[0.134] 0.515
[0.602] 0.827
OLS
[2.146] 0.386
[1.600] 0.470
[1.142] 0.485
[0.815] 0.478
[0.579] 10.618
[1.075] 2.012
[0.135] 1.853
[0.669] 0.852
[4.776]
[3.331]
[2.327]
[1.653]
[4.473]
[2.404]
[2.350]
[1.595]
0.449
0.495
0.472
0.466
4.292
0.140
0.639
0.469 [0.321]
[2.305]
[1.570]
[1.140]
[0.803]
[2.809]
[0.777]
[0.638]
RMM
0.472
0.475
0.471
0.465
4.176
0.109
0.741
0.468
WRM
[2.257] 0.478
[1.563] 0.475
[1.137] 0.469
[0.803] 0.467
[2.761] 3.882
[1.228] 0.119
[0.833] 0.788
[0.259] 0.464
WRMM
[2.372] 0.488
[1.657] 0.469
[1.171] 0.468
[0.816] 0.466
[2.515] 4.074
[1.055] 0.237
[0.728] 0.800
[0.230] 0.461 [0.265]
[2.322]
[1.631]
[1.167]
[0.814]
[2.803]
[1.151]
[0.796]
OLS
0.379
0.478
0.482
0.475
1.978
5.288
1.476
0.312
RIDGE
[4.765] 0.447
[3.339] 0.499
[2.318] 0.471
[1.651] 0.466
[4.937] 0.511
[3.287] 1.457
[2.179] 0.474
[1.623] 0.498
RMM
[2.310] 0.474
[1.573] 0.486
[1.129] 0.471
[0.803] 0.466
[0.181] 0.528
[1.400] 1.449
[0.212] 0.459
[0.184] 0.504
[2.310]
[1.595]
[1.132]
[0.803]
[0.189]
[1.427]
[0.188]
[0.122]
0.480
0.478
0.469
0.467
0.503
1.450
0.459
0.515
[2.391] 0.492 [2.380] 0.383
[1.667] 0.478 [1.667] 0.469
[1.168] 0.470 [1.167] 0.479
[0.815] 0.467 [0.814] 0.478
[0.145] 0.509 [0.188] 2.070
[1.415] 1.489 [1.346] 4.540
[0.194] 0.455 [0.186] 1.006
[0.109] 0.509 [0.116] 0.503
WRM
WRMM 20
Without Bootstrapping n=50 n=100 0.459 0.486 [3.329] [2.324]
0.460 [2.280] 0.443
RIDGE
15
n=25 0.368 [4.743]
ρ = 0.9 with 2 predictor variables.
OLS
[4.839]
[3.344]
[2.315]
[1.653]
[4.317]
[2.910]
[1.853]
[1.749]
RIDGE
0.450 [2.361]
0.492 [1.585]
0.465 [1.127]
0.468 [0.806]
0.502 [0.207]
0.699 [1.442]
0.454 [0.368]
0.469 [0.268]
RMM
0.474
0.479
0.465
0.467
0.496
0.507
0.395
0.477
WRM
[2.359] 0.479
[1.606] 0.472
[1.127] 0.463
[0.807] 0.468
[0.079] 0.475
[1.304] 0.351
[0.493] 0.421
[0.136] 0.482
WRMM
[2.423] 0.490
[1.679] 0.472
[1.159] 0.463
[0.819] 0.468
[0.087] 0.468
[1.321] 0.407
[0.508] 0.357
[0.160] 0.488
[2.419]
[1.678]
[1.158]
[0.817]
[0.080]
[1.289]
[0.488]
[0.132]
153
βˆ1
J. Appl. Environ. Biol. Sci., 4(7S)150-156, 2014
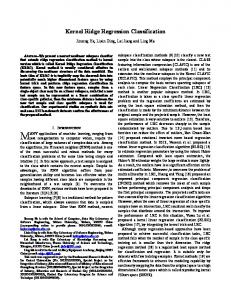
Table 2. Bias and standard errors (in bracket) based on with and without bootstrapping on 1000 runs for using rho, ρ generated from Uniform Distribution, U[0.10,0.98] with 2 predictor.
α
Method
% 5
n=50
n=100
n=200
n=25
n=50
n=100
n=200
0.471
0.506
0.479
0.494
2.324
0.177
0.481
0.638
[2.759]
[1.838]
[1.276]
[1.892]
[1.731]
[1.881]
[1.009]
[0.729]
RMM
0.486 [1.447] 0.478
0.470 [1.462] 0.481
0.453 [1.454] 0.460
0.461 [1.459] 0.466
0.145 [0.825] 0.323
3.468 [1.147] 3.228
0.396 [0.238] 0.380
0.583 [0.663] 0.614
WRM
[1.283] 0.497
[1.443] 0.478
[1.264] 0.462
[1.173] 0.473
[0.999] 0.092
[1.116] 3.166
[0.334] 0.439
[0.663] 0.572
OLS
[1.519]
[1.518]
[1.514]
[1.512]
[0.800]
[1.100]
0.490
0.488
0.465
0.474
0.269
3.092
[0.138] 0.431
[0.633]
WRMM OLS
[1.314] 0.444
[1.489] 0.509
[1.507] 0.482
[1.515] 0.493
[0.860] 8.323
[1.018] 0.509
[0.312] 0.397
[0.646] 2.633
[2.744]
[1.839]
[1.278]
[0.892]
[3.418]
[1.385]
[1.169]
[0.914]
0.487
0.489
0.497
0.496
0.400
0.416
2.122
0.687
[0.928]
[0.925]
[0.926]
[0.927]
[0.336]
[0.245]
[0.951]
[0.565]
WRM
0.482 [0.906] 0.482
0.481 [0.924] 0.484
0.494 [0.932] 0.492
0.492 [0.934] 0.489
0.402 [0.416] 0.448
0.444 [0.142] 0.446
2.438 [1.026] 2.582
0.673 [0.554] 0.632
WRMM
[0.959] 0.479
[0.959] 0.479
[0.962] 0.492
[0.969] 0.489
[0.425] 0.456
[0.147] 0.442
[1.048] 2.572
[0.529] 0.677
[0.931]
[0.951]
[0.961]
[0.967]
[0.398]
[0.142]
[1.002]
[0.519]
RIDGE RMM
15
20
With Bootstrapping
n=25
RIDGE
10
Without Bootstrapping
0.585
OLS
0.419
0.514
0.480
0.493
0.742
4.115
0.163
1.429
RIDGE
[2.751] 0.481
[1.847] 0.482
[1.275] 0.481
[0.891] 0.478
[4.040] 0.353
[1.421] 0.422
[1.003] 0.476
[0.858] 0.862
RMM
[0.686] 0.481
[0.685] 0.481
[0.683] 0.481
[0.681] 0.478
[0.402] 0.427
[0.278] 0.355
[0.202] 0.469
[0.831] 0.811
[0.680]
[0.688]
[0.687]
[0.684]
[0.336]
[0.362]
[0.211]
[0.831]
WRM
0.479
0.479
0.478
0.475
0.464
0.354
0.473
0.910
WRMM
[0.716] 0.479
[0.713] 0.479
[0.712] 0.479
[0.709] 0.475
[0.299] 0.465
[0.353] 0.349
[0.198] 0.473
[0.877] 0.823
OLS
[0.702] 0.428
[0.712] 0.508
[0.711] 0.477
[0.707] 0.495
[0.326] 2.422
[0.369] 1.305
[0.204] 2.765
[0.841] 1.248
[2.762]
[1.842]
[1.275]
[0.891]
[2.211]
[1.514]
[2.087]
[0.625]
0.490
0.489
0.491
0.491
0.508
1.435
0.641
0.849
RIDGE
[0.491]
[0.490]
[0.491]
[0.492]
[0.153]
[0.610]
[0.321]
[0.451]
RMM
0.491
0.490
0.492
0.492
0.502
1.365
0.622
0.875
WRM
[0.488] 0.491
[0.490] 0.490
[0.492] 0.491
[0.493] 0.491
[0.146] 0.518
[0.592] 1.277
[0.264] 0.562
[0.489] 0.812
WRMM
[0.498] 0.490
[0.496] 0.490
[0.498] 0.491
[0.499] 0.491
[0.144] 0.513
[0.586] 1.267
[0.271] 0.585
[0.482] 0.826
[0.494]
[0.496]
[0.497]
[0.498]
[0.140]
[0.573]
[0.262]
[0.475]
154
βˆ1
Zahari et al.,2014
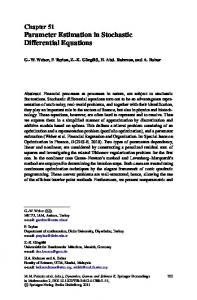
Simulation study was also done for the case of multicollinearity with rho, ρ generated from Uniform distribution, U(0.10, 0.98), and is presented in Table 2. It gives quite similar results as shown in Table 1, in which almost all estimators worked very well with bootstrap technique. The WRM estimator has the lowest standard errors, 0.138 and 0.198 when the presence of outliers is 5% and 15%, respectively. As the percentage increases to 20%, the WRMM estimator has the lowest standard error, 0.140. In addition, the lowest bias is produced by the WRM estimator with the value of 0.910, when the percentage of outliers is 15%. The performance of each estimator is summarized in Table 3, in which each estimator is evaluated based on the lowest bias and standard error values. Out of all estimators, the WRM estimator is the most robust and resistant towards the presence of simultaneous outliers and multicollinearity. Table 3. The frequency of each estimator with lowest bias and standard error when bootstrapping technique is incorporated for the case of multicollinearity is high, 0.9 and according to uniform distribution. Method OLS RIDGE RMM WRM WRMM
Bias 2
rho = 0.9 Standard Error 1
1 1
3 1
rho =U[0.1,0.98] Bias Standard Error 1 1 1 1 1 2 2
Frequency 3 2 3 7 3
4 Conclusion In summary, by incorporating bootstrapping technique, it gives better parameter estimates, especially for data sets with simultaneous problems of outliers and multicollinearity. Simulation results prove that model parameter estimates are produced with lower standard error values. The integration of robust ridge regression with bootstrapping technique is recommended as an alternative method. For instance, analysis carried in the study of Bibi Asia Naz et al. [1] can be extended by using the proposed method. Apart from the application of this proposed method in multiple linear regression, it is recommended to be applied or extended to the other models such as logistic and Poisson regression model. REFERENCES 1.
Bibi Asia Naz, Javed Iqbal, Amir Zaman, Abdul Ghaffar & Fazli Ameen. (2013). Factors Influencing Teaching Process at Abdul Wali Khan University Mardan: A Comparative Study. VFAST Transactions on Education and Social Sciences. 2(2), 18-23.
2.
Efron, B. & Tibshirani, R. J. (1993). An Introduction to the Boostrap. Washington D. C: Chapman & Hall/CRC.
3.
Habshah Midi & Marina Zahari. (2007). A Simulation Study on Ridge Regression Estimators in the Presence of Outliers and Multicollinearity. Journal of Technology. 47(c), 59-74.
4.
Hoerl, A.E. (1962). Application of Ridge Analysis to Regresion Problem. Chemical Engineering Progress. 58, 54-59.
5.
Hoerl, A.E and Kennard, R.W. (1970). Ridge Regression, Biased Estimation for Non Orthogonal Problems. Technometrics. 42, 80 – 86.
6.
Huber, P. K. (1964). Robust Estimation of a Location Parameter. The Annals of Mathematical Statistics. 35, 73-101.
7.
Manzoor Khan & Javid Shabbir. (2013). A General Class of Estimators for Finite Population Mean in the Presence of Non-Response when Using the Second Raw Moments. VFAST Transactions on Mathematics. 2(2), 19-36.
155
J. Appl. Environ. Biol. Sci., 4(7S)150-156, 2014
8.
Norazan, M.R., Habshah Midi & Imon, H.M.R. (2009). Estimating Regression Coefficients using Weighted Bootstrap with Probability. WSEAS Transaction on Mathematics. 362-371.
9.
Ohtani, K. (2007). On the Evaluation of Precision of a Ridge Regression Estimator by Bootstrap Methods. Journal Of Economics & Business Administration. 195, 17-28.
10. Yohai, V.J (1987). High Breakdown Point and High Efficency Robust Estimates for Regression. The Annals of Statistic. 15(20), 642-656. 11. Siti Meriam Zahari, Mohammad Said Zainol & Muhammad Iqbal Al-Banna Ismail. (2012a). Weighted Ridge M-Estimator in the Presence of Multicollinearity. IEEE Colloquium on Humanities, Science & Engineering Research. 239-243. 12. Siti Meriam Zahari, Mohammad Said Zainol & Muhammad Iqbal Al-Banna Ismail (2012b). Weighted Ridge MM-Estimator in Robust Ridge Regression with Multicollinearity. Mathematical Models and Methods in Modern Science. 124-129.
156