Border detection on remote sensing satellite data using self-organizing maps Nuno C. Marques and Ning Chen CENTRIA, Department of Inform´ation, Faculdade de Ciˆencias e Tecnologia New University of Lisbon, Quinta da Torre, 2829-516 Caparica, Portugal
[email protected],
[email protected] WWW home page: http://centria.di.fct.unl.pt/˜nmm
Abstract. In this paper, a new approach to Mediterranean Water Eddy border detection is proposed. Kohonen self-organizing maps (SOM) are used as data mining tools to cluster image pixels through an unsupervised process. The clusters are visualized on the SOM internal map. From the visualization, the borders can be detected through an interactive way. As a result, interesting patterns are visible on the images. The proposed SOM approach is tested on Atlantic Ocean satellite data and compared with conventional gradient edge detectors.
Keywords remote sensing satellite data, border detection, self-organizing map (SOM), clustering, gradient edge detector
1 Introduction With the increasing amount of multimedia databases, image retrieval is becoming a very important research area. Recent developments and promising issues on visual-based image retrieval are reviewed in [17]. Satellite data provides a huge resource for image retrieval in diverse fields including weather prediction, water resource, agriculture and environment sciences [11]. Data mining tools could be used to exploit interesting patterns from remote sensing satellite data in the context of image retrieval. This paper will focus on the detection of Mediterranean Water Eddies (Meddies) on remote sensing satellite thermal images. Meddies allow the spreading of Mediterranean Water in the Atlantic at depth between 800 and 1200 meters, over thousands of kilometers with very little mixing. Due to its high salinity and temperature, the presence of Mediterranean Water influences strongly the hydrology and dynamics of the Atlantic Ocean and plays an important role in the transport of particles, suspended material and live organisms. Recently it was found that the clockwise rotation of the Meddies extends from the depths where they are centered up to the surface layer of the ocean. The identification of the surface signature of Meddies using satellite remote sensing data (sea surface temperature-SST and chlorophyll concentration) could be a key point for a better understanding of the dynamics of the Atlantic Ocean. Active ongoing research on the generation and movement of Meddies requires the inspection of satellite maps. Until now this has been a mainly visual task [15], involving a large amount of time. Due to the large amount of information received at Oceanographic Institute satellite station, there
2
is an urgent need for an automated analysis of such information. This paper will show how Kohonen self-organizing maps are helpful in the Meddy identification problem. Kohonen self-organizing maps (SOM) are robust, fast, effective artificial neural networks for unsupervised clustering. SOMs allow us to reduce the amount of data and, simultaneously, project the data nonlinearly onto a lower dimensional grid. SOMs possess unique properties for data reduction, projection, and visualization [10]. Through topology preserving transformations, they project the data to a set of neurons on regular grid maps. The neurons close to each other in the grid space have similar features in the input space. The main advantage of using SOMs over other clustering algorithms for this task is their visualization capabilities. In fact, by visualizing the data projected into SOM’s lower dimensional grid we are able to easily discover the cluster structure in data. Although there have been many studies concerning image acquisition using SOM in the literature, its application to the ocean research field for the purpose of border detection remains novel. A method for border detection using SOM will be studied in real world images. The application here presented to Oceanographic studies could be generalized to other application areas where border detection is needed. In this paper, we develop an approach based on SOM neural networks to cluster image pixels according to color (SST) and spatial information in order to recognize Meddy borders through SOM visualization. Experiments show that SOM networks improve the capability of image analysis over the traditional gradient methods. The remainder of this paper is organized as follows. The research work related to our paradigm is addressed in section 2. A detailed description of the proposed approach is given in section 3. Then, the experimental results are discussed and a few issues are addressed in section 4. Finally, the paper is concluded with contributions and future work in section 5. Future work will be focused on developing a fully automated process for border detection.
2 Related work Clustering techniques have a wide range of utilization in remote sensing data processing, particularly, SOMs have been successfully applied to various real world problems, e.g., cloud segmentation [19, 22], lineament delineation [20], over-ocean oceanic precipitable water retrieval [6], color compression [4], typhoon analysis and prediction [2], image indexing and thesaurus creation [16]. The usages of SOM in past research on image acquisition varied on data sources, extracted features and mining objectives. From the viewpoint of data, SOMs have been applied to remote sensing satellite data including cloud images [19, 22, 2], digital maps [16], earth surface [20] and oceanic images [6]. In these tasks, the data extracted in preprocess comes from pixel-level features, e.g., color [12], brightness [9], spatial position [12], or region-level features through texture analysis [13, 19] or other statistical approaches [2]. All these works use SOM as a clustering tool in an unsupervised manner, possibly followed by a fine-tuning and labeling step in a supervised manner. Image segmentation is a process to partition an image into a set of homogeneous, continuous regions with high intra-similarity and low inter-similarity. The similarity criterion is strongly application-dependent and could be based on color, intensity and texture features. The two main approaches developed for image segmentation are re-
3
gion growing and border (edge) detection. In the former, the pixels are firstly separated into partial blocks and then merged into a number of continuous regions [12] or clusters [14]. In the latter, the main focus is not on finding the best segmentation of regions, but rather on detecting the borders of regions. Border detection plays an important role in many computer vision and image interpretation applications. A common approach to solve this problem is to use gradient edge detectors that record the edge as the location of abrupt changes of intensity to neighbors [18]. Variations of edge detectors have been defined on different gradient operators: Sobel, Prewitt, Roberts, and derivatives based on Gaussian filter, e.g. Laplacian, Zero-cross, Canny [5]. All these methods evaluate the magnitude and directions of edges in a small neighborhood. There have been other border detection algorithms proposed using neural networks. In [1], the authors successfully use the topological location of organized map neurons to simulate the outer shape of human head on gray scale images. A graph-based optimal border detection method is reported in [3], learning from the border tracing examples. Unfortunately, these methods are either single-purpose oriented or knowledge supported. Although the current approach proposed in this paper is human-aided, our final objective is to develop a general approach without a priori knowledge of the detected boundary.
3 Methodology In the reported research work, the remote sensing data consisted on sea surface temperature images of Portugal received and processed at the Space Oceanography Center of the Instituto de Oceanografia (IO) da Faculdade de Ciˆencias de Lisboa. The data was arranged into image maps, represented as matrices of float point numbers. Each cell of these matrices represents the sea surface temperature of a 1.1km x 1.1km region. With the help of graphical functions, the matrix can be shown as a surface image, where for each pixel, the color value represents water temperature. The surface signature of Meddies vary in terms of shape and size, so it is difficult to characterize them in the absence of known samples. Hence, the proposed approach is not to discover the Meddies directly, but rather to detect their borders. A region inside a border can be characterized by a continuous set of pixels with uniform color. The border of a region could then be used for detecting interesting patterns, namely Meddies. Thus, the purpose of this approach is to recognize the border of regions so that the interesting patterns are easily discovered. The proposed border detection is based on the following idea: a pixel is suitable to be recorded as a border location if its color differs enough from its neighboring pixels, otherwise, the pixel should not represent a border location. SOMs are used to cluster the pixels and recognize the border locations. In contrast to the traditional clustering algorithms resulting in a set of clusters or a hierarchy of clusters, our approach aims at discovering the pixels on the boundary of clusters rather than the clusters themselves. The general scheme of the proposed methodology is outlined in Figure 1. First, a feature retrieval step executes a preprocess operation that precedes the main analysis, generating a feature vector for each pixel. The constitution of the feature vector depends on a few predetermined parameters such as neighborhood region and weight. Secondly, a SOM is initialized and trained with the extracted feature vectors. After training, each input vector is mapped to the neuron with the closest reference vector. Due to the topo-
4
logical preserving properties of SOM, the distances between neurons reflect the similarity of the projected samples in the input space. In the subsequent step, the inter-neuron distances are visualized on the SOM internal map. Consequently, the neurons on the boundary of clusters could be recognized according to a user defined threshold. Afterwards, the corresponding pixels projected on the boundary neurons are obtained as the border locations. After reducing the isolated points the remaining borders are shown as a new image. Current version allows users to perform the last three steps iteratively by adjusting the threshold until the obtained result is considered satisfactory. However, this process could be easily automatized when the Meddy identification model is available. In fact, the desirable threshold value can be easily acquired through proper interaction with the Meddy classification module (i.e. if Meddy classifier is a probability function, we need to search for the threshold value that returns a local maximum in the classification probability).
feature vectors Feature retrieval
trained map SOM training
threshold
SOM visualization
Border recognition
borders Border filter
filtered borders Image visualization
Fig. 1. Procedure of border detection
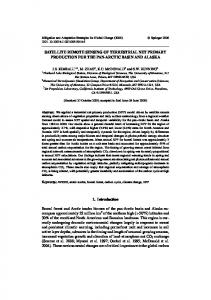
Feature retrieval is a critical component of image processing, closely related to the objective of mining tasks. For this problem, pixels are characterized by color and spatial features. Intuitively, pixels in similar color should be grouped in the same cluster, meantime, pixels with similar color to neighbors should locate themselves inside the clusters whereas pixels with different color to neighbors should be on the boundary of clusters. Typically, the feature vector is determined by the type and radius of the neighborhood region. In section 4.2, we will study two types of neighborhood region: cross and square. The former uses the neighbors on the same row or column as the current pixel. The latter uses the neighbors inside the square centered at the pixel. A neighborhood of size zero and one was used in our experiments. In Figure 2, the innermost cross or square correspond to a 1-radius region, the second cross or square would correspond to a 2-radius region. When the radius is set as one, a feature vector is composed of 4neighbors in cross region, and 8-neighbors in square region as well as the central pixel. A weight could be assigned to the center pixel to emphasize the importance of color features over spatial features. The importance of this parameter will be analyzed in section 4.2. After deciding the neighborhood region type, a gliding window scans over the whole matrix from the left to right columns and from top to bottom rows for the same column. For each pixel, a feature vector [xi1 , xi2 , . . . xik ] was extracted within
5
the neighborhood region, where k is the dimension of the feature vector. The feature retrieval step ends up with a collection of feature vectors.
(a) Cross neighborhood
(b) Square neighborhood
Fig. 2. Neighborhood region of pixel marked with blank dot
In the second step in Figure 1, the extracted feature vectors are sequentially fed to the SOM, where each neuron corresponds to a set of similar pixels. Initially, a 2dimensional map is created with a lattice of neurons on a topologically regular grid. Each neuron is associated with a reference vector [mi1 , mi2 , . . . mik ] reflecting the strength of association to input vectors. A neuron is connected to adjacent neurons by a neighborhood function h. The matching between map neurons and input vectors is measured by Euclidean distance. During the unsupervised training process, the reference vectors are updated according to the input vectors. In this paper, we have applied batch SOM as our training algorithm. Batch SOM algorithms [10] list the input vectors one by one under the best-matching units and update the neurons according to the whole data set at the end of each epoch. The reference vectors are calculated as the weighted mean of the input vectors that are similar either to them or to their topological neighbors: Pn hci p xi mp (t + 1) = Pi=1 n i=1 hci p The batch SOMs have advantages due to order-insensitivity to input data, facilitating the development of parallel processing, and eliminating the influence of learning rate as a coefficient on final result [7]. Regarding SOM visualization in Figure 1 (third step), we just need to examine SOM projection grid. SOM offers a visualized approach to investigate the rough clusters existing in data by a regular grid. For this purpose, the average distance (u-distance) between each neuron and its neighbors is calculated. The neurons with high distances indicate the boundary of clusters, and the neurons with small distances indicate the clusters themselves [21].
6
After SOM is trained, the input data is mapped to the best matching units (with the closest reference vectors). To recognize the cluster boundary, a typical procedure is to apply a threshold to the map. The neurons with the distances bigger than the threshold are considered as the border neurons. Accordingly, the samples in training data projected on one of such neurons could be found. The pixels corresponding to those samples are considered as border locations. Using different thresholds, multi-solutions of borders could be obtained. For better image visualization, the obtained borders of previous step could be further processed by a border filter. A simple but effective approach is to reduce the isolated pixels, which is motivated by the continuous property of ’good’ borders. Afterwards, an image is generated which is zero for all pixels except the interesting pixels, i.e., the border pixels.
4 Experimental results The border detection approach has been applied to the oceanographic data and performed in a machine with 256M memory and intel celeron 1.03 GHz processor running windows XP professional operating system. Typically, the oceanographic images used in our study are 2-dimensional matrices of 700 x 700 pixels. The operations for feature retrieval, border recognition, image visualization, SOM training and SOM visualization are carried out in an adapted version of SOM software [10, 23]. For the purpose of comparison, six edge gradient detectors are performed followed by the border filter operation. The parameters are set as below: – A cross region of 1-radius is used and the weight of center pixel is set as 10 in feature retrieval step. – The neurons are configured on a hexagonal lattice with the size of 10 x 10 map grid. – Topological function is defined as ’Gaussian’, and the neuron neighborhood radius decreases linearly to stabilize the effect of the input vectors on the map. – The reference vectors are initialized linearly and trained in batch for 20 epoches. 4.1 Effectiveness For clarity, we will use two images as case studies to our problem. The first image is a part of the second. Figure 3 (a) shows the original image (image one), where the Meddy is composed of two water vortexes that, in the figure, are similar to up-side-down mushroom shapes. The second image contains several Meddies and will be studied in section 4.3. Figure 3 (b) visualizes the u-distance on the trained map. The resulting detected borders are shown in Figure 3 (c) and (d) at the threshold of 1.0 and 1.12 respectively. As it can be observed, the detected borders match to the actual borders very well. The choice of threshold value is critical to the resulting borders. The threshold value effects on the width and sensitivity of detected borders. Small threshold values obtain weak borders with smooth difference to neighbors as well as strong borders with abrupt difference to neighbors. A too small value of threshold may result in wide borders due to blurred borders in the original image and also lead to many false borders
7
due to nonuniform color inside regions. A too big value of threshold may miss valuable borders. Experiments have also been done using variants of conventional gradient detectors. Canny method is relatively computationally expensive, but effective in processing noise because of the Gaussian smoothing function to remove the isolated noise, nonmaxima suppression to thin the ridges, and double thresholds scheme to reduce the false edge fragments [5]. Since ’Canny’ operator performs better than others, the results of ’Canny’ method at different thresholds are shown in Figure 3 (e-f). It was observed that the more significant and continuous borders were detected by the proposed SOM algorithm. Correspondingly, ’Canny’ either fails to discover all borders (at the high threshold) or produces too much noise (at the low threshold). This indicates that the paradigm of pixel clustering makes the SOM approach more robust to noise and blurred borders. It can be stated that the borders of regions are recognized successfully in the experiments, demonstrating that our approach is practical for this problem. 4.2 Effect of parameters The representation of a feature vector depends on the neighbor region, radius and weight. Since we are trying to detect thin borders, for presented results we have used a radius of zero (single point neighborhood region) and one. We have evaluated the results of the algorithms according to the following four criteria. Some experiments have been done on image one by varying the neighborhood region and weight in order to investigate the effect of these parameters on the resultant borders. The criteria used for evaluation include: – Noise robustness reflects the sensitivity to noise and blurred borders. – Continuity means the continuous degree of borders. – Definition concerns the width of borders. A broad border is regarded as badly defined because it does not contain much details, whereas, a thin border is well defined. – Threshold detection evaluates the sensitivity of results to the threshold value and consequently how easy it is to detect the threshold for a human. We will consider three neighborhood regions: ’cross’, ’square’, ’point’. A variant of weights from 1 to 10,000 are assigned to the central pixel. For each set of parameters, the SOM approach is performed on the image and detected borders are evaluated from the viewpoint of the four criteria. Although extensive tests have been performed, for lack of space, only the two images in Figure 4 have been included in this paper. Obviously, the desirable threshold value increases with the weight due to the bigger distance between neurons. Experiments in Table 1 demonstrate that ’point’ region results in rather discontinuous borders with too much noise and difficulty on threshold detection, but quite well defined borders. In this case where only color feature is used for clustering, the pixels in infrequent color, usually on the cluster boundary, are regarded as border locations. ’Square’ region has good performance on continuity and robustness, while fails on threshold detection and border definition, possibly because it is mor1e sensitive to the neighboring pixels. Also, ’cross’ neighbor is preferred to ’square’ region due to less
8
a
b
c
d
e
f
e
Fig. 3. (a) Original image. (b) U-distance visualization on SOM. (c) Detected borders at threshold of 1.0. (d) Detected borders at threshold of 1.12. (e-f) Borders detected by ’Canny’ gradient operator: (e) threshold=0.007, (f) threshold=0.006.
9
a
b
Fig. 4. (a) Detected borders with ’point’ region and 1-weight at threshold of 0.05. (b) Detected borders with ’square’ region and 90-weight at threshold of 7.
features used for training. In fact, the computational cost of ’square’ region is around 30% more than that of ’cross’ region. Regarding ’cross’ region, we find that weights between 6 and 20 get the best results on all the four criteria. Too small values (20) are incapable of finding good borders in all aspects. For small weights (20), the resultant borders are continuous and very robust to noise, but much wider because of blurred borders. In summary, ’cross’ region and weights between 6 and 20 will obtain good results with continuous, robust, well-defined, and threshold insensitive borders. According to the empirical knowledge, 1-radius cross region with 10 as the weight of center pixel is a good choice for feature representation. Because it is impossible to test all values by hand, we take the risk of missing the desirable threshold value. The optimal threshold value search and evaluation on results depend on human subjective judgement without any quantitative analysis. We think that with an automatical process for threshold selection (such as the one referred in section 3) this problem can be solved. The obtained SOM relies heavily on the initial conditions, e.g., map size and training epoches. Generally, a big size map is needed for a large volume of data to preserve the topological property. Experiments on image one show that a map of size 5x5 does not result in significant performance loss compared to big maps. A map of size 10 x 10 trained by 10 epoches suffices for neuron topological organization on the map. 4.3 Multi-Meddy detection When several Meddies are present in the same image, the method here presented is still feasible. The original image (image two) and resultant borders at threshold of 2.3 are shown in Figure 5 (a-b). Despite the huge number of image elements that are present,
10 Neighborhood region Point Square weight20
Noise robustness Continuity Definition Threshold detection very bad very bad good bad good good bad bad bad bad good bad good good good good good good bad good Table 1. Evaluation of results
we are still able to detect several Meddies. However, different threshold values should be used on different Meddies. This is why partial detection is another issue regarding multi-Meddy detection. We have performed partial detection by exploring the local patterns in partial images instead of detecting the global patterns on the whole image directly. For the purpose of partial detection, the whole image is split into a set of partial ones of predefined size and each partial image is processed respectively by the proposed method in the same manner. Figure 5 (c) shows the borders combined by the results of partial detections from another ocean region. In this image the thresholds are chosen manually for each partial image. Unfortunately, results are still unclear due to the manual selection of a different threshold for each partial image. Again, an automatical process for threshold selection should solve this problem. Another important factor making sense to resulted border is the predetermined size of splitting window. If the window size is too small, the window will separate the continuous borders into fragments. If the window size is too big, the window loses the advantage of image splitting. Again, image splitting raises the difficulty of threshold assignment. Generally, the smaller the size is, the less the difference between samples inside becomes so that a smaller threshold is needed. Again as the number of splits increases, manual selection of threshold value is impractical.
5 Conclusions SOMs have been applied as data-driven artificial neural networks for data clustering and visualization to a legion of different applications. Here, SOMs are used for border detection on remote sensing satellite data. The main contributions of the paper include: – A feature representation is defined on the basis of color and spatial features of pixels. – A SOM visualized approach is proposed to recognize the borders through an interactive way. – The performance on Atlantic Ocean satellite data is demonstrated. Experimental results show that the proposed approach works relatively well in terms of effectiveness. The effect of parameters on resultant borders are analyzed. The results of the proposed approach are encouraging and produce good ground for further research in remote sensing field as a general border detection method. Three interesting problems should be addressed in future work.
11
a
b
c
Fig. 5. (a) Original image. (b) Detected borders at threshold of 2.3. (c) Partial detection on a subregion with a splitting window of size 50 x 50.
12
The current border detection is not an overall automatic procedure, instead, SOMs provide an interactive way to detect the cluster boundary from visualizations. However, the search for a proper threshold value is difficult and involves multiple trials. A future direction might determine the rough value of the threshold automatically, then adjust it manually until a suitable value is found. Here, u-distance offers a useful heuristic to determine the desirable threshold similar to k-dist in DBSCAN [8]. The u-distances in the grid space estimate the density possibility in the input space. Usually, the density of inner-cluster neurons differ from that of boundary neurons significantly. When sorting the u-distances and displaying them in a graph, the density distribution could be computed to discover the suitable threshold. Also, as it was previously told, after connecting this module with a classification module, the threshold can be automatically detected in a given classification problem. Since this search will be based on all possible threshold values, the methods to select most probable thresholds will also help the computer to automatically preform this search. Namely, we expect to improve the results presented in section 4.3. Another issue is pattern recognition. Although the detected borders help to find interesting patterns, our final interest maybe identification of valuable patterns, namely Meddies. The automatic shape recognition is the main objective of our future work. For this purpose, some preliminary and extremely important issues will be addressed such as the definition of the image samples and the identification of the set of high-level features characterizing the presence of Meddies in satellite images. Sequence border detection is the third future direction. Detecting borders from a time sequence of oceanographic images is an attractive topic for tendency analysis which may provide better understanding of those borders to users. Therefore, as a future direction, an interesting thought might be to focus on a promising area discovered from a special image and then perform the border detection operation on the sequence. Thus, the evolution of the borders can be visible from the time series of visualizations. Clearly the next step regarding Meddy detection will be the systematic application of this algorithm to Meddy border recognition in available images. This will be a dramatic improvement and will allow for the mining of the IO large image database. This work will allow experts to simultaneously identify positive instances of Meddies, a task much easier than to specify domain knowledge. Moreover, high level features such as water vortexes are difficult to translate into pixel-level constraints. As a side result a set of training examples will be available for training a statistical Meddy classifier. This task will be part of a broader project to integrate the advanced AI techniques and expertise into the study of Oceanic phenomena. The ultimate goal of the collaboration with IO is to develop numerical models for the understanding of the Oceanic Mediterranean Undercurrent off the southern coast of Portugal in real time. The creation of the proposed automatic identification system will provide a new and much needed tool for the understanding of the dynamical aspects of Ocean. This could have a strong economic impact in Portugal by allowing a much better understanding of fishing resources, helping to trace sea pollution or even by helping to better predict sea storms.
13
6 Acknowledgement The authors would like to thank the Instituto de Oceanografia, Faculdade de Ciˆencias, Universidade de Lisboa for providing the interesting application problem and suggestions on a first version of the paper. We also thank the Neural networks research center, Helsinki University of Technology for distributing SOM software.
References 1. C. C. Reyes-Aldasoro, A. L. Aldeco: Image segmentation and compression using neural networks. Advances in Artificial Perception and Robotics CIMAT, Guanajuato, Mexico (2000) 2. K. Asanobu: Data mining for typhoon image collection. In Proceedings of the 2nd International Workshop on Multimedia Data Mining (MDM/KDD’2001), in conjunction with ACM SIGKDD Conference, San Francisco, USA (2001) 68–77 3. M. Brejl, M. Sonka: Medical image segmentation: automated design of border detection criteria from examples. Special Issue of Journal of Electronic Imaging 8(1) (1999) 54–64 4. J. E. Boggess, P. B. Nation, M. E. Harmon: A Kohonen map neural network for data compression of color information in digitized in digitized images. In Proceedings of the 7th Florida AI Research Symposium, Pensacola Beach, FL (1994) 5. J. F. Canny: A computational approach to edge detection. IEEE Trans. Pattern Analysis and Machine Intelligence (1986) 679–698 6. H. Chen, J. Bian, P. Yang, D. Lu: SOM-network-based algorithm for retrieving over-ocean precipitable water from the SSM/I measurements. In Proceedings of SPIE 3502 149–152 7. Q. Ding, M. Canton, D. Diaz et al.: Data mining survey. http://midas.cs.ndsu.nodak.edu/˜ding/ 8. M. Ester, H. Kriegel, J. Sander, X. Xu: A density-based algorithm for discovering clusters in large spatial database with noise. In Proceedings of Int’l Conference on Knowledge Discovery in Databases and Data Mining (KDD96), Montreal, Canada (1996) 9. I. E. Evangelou, D. G. Hadjimitsis, A. A. Lazakidou, C. Clayton: Data mining and knowledge discovery in complex image data using artificial neural networks. http://citeseer.nj.nec.com/529713.html 10. T. Kohonen: Self-organizing maps. Springer Verlag, Berlin, Second edition (1997) 11. G. Healey, A. Jain: Retrieving multispectral satellite images using physics-based invariant representations. IEEE Trans. Pattern Anal. Machine Intelligence 18 (1996) 842–848 12. Y. Jiang, K. Chen, Z. Zhou: SOM based image segmentation. In G. Wang, Q. Liu, Y. Yao, and A. Skowron (eds.): Lecture Notes in Artificial Intelligence, 2639 (RSFDGrC’03), Berlin, Springer-Verlag (2003) http://cs.nju.edu.cn/people/zhouzh/zhouzh.files/publication/ rsfdgrc03b.pdf 13. B. S. Manjunath, W. Y. Ma: Texture features for browsing and retrieval of image data. IEEE Trans. Pattern Anal. Machine Intelligence 18 (1996) 837–842 14. J. Moreira, L. D. F. Costa: Neural-based color image segmentation and classification using self-organizing maps. In Proceedings of Anais do IX SIBGRAPI (1996) 47–54 15. P. B. Oliveira, N. Serra, A. F. G. Fi´uza, I. Ambar: A study of meddies using simultaneous in situ and satellite observations. In D. Halpern (ed.), Satellites, Oceanography and Society, Elsevier Oceanography Series 63 (2000) 125–148 16. M. Ramsey, H. Chen, B. Zhu, B. R. Schatz: A collection of visual thesauri for browsing large collections of geographic images. Journal of the American Society of Information Science 50(9) (1999) 826–834
14 17. Y. Rui, T. Huang, S. Chang: Image retrieval: current techniques, promising directions and open issues. Journal of Visual Communication and Image Representation 10(4) (1999) 39– 62 18. U. Sangthongpraw, Y. Rangsanseri, P. Thitimajshima: Incorporating cluster information into multispectral image edge detection. In ACRS, Digital Image Processing (1998) http://www.gisdevelopment.net/aars/acrs/1998/ts9/ts9003pf.htm 19. O. Simula, A. Visa: Self-organizing feature maps in texture classification and segmentation. In Proceedings of International Conference on Artificial Neural Networks, Brighton, United Kingdom (1992) 20. N. Vassilasl, S. Perantonis, E. Charou, T. Tsenoglou, M. Stefouli and S. Varoufakis: Delineation of lineaments from satellite data based on efficient neural network and pattern recognition techniques. In Proceeding of Companion Volumn, SETN, the 2nd Hellenic Conference On AI, Tjhessaloniki, Greece (2002) 355–366 21. J. Vesanto, J. Himberg, E. Alhoniemi and J. Parhankangas: Self-organizing map in matlab: the SOM toolbox. In Proceedings of the Matlab DSP Conference, Espoo, Finland (1999) 35–40 22. A. Visa, K. Valkealahti, J. Iivarinen, O. Simula: Experiences from operational cloud classifier based on self-organizing map. In Procedings of SPIE, Orlando, Florida, Applications of Artificial Neural Networks V 2243 (1994) 484–495 23. Laboratory of Computer and information sciences & Neural networks research center, Helsinki University of Technology: SOM Toolbox 2.0. http://www.cis.hut.fi/projects/somtoolbox/