Map Asia 2004
SATELLITE DETECTS PRE-EARTHQUAKE THERMAL ANOMALIES ASSOCIATED WITH PAST MAJOR EARTHQUAKES Arun K. Saraf1 and Swapnamita Choudhury2 Department of Earth Sciences, Indian Institute of Technology Roorkee ROORKEE–247667, INDIA 1 2
Email:
[email protected]
Email:
[email protected]
ABSTRACT Analyzing past earthquakes and their characteristics, perhaps a better understanding about the earthquake phenomena can be made. Pressure built-up due to tectonic activities and also associated subsurface degassing might create changes in thermal regime and if by any technique this change is detected, it can provide very important clues about future earthquake activities. Thermal satellite remote sensing which can sense the earth’s surface emissivity at regular interval introduces a new way of analyzing this phenomenon. Using NOAA-AVHRR thermal infrared time series datasets, three major past earthquakes in Bhuj (India), Boumerdes (Algeria) and Bam (Iran) were analyzed for studying the thermal changes before and after the earthquakes. The study was successful in detecting pre-earthquake thermal anomalies prior to all these earthquakes. Significant thermal anomalies with a rise in temperature of about 5-10°C in the vicinity of the epicenters have been observed. The anomalies disappeared along with the events. Further, using passive microwave SSM/I sensor datasets from DMSP satellites the occurrence of the phenomenon of pre-earthquake thermal anomalies for seven earthquakes in India, China, Turkey, Afghanistan and Pakistan were observed. Key Words: Earthquake, NOAA-AVHRR, Thermal anomaly
Map Asia Conference 2004
Map Asia 2004 1.0 Introduction The occurrence of earthquakes, their cause, attempts at prediction and management of aftermath is probably the most intriguing research to natural calamity researchers. Attempts to predict have been made since time memorial but without much success. If some prediction seemed feasible to some workers, other workers later turned it down when they proved to have loopholes. But, nevertheless, attempts continued. Remote Sensing technology has been an unbiased monitor of the earth’s surface. Now, with thermal remote sensing, monitoring the thermal emissivity of the earth’s surface has also become possible. Land surface temperature (LST) calculated with the aid of thermal bands in sensors like Advanced Very High Resolution Radiometer (AVHRR) on board National Oceanic and Atmospheric Administration (NOAA) and Moderate Resolution Imaging Spectroradiometer (MODIS) on board satellites Terra and Aqua, and other thermal Infrared sensors. These sensors record emissivity data from the earth’s surface only through areas of clear sky, since infrared radiation does not penetrate clouds. The passive microwave radiometer, Special Sensor Microwave Imager (SSM/I) has the advantage of being more transparent to clouds and has an all weather advantage to sense the thermal emission of the earth’s surface. Three earthquakes were analyzed using NOAA-AVHRR datasets in India, Algeria and Iran. LST calculated using the thermal infrared data from NOAA-AVHRR data gives the thermal emissivity of earth’s surface at any time. The presence of thermal anomalies in regions around the earthquake epicenter prior to the earthquakes was observed in all these earthquakes. The anomalies disappeared along with the earthquakes (Saraf and Choudhury, 2003, 2004 (a) and (b)). Further, SSM/I datasets were used to analyze seven earthquakes around the world, including the Bhuj Earthquake in India. 2.0
Bhuj Earthquake, Gujarat, India: The powerful Bhuj Earthquake struck Gujarat on 26 January 2001, at 03:16 (UTC)
with a USGS magnitude of 7.7 (Mw) and left 20,083 people dead, 166,836 injured, approximately 339,000 buildings destroyed and 783,000 damaged in the Bhuj-AhmedabadRajkot area and other parts of Gujarat. The location of the epicenter was at 23.40°N latitude and 70.31°E longitude, near Bhuj in the state of Gujarat. The earthquake originated at a shallow depth of 16 km. The worst hit places were Bhuj, Anjar, Bhachau and Rapar, which 2 Map Asia Conference 2004
Map Asia 2004 faced near total destruction and Gandhidham, Morvi, Rajkot and Jamnagar faced extensive damages to concrete structures (Saraf and Choudhury, 2004 (b)). The epicentral area lies in a tectonically active region wherein the faults - Alla Bund Fault, the Katrol Hill Fault, the Kutch Mainland Fault, the Adhoi Fault, the Banni Fault and the Island Belt Fault embracing important places like Bhachau, Samakhiali, Rapar, Manfara, Chobari, Trambau, Vondh and Bhimasar are located. These faults have history of periodic earth movements from time to time (Saraf and Choudhury, 2004 (b)). The earthquake is the result of an east west thrusting attributed by stresses due to the Indian plate pushing northward into the Eurasian plate. However, no surface rupture was observed after this earthquake. 2.1
Data used: Evening time AVHRR satellite data, trying best to keep a consistency in time,
consisting of pre- and post- earthquake scenes from NOAA were analyzed for three months beginning from December 1999 to February 2001. For the year 2003, NOAA-AVHRR datasets of the same period as of 2001 from the Indian Institute of Technology RoorkeeSatellite Earth Station (IITR-SES) were used to compare the analyses of the year 2001 and to create a background thermal regime of the area. The data of the year 2002 would have made a better comparison, but cloudiness hindered the land surface temperature estimation of the year 2002 around the same time. Thermal channel 4 of NOAA-AVHRR satellite data was used to calculate the LST of the
study
area.
The
LST
calculation
is
based
on
the
method
provided
in
http://perigee.ncdc.noaa.gov/docs/podug/html/c1/sec1-410.htm. User specified temperature range of -40°C to 35°C was used and temperature outside this range was masked. Cloud cover was delineated and avoided. AVHRR has a spatial resolution of 1.1 km and a temperature resolution of 0.12-0.5°C. Weekly average temperature data for a period from 1951 to 1980 (which was the only available past data) of the month of January were obtained from six IMD (India Meteorological Department) stations. Further weekly average temperature data of fourteen IMD stations of the same month for the year 2001 were also obtained. The above two weekly average temperature data sets were analyzed and the trend 3 Map Asia Conference 2004
Map Asia 2004 of weekly variation of temperature for the period in which the earthquake occurred was obtained. 2.2 Observations: Pre- and post- LST data images when studied revealed a positive thermal buildup on 14 January 2001 in southwest Gujarat with respect to the surrounding. This rise in temperature spread in a few days in a northwest – southeast direction. The temperature increased to a maximum on 23 January 2001, just three days before the earthquake hit Gujarat (figure 1). On this day the LST was seen to be 28ºC - 31ºC. This rise in temperature was about 5-7ºC higher than the usual temperature of the region. After this boost the temperature started to drop. After the earthquake on 26 January 2001, the temperature of the region was about 24ºC and was seen to be in accordance with the surrounding and the usual temperature of the region. 25°N
23 Jan. 01
23 Jan. 03 25°N
70°E
70°E
(a) Thermal Anomaly before the 26 January 2001 Earthquake
(b) A normal temperature regime on the same day in the year 2003 over Gujarat
30°C 20°C 10°C 0°C -10°C -20°C -30°C
Gujrat Earthquake Epicenter
Figure 1: (a) Thermal Anomaly on 23 January 2001, prior to the earthquake on 26 January 2001 in Bhuj, India and (b) Normal Temperature on 23 January 2003. 4 Map Asia Conference 2004
Map Asia 2004 To ascertain that this rise was due to the earthquake on 26 January, the trend of the available weekly average temperature data (1951-1980) was analyzed. Using this weekly average maximum/minimum data as a base, the average weekly temperature for the period from December 1999 to February 2001 (3 months) was compared.
The base period trend
shows that in the third week of the year, the temperature plot touches the lowest temperature as compared to second and fourth weeks of the years between 1951 and 1980. But in the year 2001, there was a peak of temperature increase in the third week (figure 2). This is in contrary to the observed trend for the past thirty years. This ground observation is in accord with the observed satellite thermal detection during January 2001. Further, the LST map of the year 2003 of the same region shows a completely normal pattern of temperature with no sudden rise as observed in the year 2001. 3.0
Boumerdes Earthquake, Algeria:
A powerful shallow focus earthquake of magnitude 6.8 (Mw) hit Algeria on 21 May 2003 at 18:44 (UTC) which led to the death of 2,276 lives, injured more than 11, 000 people and left 2,00,000 people homeless. This earthquake was accompanied by a series of aftershocks ranging in magnitude from 5.7 to 2.4 (Mw), in and around the epicenter in Boumerdes in Algeria, which continued till 28 May 2003. Just after the main shock a 5.7 Mw magnitude earthquake occurred at 18:51 (UTC) epicenter at 36.97°N latitude and 3.85°E longitude, originating at a depth of 10 km. The epicenter of the main shock was located at 36.90°N longitude and 3.71°E latitude, just offshore from the locality of Zemmouri in the province of Boumerdes, and about 60 km ENE of the capital city of Algiers. The province of Boumerdes, including the coastal city of Boumerdes, Zemmouri, Thenia, Rouiba, Belouizdad, and Reghaia and the eastern district of Algiers are among the heavily damaged regions by this earthquake (Saraf and Choudhury, 2004 (a)). Northern Africa is tectonically very active. The coastline of Algeria along the Mediterranean Sea is the plate boundary between the African plate and the Eurasian continental plate. The African plate is moving towards the Eurasian plate at a rate of about 6 mm per year. This results in a compressional force, which manifests itself as a series of thrust faulting and normal faulting. The east to west running low angle thrusts, namely, the South Atlas Fault (SAF) and the Middle Atlas Fault (MAF) are the best examples of manifestation of such forces. The MAF runs parallel to and lies to the north of the SAF. The 5 Map Asia Conference 2004
Map Asia 2004 upper plate of these thrusts lies to the north. Both these thrusts are parallel to the AfricanEurasian plate boundary.
31
WEEKLY AVERAGE TEMPERATURE VARIATIONS (1951-1980) Surat Junagarh
30.5
Temperature (°C)
30 Vasad Dhari
29.5
Viramgarh
29
28.5 28
2nd Week
25
3rd Week
4th Week
5th Week
WEEKLY AVERAGE TEMPERATURE VARIATION (2001) Dahod
24 23
Temperature (°C)
22 21
Veraval
Bhavnagar
Surat
Porbandar V.V.Nagar Ahmedabad Rajkot
Baroda 20 19
Keshod Bhuj
18 Deesa 17
2nd Week
3rd Week
4th Week
5th Week
Time Period (weeks)
Figure 2: (a) Weekly average meteorological temperature trend in 30 years (1951-1980) shows a usual low in the third week of the year and (b) Weekly average meteorological temperature in the year 2001 shows a high in the third week (when the AVHRR-derived anomaly was observed). 6 Map Asia Conference 2004
Map Asia 2004 3.1 Data used: Nighttime LST maps from 12 May to 5 June 2003 were used for studying the daily thermal scenario over Algeria. Then detailed study was done for a period from 13 May to 30 May 2003 of the region of interest over northern Algeria for any pre- and post-earthquake thermal abnormality. The LST extracted data has been obtained from German Remote Sensing Data Center Products. The generation of LST maps is based on Becker and Li (1990) ’split window’ algorithm, using the channels 4 and 5 and generating a composite map from three daily nighttime NOAA-AVHRR datasets. Thresholds of cloud detection scheme for nighttime LST synthesis maps are based on thermal channels 3, 4 and 5. Use of nighttime images avoids solar heating during the day. Nighttime data also deducts the chances of partial sun illumination. The climate zone in the lower latitude has also been taken into account. Any pixel identified as cloud is excluded from LST calculation. Linear structures and fault systems were located in northern Africa and its possible relation to the earthquake was observed. 3.2
Observations: The LST composite map of the night of 13 May 2003 showed the appearance of a
positive thermal anomaly towards an area south of the Boumerdes earthquake epicenter. This anomaly intensified to a maximum buildup of thermal anomaly on the night of 20 May 2003, covering an approximate area of 91,100 km2. The temperature rose to around 2024ºC, about 5-10ºC higher than the surrounding area. After two main shocks occurred, of magnitudes 6.8 and 5.7(Mw), on 21 May 2003, the anomaly weakened. A less intense anomaly on the night of 21 May 2003 was probably a precursor to an earthquake of magnitude of 5.5 (Mw), which occurred on 22 May 2003 at 3:14 (UTC). The anomaly disappeared on the night of 22 May (figure 3). A weak anomaly again appeared around the same area on the night of 23 May 2003. Clouds, which covered the study area, hampered the study of the development of any anomaly for the 5.8 magnitude earthquake on 27 May. A weak anomaly was again noticed on the night of 28 May (figure 3). An earthquake of magnitude 4.9 rocked Algeria on 29 May (Saraf and Choudhury, 2004 (a)). 7 Map Asia Conference 2004
Map Asia 50 2004
100
150
50
200
100
150
200
450
14-15 May, 03 500
13-14 May, 03
450
17-18 May, 03
18-19 May, 03 500
450
19-20 May, 03
20-21 May, 03 500
450
21-22 May, 03
22-23 May, 03 500
450
26-27 May, 03 500
23-24 May, 03
450
28-29 May, 03 500
27-28 May, 03 0
29-30 May, 03
0
15
500
30 °C
A
1000 km
Figure 3: Time series composite maps of Algeria before and after the earthquake. The temperature was seen to be maximum on 20 May 2003. 8 Map Asia Conference 2004
Map Asia 2004 The location of the thermal anomaly concur with the South Atlas Fault (SAF), which is a thrust running east to west in northern Algeria. The offshore location and shallow depth (10 km) of the epicenter indicates that the focus lies on the thrust plane of the SAF. The coastline of northern Algeria along the Mediterranean Sea is the trace of a plate boundary, in which the African plate is subducted under the Eurasian plate. This compression leads to the generation of a series of thrusts and normal faults in northern Algeria. This SAF, which is a part of such series, may be regarded as the main cause of the main 6.8 magnitude earthquake of 21 May 2003. Further study along with analyzes of meteorological data should help with the confirmation of the phenomenon of thermal anomaly. Unlike the Bhuj earthquake, the meteorological data for the Algeria earthquake could not be obtained. 4.0
Bam Earthquake, Iran: The devastating earthquake in Bam, Iran struck on 26 December 2003 at 01:55 (UTC)
with a magnitude of 6.6 (Mw). The location of the focus was at a depth of 10 km and the epicenter was located at 29.00º N latitude and 58.33º E longitude towards the southeast of Iran, near the city of 2000 years old ancient city of Bam. The earthquake destroyed the mud fortress (Arg-e Bam castle), which was considered to be the largest in the world. The earthquake left 30,000 people dead, 30,000 injured, large-scale damage to concrete structures,
especially
in
Bam
area,
where
an
intensity
of
IX
was
felt
(http://earthquake.usgs.gov/recenteqsww/Quakes/uscvad.htm). The Arabian plate converging towards the Eurasian plate at a rate of about 3 cm/year generates numerous earthquakes in almost entire Iran. This plate motion crates a zone of deformation
that
generates
both
reverse
and
strike-slip
faults
in
the
region
(http://neic.usgs.gov/neis/eq_depot/2003/eq_031226/neic_cvad_ts.html). The 26 December earthquake is generated by right-lateral strike-slip motion on the North-South trending Bam fault. Around the location of the epicenter, several active faults have been mapped. The Gowk fault is oriented along the west of the Bam fault in a similar North-South trend. Reverse strike-slip motion on this fault had generated the 11 June 1981 earthquake of magnitude 7.3 and the 28 July 1981 earthquake of magnitude 7.3. The Bam fault passes from the vicinity of the city of Bam and between the cities of Bam and Baravat. 9 Map Asia Conference 2004
Map Asia 2004 4.1
Data used: For the monitoring for thermal anomalies associated with the Bam earthquake, both
nighttime and daytime data acquired by the IITR-SES were analyzed. The daytime data was acquired around 15:30 hours (IST) and the nighttime data was acquired at around 03:30 hours (IST). Data for around 90 days prior to the earthquake was observed. Similar to the preparation of data for the Bhuj earthquake in Gujarat, India, the LST maps for the Bam earthquake was also calculated using the channel 4 of the NOAA-AVHRR datasets. The method
for
the
calculation
of
the
LST
is
as
mentioned
in
http://perigee.ncdc.noaa.gov/docs/podug/html/c1/sec1-410.htm. For the daytime data a user specified temperature range of –30°C to 35°C was used and temperature outside this range was masked. For the nighttime data, the user specified range was -70°C to 20°C. Cloud covered pixels were delineated and masked. 4.1
Observations: Time series maps of the LST for the period before- and after-earthquake in Bam were
prepared for both nighttime and daytime NOAA-AVHRR datasets. There was definitely a thermal anomaly, which appeared before the devastating earthquake of 26 December 2003, which is evident in both daytime scenes as well as nighttime scenes. The temperature increase was about 5 - 7°C than the usual temperature of the region. At some places, the temperature was about 8 - 10°C higher than normal. In the nighttime scenes on 18 December 2003, there was a complete normal temperature regime in the region. The appearance of the thermal anomaly was seen around the earthquake epicenter near Bam on 21 December 2003 (figure 4). On this day, the LST was seen to be maximum. Clouds appeared over the epicentral area from 19 December to 21 December, and covered the entire region. The estimation of LST during that time from the nighttime data was not possible. If the rise had started earlier and then reached its peak on 21 December, it could not be ascertained. On 22 December, the temperature was less than this boost. The temperature was normal again on 23 December. The earthquake came on 26 Decmeber, three days after this boost in LST.
10 Map Asia Conference 2004
Map Asia 2004
18 Dec 03
35°N
21 Dec 03 35°N
30°N
30°N 60°E
65°E
22 Dec 03
60°E
23 Dec 03
35°N
35°N
30°N
30°N
60°E
35°N
65°E
24 Dec 03
30°N 60°E
65°E
60°E
35°N
65°E
25 Dec 03
26 Dec 2003 Earthquake Epicenter Magnitude: 6.6
30°N 65°E
26 Dec 03 35°N
60°E 35°N
N
65°E
27 Dec 03
-60°C -50°C -40°C -30°C -20°C
30°N
30°N
-10°C 0°C 10°C
60°E
65°E
65°E
70°E
Figure 4: Nighttime series map before and after the earthquake in Bam, Iran on 26 December 2003. The anomaly was seen to be maximum on 21 December 2003. 11 Map Asia Conference 2004
Map Asia 2004 The increase in temperature is more evident in the daytime scenes (figure 5). During daytime the LST is influenced by heat from the sun. Another observation was that the rise in temperature was more evident starting from 22 December 2003 and stayed on till 24 December 2003. The anomaly appeared earlier and faded out earlier in nighttime data than as seen through daytime datasets. On 24 December, the temperature around the entire region and even surrounding the epicenter had a temperature around 8°C - 10°C higher than the normal temperature of the region. The rise in temperature dropped on 26 December, the day when the earthquake occurred. 5.0
SSM/I Sensor Study: SSM/I sensor datasets from the series of DMSP satellites were used to study seven
major past earthquakes around the world in India, China, Turkey, Afghanistan and Pakistan (along with the Bhuj earthquake in India) (table 1). The SSM/I senses in the passive microwave part of the electromagnetic spectrum. The advantage of SSM/I data is that it can penetrate clouds. Table 1: Details of earthquakes studied for pre-earthquake thermal anomaly. S. N. 1 2 3 4
5
6 7
Origin Earthquake Kalat Earthquake, Pakistan Zhangbei Earthquake, China Izmit Earthquake, Turkey Bhuj Earthquake, India Double Earthquakes of Hindukush, Afghanistan Hindukush Earthquake, Afghanistan Southern Xinjiang, China
Location Long Lat (N) (E)
Magnitude (Mw)
Focal Depth (km)
Date
Time (UTC)
04.03.90
19:46:19
28.92
66.33
6.1
10
10.01.98
03:50:41
41.08
114.50
6.2
30
17.08.99
00:01:39
40.74
29.86
7.6
17
26.01.01
03:16:41
23.41
70.23
7.7
16
03.03.02 (Foreshock)
12:08:06
36.44
70.45
6.2
195
03.03.02 (Mainshock)
12.08.22
36.54
70.42
7.4
256
25.03.02
14:56:37
35.97
69.18
6.1
33
24.02.03
02:03:41
39.61
77.24
6.4
11
12 Map Asia Conference 2004
Map Asia 2004
N
22 Dec 03
23 Dec 03
30°N
30°N
25°N
25°N
55°E 55°
60°E
25 Dec 03
30°N
30°N
25°N 55°E
25°N 55°E
60°E
N
26 Dec 03
30°N
60°E 60°
55°E 55°
N
24 Dec 03
N
N
60°E
26 Dec 2003 Earthquake Epicenter Magnitude: 6.6 -20°C -10°C 0°C 10°C 20°C
25°N 55°E
60°E
30°C
Figure 5: Daytime series map before and after the earthquake in Bam, Iran. The anomaly was seen to appear on 22 December 2003 and is seen to be at its peak on 24 December 2003. 13 Map Asia Conference 2004
Map Asia 2004 5.1 Database: The SSM/I is a seven-channeled radiometer, which has become available to various communities since 1987. The DMSP orbit is near circular, sun-synchronous, near polar, with an orbital altitude of 860 km and 1394 km wide swath. The orbital period is 102.4 minutes and provides almost complete coverage of the earth. The SSM/I data provided feasibility of study of earthquakes all over the world because of its global coverage and easy availability. National Climatic and Data Center (NCDC) provide SSM/I Image Products for 11 regions around the world. The temperature product is available as anomalies from the mean climatological values. Anomalies are derived from the 1988 to 2002 base period. For, weekly products, the first week always begins on 01 January, regardless of the day (Sunday, Monday, etc.) the year begins. Composite maps of seven days of satellite observation are prepared as a weekly derivative. For monthly products, the average value of each week is independently derived. The spatial resolution is 30 km for all the products. This is certainly a disadvantage in any remote sensing applications and reduces many atmospheric corrections. The SSM/I data used to study the seven earthquakes were weekly average temperature anomaly data for the study region. The weekly anomaly was calculated with reference to 14 years mean climatological data. The temperature scale, therefore, actually represents thermal difference in degree Celsius with respect to the base period of 14 years. A value of +1 on the temperature scale will represent an increase of temperature of 1°C with respect to the base for that particular week on an average, i.e., the region was 1°C warmer than usual for that particular year with respect to all the 14 years. For analyses of the development of any thermal anomaly for each earthquake, SSM/I weekly data for three months before and after the earthquake were observed. The meteorological conditions of any region and the variation of climate and temperature were also taken into consideration. The active tectonics in the region and the fault systems were also analyzed.
14 Map Asia Conference 2004
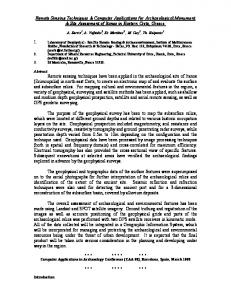
Map Asia 2004 5.2 Observations: All the seven earthquake studies show an increase in land surface temperature (LST) before the devastating earthquakes struck. In most cases the anomalies appeared about a week before the earthquakes and stayed for almost a week. The rise of temperature was seen to be about 7-10°C. The thermal anomalies disappeared with the earthquakes. A comparison of the Hindukush Earthquake of March 25, 2002 of magnitude 6.1 and the Kalat Earthquake of March 4, 1990 of the same magnitude and located in similar tectonic settings gives an interesting observation. These two earthquakes, however, had a difference in depth of focus. It has been observed in these two shallow earthquakes, the earthquake with the deeper focal depth (Hindukush, focal depth = 33km) created a larger thermal anomaly than the earthquake with shallower focus (Kalat, focal depth = 10km) (figure 6).
SSM/I Derived Weekly Surface Temperature Anomaly Maps (Base Period 1988-2002) 55°N 38°N
60°N
55°N
65°N
(a)
N
60°N
65°N
(b)
70°N
75°N
N
34°N
34°N
30°N
26°N
38°N
28°N
19-25 Mar 2002
19-25 Feb 1990 Kalat Earthquake, Pakistan
24°N
Hindukush Earthquake, Afghanistan
04 Mar 1990 Earthquake Epicentre Mag.:6.1 Depth: 10km
Figure 6:
(a) Thermal anomaly prior to the 3 March 2002 earthquake and (b) Thermal
anomaly prior to the 25 March 2002 earthquake. Both these earthquakes have the same magnitude, are located in similar tectonic locations but differ in their depth of focus. 15 Map Asia Conference 2004
Map Asia 2004 In the Bhuj earthquake, the rise of temperature detected in SSM/I anomaly maps was about 4-8°C in the region. The anomaly map of the week starting from 15-21 January 2001 (they are weekly composite maps) shows the maximum difference. Weekly temperature anomaly maps for the 4 March 1990, magnitude 6.1 Kalat earthquake in Pakistan showed the development of a thermal anomaly close to the epicenter area two weeks before the earthquake hit the Kalat region in Pakistan. In the next week, the anomaly intensified to a maximum during 19-25 February 1990 with around 2-10°C difference of temperature than base temperature in the region. The anomaly remained for over a week and occupied a small area as a linear arch around the epicenter. This anomalous rise was seen to disappear in the week from 26 February -4 March 1990, i.e., just before the earthquake. Anomaly for the Zhangbei earthquake appeared almost three weeks before the earthquake. The week beginning from 17 December 1997, started to pick up a thermal anomaly with an increase of temperature of about 1-4°C towards the northeast of the epicenter as compared to the normal temperature of the area. In the next week, beginning from 25 December 1997 an area to the south of the epicenter also showed an increase in temperature of about 4-8°C along with the northeast anomaly. The anomaly intensified to a maximum two weeks before the earthquake (figure 7). This anomaly covered a large area south of the epicenter, which experienced a maximum increase of temperature of about 10°C. The anomaly stayed till the week in which the earthquake occurred and vanished just after the earthquake. The active North Anatolian Fault, similar to the San Andreas Fault in California, generates numerous earthquakes in Turkey. SSM/I derived anomaly maps for the devastating 17 August 1999, magnitude 7.6 Izmit earthquake clearly show an increase in temperature of the region before the deadly earthquake. The anomaly, which started building in the week beginning from 6 August, 1999, was centered on the epicenter, but spread over a vast area over Western Turkey. The anomaly maps of this week show a difference in temperature of 2-6°C in the region. The next week probably with active degassing, witnessed a boost of temperature with an increase of 6-10°C with respect to the base period. This anomaly disappeared right after the 19 August 1999 earthquake and since 20 August 1999 showed similar temperature values as normal. The North Anatolian Fault is a strike slip fault, traversing the northern part of Turkey from east to west and forces the bulk of Turkey lying to the south of the fault to drift to the west for about 1200 km. The anomaly observed in the Xinjiang Earthquake of 24 February 2003 is well situated over and around the epicenter. 16 Map Asia Conference 2004
Map Asia 2004 There was an increase in temperature of about 4-6°C. The rise started between 1-5 days before the earthquake and stayed for not more than a week. SSM/I Derived Weekly Surface Temperature Anomaly Maps (Base Period 1988-2002) 45N 17-24 Dec 1997
10-16 Dec 1997
39N 33N
N
27N
N
21N 105
115
125
25-31 Dec 1997
105 45N
115
125
01-07 Jan 1998
39N 33N
N
27N
N
21N 105
115
125
08-14 Jan 1998
105
115
125
45N 15-21 Jan 1998 39N 33N
N
N
27N 21N
-8°C -6
-4
-2
-1
1
2
4
6
8°C
Jan 10 1998 Earthquake Epicentre Mag.-6.2
Figure 7: Thermal anomaly prior to the Zhangbei earthquake in China on 10 January 1991.
17 Map Asia Conference 2004
Map Asia 2004 6.0 Discussion and Conclusions: The history of the application of thermal remote sensing in natural resources perhaps started in Russia in the nineteen sixties. Thermal data in seismic studies were first used in Russia. Case studies were carried out in Russia, Japan and China. Scientists in China, Russia and Japan observed the occurrence of thermal anomalies (Zu ji et al., 1991, Gorny and Shilin 1992, Tronin, 1996, Zu ji et al., 1999, Tronin, 2000). Zu ji et al. successfully studied and tried to predict a number of earthquakes based on thermal anomalies. Zu Ji et al. (1991) also state that rock breaking tests in laboratories have verified the escape of gases due to subsurface deformation. Infrared emission under action of enormous pressure has also been experimented upon and verified by Ouzounov and Freund (Ouzounov and Freund, 2003). Prior to an earthquake, crustal deformation is due to a stress field. It is a known fact that increases in pressure leads to an increase in temperature. Due to the acting stress field, sub-surface pressure increases with the consequent increase in temperature. Such deviation from normal in the thermal regime can pose to be an interesting observation in earthquake studies. The strengthening of stresses in tectonic regions also results in the production and extension of micro-cracks. The gases trapped in these pores escape and create a localized green house effect and thus create a thermal anomaly in the lower atmosphere. An abnormality in the thermal properties of the near earth’s surface, detected by thermal channels like AVHRR, can prove to be a valuable indicator of an impending earthquake. As successfully demonstrated in the present study, the earthquakes in Bhuj (India), Boumerdes (Algeria), Bam (Iran), Zhangbei and Xinjiang (China), Izmit (Turkey), Hindukush (Afghanistan) and Kalat (Pakistan) were associated with the presence of pre-earthquake thermal anomalies. The anomalies appeared a few days to a few hours before the earthquakes. The increase in temperature ranges between 4-10°C. These anomalies are seen to disappear after the earthquakes. References: 1.
Becker, F. and LI, Z.L., 1990, Towards a local split window method over land surface. Int. J. Remote Sensing, Vol. 11,No. 3, pp. 369-393. 18 Map Asia Conference 2004
Map Asia 2004 2. Gorny, V. I. And B. V. Shilin, 1992, Thermal method of remote sensing for study of natural resources, Proceedings of the 18th Annual Conference of the Remote Sensing Society, 1992, University of Dundee, 15-17th September 1992 (edited by A. P. Cracknell and R. A. Vaughan), pp.245-263. 3.
Ouzonov,
D.,
and
Freund,
F.,
2003,
http://science.nasa.gov/headlines/y2003/11aug_earthquakes.htm 4.
Saraf, A. K., Choudhury, S., 2003, Earthquakes and Thermal Anomalies, Geospatial Today, Vol. 2, No. 2, pp.18-20.
5.
Saraf, A. K., Choudhury, S., 2004 (a), Satellite Detects Surface Thermal Anomalies Associated with the Algerian Earthquakes of May, 2003, International Journal of Remote Sensing (in press).
6.
Saraf, A. K., Choudhury, S., 2004 (b), NOAA-AVHRR detects thermal anomaly associated with 26 January, 2001 Bhuj earthquake, Gujarat, India, International Journal of Remote Sensing (in press).
7.
Tronin, A. A., 1996, Satellite thermal survey-a new tool for the study of seismoactive regions, Int. J. Remote Sensing, Vol. 17, No. 8, pp. 1439-1455.
8.
Tronin, A. A., 2000, Thermal IR satellite sensor data application for earthquake research in China, Int. J. Remote Sensing, Vol. 21, No. 16; pp. 3169-3177.
9.
Zu-ji, Qiang, Xiu-Deng, XU and Chang-Gong, DIAN, 1991, Thermal infrared anomaly – precursor of impending earthquakes, Chinese Science Bulletin, Vol. 36, No. 4; pp. 319-323.
10.
Zu-ji, Qiang, Chang-gong, Dian, Lingzhi, LI, Min, XU, Fengsha GE, Tao, LIU, Yong, ZHAO and Manhong, GUO, 1999, Satellite thermal infrared brightness temperature anomaly image – short-term and impending earthquake precursors, Science in China, Vol. 42, No. 3, pp. 313-324. --------------------------19 Map Asia Conference 2004