by Nathaniel L. Bindoff, Stephen R. Rintoul and Robert Massom ... BINDOFF, NL., RINTOUL, S.R. & MASSOM, R., 2000 (31 :v): Bottom water formation and ...
Papers tendProceedings of the Royal Society of Tasmania, Volume 133(3), 2000
51
BOTTOM WATER FORMATION AND POLYNYAS IN ADEllE LAND, ANTARCTICA by Nathaniel L. Bindoff, Stephen R. Rintoul and Robert Massom (with five text-figures) BINDOFF, NL., RINTOUL, S.R. & MASSOM, R., 2000 (31 :v): Bottom water formation and polynyas in Adelie Land, Antarctica. In Banks, M.R. & Brown, M.J. (Eds): TASMANIAAND THE SOUTHERN OCEAN. Pap. Proc. R. Soc. T asm. 133(3): 51-56. ISSN 0080470). Antarctic CRC, GPO Box 252-80, Hobart, Tasmania, Australia 7001 (NLB, SRR, RM); and CSIRO Division of Marine Research, GPO Box 1538, Hobart, Tasmania, Australia 7001 (SRR). Antarctic B~ttom Water is the coldest and densest water found in the global ocean. It spreads into all the major ocean basins, carrying the cold water towards the equatorial regions, and is a central component of the global thermo-haline circulation. However, the mechanisms of bottom water formation are not well established; its geographical distribution and rate of formation have yet to be fully quantified. Polynyas, which are large persistent openings in sea-ice that form during the winter near the Antarctic Coast, playa central role in the formation or Antarctic Bottom Water. This paper describes the bottom water formation around the Antarctic continental margin with particular emphasis on the processes and mechanisms of the Adelie Land Bottom Water formation near Dumont D'Urville south of Tasmania. Key Words: Antarctic Bottom Water, polynya, brine rejection, Adelie Land Bottom Water.
INTRODUCTION ~
~.
Antarctic Bottom Water (AABW) is one of the most important water-masses in the global ocean. It is the coldest, densest water found in the deep ocean. This water is found in all of the deep basins around the Antarctic continent, broken only by the relatively shallow sill through Drake Passage. Estimates of the volume of AABW (defined by water denser than neutral density - Jackett & McDougall 1997 [yn> 28.27 kg.m-3]) show it to occupy 3.5% of the volume of the ocean (Orsi et al. 1999) and affect, through mixing and advection, more than 41 % of the global oceanic volume (Worthington 1981). Estimates of the production rate of bottom water vary but range from 8-12 Sv (Orsi et al. 1999 [1 Sv=106 m 3.s- 1]), giving a renewal time (defined here as the volume occupied by AABW divided by production rate) of 180-120 years, respectively. This renewal time is quite long, reflecting the fact that the production rate is small compared with the volume of the ocean occupied by AABW. Yet it is this production rate combined with the relatively low mixing rates which creates the strong density gradients that define the Antarctic Circumpolar Current. The main formation of AABW is thought to occur in three distinct regions, on the continental shelves of the western Weddell Sea, western Ross Sea and Adelie Land, south of Tasmania. The Adelie Land source of bottom water has always been considered to be negligible (Carmack 1977) compared with the Weddell and Ross Sea sources. However, recent analyses of the volume of the AABW characteristic of these three source regions show that the Weddell, Adelie and Ross sources are respectively 68%, 24% and 8% by volume (Rintoul 1998), that is Adelie Land Bottom Water (ADLBW) is the second largest source. This new result is also supported by a census of Chlorofluorocarbon (CFC-ll) concentrations around the Antarctic continent (Orsi et al. 1999), which shows that layer of AABW defined by the CFC-ll is thicker in the
Australian-Antarctic basin than in either the Weddell or Ross Seas. Bottom waters are an important part of the thermohaline circulation, and increased greenhouse gas scenarios from coupled-ocean-atmosphere models show that the rate of bottom water formation is expected to decrease (Manabe et al. 1990, Manabe et al. 1991). It is important that these model scenarios are validated with observations. In this paper the geographical distribution of ADLBW in the Australian-Antarctic basin, evidence for its time variability of formation and its links to the Mertz Polynya are described.
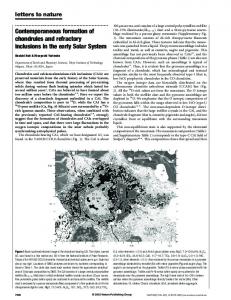
BOTTOM WATERS IN THE AUSTRALIAN-ANTARCTIC BASIN Describing the precise distribution of bottom waters and estimating their production are essential requirements for understanding the mechanisms and sources of bottom water formation. The CFC-ll concentration at 10 m above the ocean floor (fig. 1) is taken from hydrographic data obtained on a voyage of the RSV Aurora Australis from JanuaryMarch 1996 (see Bindoff et al. 1997 and Rosenberg et al. 1997 for a more complete description of this voyage). These CFC-ll measurements are accurate to ~ 1% (WOCE standard). Although the source ofCFC-ll in the atmosphere is increasing, the rate of increase from 1990 to 1996 is just 6% or about 1% per year (Gras et aL 1999). Thus, for the relatively young waters directly above the ocean floor and the shelf waters presented here « 10 years old) there is no need to adjust the CFC-ll values to allow for the time variation in the atmospheric source, and for these data this adjustment is small compared to the effects of mixing. The CFC-ll Chloro-fluorocarbons are transferred from the atmosphere to the oceans through the surface of the ocean. Because CFCs are chemically passive in the ocean, they act as a tracer or dye. The highest concentrations (to first order)
NL. Bindoff ,S,R. Rintoul and R. Massom
52
Bottom CFC11 (pm/kg)
62
63
64
66
67
6~0
90
100
110
120
130
140
150
160
Longitude °E
FIG. 1 -~ The CFC11 concentration (pmollkg) taken from the deepest water sample (typically 10 m from bottom) for all eTD stations over the deep ocean. The numbers are the observed CFC-11 concentration at each CTD. The size of the circle gives the amplitude of'the CFC11 concentration. The 1000 and 3000 m depth contours are shown. These data come from the MARGINEX experiment (Bindoffet al. 1997), obtained in January-March 1996. The thick dashed contours show the ice shelves in this region.
can be interpreted here as waters that have been most recently in contact with the atmosphere. Each of the northsouth hydrographic sections (except at 150 0E) cross the continental shelfbreak shown by the 500 m isobath. On the shelf floor, very high CFC-ll concentrations of greater than 4 pmol.kg- 1 occur, consistent with the moderately rapid overturning of the shelf waters and mixing with the atmosphere. However, these concentrations decrease very rapidly down the continental slope. In the deep ocean, the lowest deep-water CFC-ll concentrations occur in the west (along 80 0E) with concentrations less than 1 pmol.kg- 1, and these concentrations progressively increase eastward until a local maximum in CFC-ll concentration occurs at 1400E. At 150 0E the CFC-1 I concentration decreases again. These lower CFC-l1 concentrations are also accompanied by higher salinities and warmer temperatures, consistent with this water originating from the Ross Sea and flowing westwards along the continental rise (Gordon & Tchernia 1972). The increase in CFC-11 at 1400E also accompanies water that is colder, fresher and more oxygen-rich, implying that the bottom waters at 1400E have been mixed with more recently ventilated water originating from the continental shelf somewhere between 140° and 150 0E. Excluding the large values of CFC-11 over the continental shelf! slope break (less than 1000 m), all of the north-south sections show the highest values of CFC-11 (and also the coldest, freshest and highest in oxygen) offshore in waters deeper than 3000 m (fig. 1). Although it appears from these data that the source must be between 140° and 150 0E, it is clear that during the summer time there is not a continuous plume of high CFC (cold and fresh and
dense) water flowing downslope in either of these two sections. This suggests that the source waters are flowing down the continental slope during the winter or between the two sections or in discrete canyons on the continental slope (Rintoul 1998). The seasonal variability of bottom water formation is poorly known because the extensive sea-ice cover during winter makes the continental slope and shelf region largely inaccessible to conventional ship-based measurements. However, temperature measurements from 10 m above the ocean bottom from a mooring at 65°S, 1400E in 2600 m of water show a distinctive seasonal signal. The warmest temperatures occur during the February-June period and the strongest cooling in the August-December period (Fukamachi, pers. comm.); this is consistent with the strongest formation being during the late winter-spring. In addition, the temperature and salinity characteristics of shelf waters during the January-March 1996 voyage of the RV Aurora Australis show that the shelf salinities (fig. 2A) are too fresh to form bottom waters, supporting the conclusions from the moored temperature measurements. Although the Ross Sea Bottom Water (RSBW) has distinctive temperature and salinity characteristics present at 150 0E, there is no evidence for this signature at 128°E (fig. 2A), where the bottom waters are colder and fresher (labelled as ADLBW). Here, the temperature-salinity correlation for waters < O°C forms a straight line that is noise free (fig. 2A). The shelf waters have a temperature near the surface freezing temperature (-1.85°C) and a salinity less than 34.5 psu. For this section there is no simple two-end member mixing scheme between the
Bottom water formation and polyn,yas in Antarctica summer shdf waters with the Modified Circumpolar Deep Water (labelled MCDW) and the ADLBW. By contrast, the CF C-temperature correlation shows a different relationshi? between the shelf water andADLBW (fig. 2B). The she1fVlaters ar(-1.85°C), the MCDW and the bottom waters (