Bioinformatics Advance Access published December 6, 2011
BPDA2d — A 2D global optimization based Bayesian peptide detection algorithm for LC-MS Youting Sun 1 , Jianqiu Zhang 2∗, Ulisses Braga-Neto 1 and Edward R. Dougherty 1,3,4† 1
Department of Electrical Engineering, Texas A&M University, College Station, TX 77843 Department of Electrical Engineering, University of Texas at San Antonio, San Antonio, TX 78249 3 Computational Biology Division, Translational Genomics Research Institution, Phoenix, AZ 85004 4 Department of Bioinformatics and Computational Biology, University of Texas M.D. Anderson Cancer Center, Houston, TX 77030 2
ABSTRACT Motivation: Peptide detection is a crucial step in mass spectrometry (MS) based proteomics. Most existing algorithms are based upon greedy isotope template matching and thus may be prone to error propagation and ineffective to detect overlapping peptides. In addition, existing algorithms usually work at different charge states separately, isolating useful information that can be drawn from other charge states, which may lead to poor detection of low abundance peptides. Results: BPDA2d models spectra as a mixture of candidate peptide signals and systematically evaluates all possible combinations of possible peptide candidates to interpret the given spectra. For each candidate, BPDA2d takes into account its elution profile, charge state distribution, and isotope pattern, and it combines all evidence to infer the candidate’s signal and existence probability. By piecing all evidence together — especially by deriving information across charge states — low abundance peptides can be better identified and peptide detection rates can be improved. Instead of local template matching, BPDA2d performs global optimization for all candidates and systematically optimizes their signals. Since BPDA2d looks for the optimal among all possible interpretations of the given spectra, it has the capability in handling complex spectra where features overlap. BPDA2d estimates the posterior existence probability of detected peptides, which can be directly used for probability-based evaluation in subsequent processing steps. Our experiments indicate that BPDA2d outperforms state-of-the-art detection methods on both simulated data and real LC-MS data, according to sensitivity and detection accuracy. Availability: The BPDA2d software package is available at http://gsp.tamu.edu/Publications/supplementary/sun11a/ Contact:
[email protected],
[email protected]
∗ to
whom correspondence should be addressed
† to
whom correspondence should be addressed
1
INTRODUCTION
Liquid chromatography coupled to mass spectrometry (LC-MS) is widely used for large-scale protein profiling of complex biological samples. In a typical LC-MS experiment, peptides from digested protein mixture go through an LC column with different speeds depending on their physicochemical properties. Eluent from the chromatography is ionized and analyzed by mass spectrometer which measures ions according to their mass-to-charge (m/z) ratios. The resulting LC-MS data set usually contains hundreds to thousands of mass spectra indexed by the LC retention time. Analysis of LC-MS experiments by computational methods is challenged by the huge data size and rich information contained, and moreover complicated by several facts including: (1) Proteins contained in complex samples such as plasma and tissue extracts have a wide dynamic concentration range (e.g. 10 orders of magnitude), plus peptides differ in ionization efficiencies, which means that the observed peptide signal from MS data may also have a wide dynamic range. While high abundance peptides are relatively easy to be identified, low abundance peptides/proteins, which are often of more biological importance, are likely to be buried under noise or interfering signals and thus hard to be detected (Li et al., 2005). (2) The shape of peptide chromatographic peaks is not well predicted (Schulz-Trieglaff et al., 2008). Due to experiment settings and the nature of the analytes, asymmetric shape or plateaus of chromatographic peaks may be observed, which requires designed detection algorithms to be robust in tracking signals from various peptide species and be adaptable across experiments. (3) One peptide can be multiply charged and can register a group of isotopic peaks at each charge state. Correctly identifying all the peaks and assigning them to the right peptide is a non-trivial task. (4) The signal density can be very high even in high-resolution LC-MS data and overlapping peptide peaks are commonly observed, the detection of which is very challenging. Accurate identification and quantification of proteins is essential for biomarker discovery, drug development and disease classification (Frank et al., 2003). Fragmentation spectra produced by tandem mass spectrometry (MS2) are frequently used by popular software such as SEQUEST and Mascot (Perkins et al., 1999) for database
© The Author (2011). Published by Oxford University Press. All rights reserved. For Permissions, please email:
[email protected]
1
Downloaded from http://bioinformatics.oxfordjournals.org/ at University of Texas at San Antonio on December 9, 2011
Associate Editor: Prof. John Quackenbush
2
spectra interpretation, and to optimize all peptide signals in order to minimize the mean squared error (MSE) between inferred and observed spectra. The outputs include peptide monoisotopic mass, retention time (RT), abundance, existence probability, etc. BPDA2d essentially differs from BPDA by explicitly exploiting information residing in the RT dimension to analyze spectra and detect peptides. While BPDA only models peptide signals along the m/z dimension, BPDA2d models the spectra from both m/z and RT dimensions, thereby capturing and fitting the properties of LC-MS data better. BPDA2d offers following advantages over conventional methods: (i) BPDA2d carries out global optimization instead of local template matching. It is “global” in two senses: First, for the detection of one peptide candidate, BPDA2d extracts all relevant information and observations (including isotopic peaks, charge state distributions and LC elution peaks) that span all over the m/zRT space, and pieces all evidence together to infer the candidate’s existence probability. As a result, low abundance peptides can be better identified. In contrast, existing algorithms often perform peptide deisotoping at a single charge state (Katajamaa et al., 2005; Li et al., 2005; Bellew et al., 2006; Mueller et al., 2007; Hoopmann et al., 2007; Sturm et al., 2008; Jaitly et al., 2009), isolating useful information that can be drawn from other charge states. While high abundance charge states may be correctly detected, low abundance charge states might be missed or wrongly assigned, rendering low sensitivity results in peptide identification and inaccuracy in peptide quantification. Additional benefits of collating all charge states are discussed in (Dijkstra et al., 2009) (though their method requires the peak clusters at various charge states to have a moderate correlation, and thus may not work efficiently if the shape of the peak cluster at any charge state differs from other charge states due to the presence of interfering peptides.) Second, BPDA2d performs global optimization for all candidates and simultaneously finds their best fitting signals. Since BPDA2d looks for the optimal among all possible interpretations of the MS spectra, the procedure is thus systematic. In contrast, greedy template-matching based methods detect peptides one by one in a greedy manner, which prevents them from evaluating all potential interpretations of the given spectra and may lead to poor detection of overlapping peptides (See Results section). Therefore, the results are often suboptimal. (ii) BPDA2d provides existence probabilities for all the candidates considered, as opposed to the fitting scores generally provided by greedy template-matching methods. The metrics used for fitting score calculation may be heuristic (e.g. KL distance (Bellew et al., 2006)). In addition, the range of the fitting score may vary from experiment to experiment, making it hard for the end user to interpret and to select a proper threshold to filter out low quality features. On the contrary, existence probabilities given by BPDA2d are derived based on a solid statistical framework and can be directly used for probability-based evaluation — similar to PeptideProphet (Keller et al., 2002) which is a popular software used for LC-MS/MS peptide identification. (iii) BPDA2d makes little assumptions about the shape of m/z or elution peaks. A non-parametric approach is used to model peptide elution peaks and the model is derived from observations as opposed to employing any pre-assumed peak shape as in (Leptos et al., 2006; Sturm et al., 2008). Therefore, BPDA2d is more effective in tracking signals from various peptide species and more adaptable across experiments.
Downloaded from http://bioinformatics.oxfordjournals.org/ at University of Texas at San Antonio on December 9, 2011
searching to give peptide identifications. However only a small percentage of peptides present in the sample get selected for fragmentation analysis and of these selected peptides even fewer can be correctly identified by database searching due to spectra matching ambiguity or co-eluting precursor ions (Nesvizhskii et al., 2006). Furthermore, quantitation of peptide abundance based on MS2 spectra counting is very rough, and highly variable especially for low abundance peptides (Bantscheff et al., 2007). (Though by using well established stable isotope labeling approaches such as tandem mass tags, the relative abundance of analytes in different samples can be accurately determined (Domon et al., 2006).) Therefore many algorithms for peptide detection are developed to use MS1 information directly, and thus have the potential to identify more peptides. Such algorithms can be mainly divided into two categories: one-dimensional (1D) algorithms (e.g. NITPICK (Renard et al., 2008), Decon2LS (Jaitly et al., 2009), Hardkl¨or (Hoopmann et al., 2007), and BPDA (Sun et al., 2010)) which perform peak picking, deisotoping and charge state assignment on a scan-to-scan basis, and two-dimensional (2D) algorithms (e.g. MZmine (Katajamaa et al., 2005), SpecArray Li et al. (2005), msInspect (Bellew et al., 2006), SuperHirn (Mueller et al., 2007), VIPER (Monroe et al., 2007), MaxQuant (Cox et al., 2008), and OpenMS (Sturm et al., 2008)) which capture the 2D nature of LCMS data and utilize information from both the mass-to-charge and retention-time (RT) dimensions for peptide detection. 2D algorithms appear to be more promising in handling LC-MS data. Regardless of category, most of the aforementioned algorithms are grounded on the idea of greedy template matching. The templates used are often based on theoretic isotope patterns calculated from peptide masses (Rockwood et al., 1995). If an observed group of peaks matches the proposed template well — the quality of the match is usually assessed by a fitting score — it will be reported as a feature and then subtracted from the spectra. The matching and subtraction process goes on until no more matches can be found. The major problem with greedy template matching is that it may be ineffective to detect overlapping peptides. In the case of overlapping (e.g. one doubly charged peptide can overlap with a singly charged peptide of half the mass given that the two elute from chromatography at a similar time), if the peak group of one peptide is incorrectly matched and subtracted, the rest of the overlapping peptides cannot be detected correctly using the remaining signal, which may result in error propagation. Besides, each template is aimed at matching isotopic peaks of one single peptide, and thus are likely to be different from the observed overlapping peaks, which renders a poor match and reduces the sensitivities of these algorithms. Alternatives to greedy template matching based approaches include 1D algorithms such as NITPICK, which is based on LARS regression; Hardkl¨or, which approximates an isotope peak cluster by a set of averagine models (Senko et al., 1995); and BPDA, which carries out global optimization instead of sequential template matching. They also include 2D algorithms such as MaxQuant, which mainly relies on the distance among isotope peaks and the correlation between isotope labeled (SILAC) pairs to detect and quantify peptides in SILAC-proteome experiments. We present BPDA2d, a 2D Bayesian peptide detection algorithm and an extension of BPDA, to process high-resolution LC-MS data more efficiently. BPDA2d shares the core idea with BPDA, which is to systematically evaluate all possible combinations of peptide candidates (originated from well-defined signal peaks) for
(iv) Most parameters in the proposed method possess a clear physical meaning as they come directly from observations of the mass spectra. In contrast, many other approaches require selection of numerous nonintuitive parameters, such as wavelet functions and coefficients (Morris et al., 2005).
{mass | mass = i(d − mpc ) − j mnt ,
2 METHODS
Spectra preprocessing and obtaining peptide candidates
Non-flat baselines are often observed in mass spectra. Their presence can distort the true signal pattern. Thus, the baseline of each MS scan is first identified as the running minima along the m/z axis using a window size of 4 Dalton (a tunable parameter), and subtracted from the scan. Then each scan is smoothed by the LOWESS regression method (Matlab mslowess function http://www.mathworks.com/help/toolbox/bioinfo/ref/mslowess.html) with Gaussian kernel and a span of 9 consecutive points. The next step is 1D peak detection along the m/z axis. We followed the approach implemented in the Matlab mspeaks function http://www.mathworks.com/access/helpdesk/help/toolbox/bioinfo/ref /mspeaks.html. Specifically, in each smoothed MS scan, local maxima are first identified as putative peak locations. Then peaks are filtered based on their intensities and signal to noise ratios (defined as the local maximum divided by the minimum of the two neighboring local minima), and peaks that are too close to each other (might occur due to over segmentation) are joined into a single one. The thresholds used for intensity and over-segmentation filters, τintn and τseg , respectively, are automatically determined depending on the characteristic of each input MS scan as below: τintn = mean(intn) + sd(intn), τseg = min(
200 , 7 × lower 10% quantile of the space resolution
between neighboring m/z values). And the SNR threshold is a tunable parameter with default value 3. Next, the detected 1D peaks in adjacent spectra are connected along the RT dimension: 1D peaks are first sorted by their centroid m/z positions, and then divided into non-overlapping groups, in which the maximal m/z distance between two 1D peaks is less than twice the smallest m/z in the group times ∆m (a user defined mass error in ppm). For each group, the peaks are then sorted/connected according to their RT positions (if multiple peaks have the same RT, only the one with the largest intensity is retained). Next, the connected 1D peaks are split at RT gaps (a tunable parameter), and the resulting so called elution peaks are smoothed by the LOWESS regression method with a ±3 scan width. The elution peaks could be multimodal, which may for instance be produced by two different peptides with partially overlapping elution peaks, or by isomers with variant posttranslational modifications and thus different retention times. Multimodal elution peaks are split at local minima. A point is identified as a local minima/maxima if it is preceded by a local maxima/minima and is followed by a value lower/greater by 15% (the threshold is a user tunable parameter which should be comparable to the random intensity fluctuations of the instrument). Consequently all elution peaks are now unimodal, which will be used to propose a list of peptide candidates in the next step. For each elution peak, its centroid position in the m/z axis is estimated as the average of the m/z values of the connected 1D peaks weighted by their intensities. This
(1)
i = 1, 2, . . . , cs, j = 0, 1, . . . , iso}, where mass is the mass of such a candidate, mpc is the mass of one positive charge and mnt is the mass shift caused by addition of one neutron. Due to mass defect, the mass shift varies for different elements. We approximate mnt using the mass shift from 13 C to 12 C, which is 1.0034, since Carbon contributes most to the isotope patterns. But mnt is a user accessible parameter whose value can be changed as needed. The parameters cs and iso are user defined maximal numbers of considered charge states and isotopic positions, respectively. (2) The shapes of such candidates’ elution peaks should resemble the aforementioned elution peak with centroid d (hereafter referred to as the “ source” elution peak). But in the presence of scan noise, missing values or overlapping peptide signals, the actual shapes of candidates’ elution peaks can be quite different from the observed shape of the source peak. Thus, in order to estimate candidates’ elution peaks more accurately, other elution peaks which can be produced by such candidates need to be taken into account. In more detail, assume the source elution peak has given rise to a candidate with mass value massk taken from the set defined in Eq. 1. Then, theoretically, this candidate can generate a set of elution peaks with centroids given by αk,ij =
massk + i mpc + j mnt , i
(2)
i = 1, 2, . . . , cs, j = 0, 1, . . . , iso, where αk,ij is the theoretic centroid (m/z value) of the elution peak generated by candidate massk at charge state i and isotopic number j. In theory, the set of elution peaks generated by this very candidate should have the same shape (up to a multiplicative constant). Therefore, we search in the previous detected elution peaks for those whose centroids are coincident with the values given by Eq 2 (within ∆m ) and have correlation larger than 0.6 with the source elution peak, since these elution peaks can serve as extra evidence to infer the candidate’s real elution peak. Finally the candidate’s elution peak is estimated by taking the average of all identified elution peaks weighted by the mean intensity of each elution peak involved in the calculation. The candidate’s elution profile is then obtained by normalizing its elution peak by the apex, and the corresponding RT of the apex is taken as the candidate’s retention time. It is worth to mention that we do not assume any particular shape for candidates’ elution profiles, but instead estimate them from relevant observations. Due to heterogeneity of peptides and fluctuations in liquid chromatography, this approach is more robust in the presence of noise and more adaptable across analysis platforms compared to using any pre-defined model (Leptos et al., 2006; Sturm et al., 2008). As can be seen from Eq. 1, each detected elution peak gives rise to cs × (iso + 1) different peptide candidates whose elution profiles have been estimated in the previous step, but it does not follow that all these candidates really exist in the sample. Therefore, our primary goal in peptide detection is to find the existence probability of each peptide candidate. Also note that the total number of candidates should be less than or equal to cs × (iso + 1) × (number of detected elution peaks), as it is possible that multiple elution peaks yield the same candidate. It is worth to mention that the way candidates are generated in BPDA2d is fundamentally different from that in BPDA, as additional information carried by elution peaks is utilized. Candidates are now associated with elution profiles in addition to mass values.
3
Downloaded from http://bioinformatics.oxfordjournals.org/ at University of Texas at San Antonio on December 9, 2011
We first preprocess the spectra to remove baseline, filter noise, detect peaks in the m/z-RT plane, and generate a list of peptide candidates annotated by mass and RT. Then BPDA2d is applied based on the developed MS model to infer the best fitting peptide signals of observed spectra, the results being peptide monoisotopic mass, RT, abundance, existence probability, etc. Details of preprocessing steps, proposed MS model, and BPDA2d algorithm are described in the following subsections.
2.1
method enables very accurate mass estimation, as reported by (Cox et al., 2008). Now, considering one elution peak with centroid at m/z value d, we want to find out which peptide candidates can potentially produce this signal peak. At least two conditions need to be satisfied. (1) The masses of such peptides should be restricted to the following set:
2.2 Modeling the mass spectra We propose a complete model to capture the specific properties of peptides and mass spectra over the entire m/z-RT plane. Suppose N peptide candidates are obtained from the observed spectra using methods described in the previous section. Each candidate can generate a series of elution peaks over different charge states, and at each charge state several isotopic peaks can be registered. Hence, the signal generated by the k-th peptide candidate is modeled by Eq. 3, in which i and j represent the charge state and the isotopic position of the candidate, respectively, and the baseline removed and smoothed spectra (see the previous section for details) are a mixture of signals generated by N peptide candidates plus Gaussian random noise, which are modeled by Eq. 4: =
cs ∑ iso ∑
ck,ij lk (t)Ixm =αk,ij ,
(3)
i=1 j=0
y(xm , t)
=
N ∑
• Sample the apex vector ck , [ck,ij ; i = 1, . . . , cs, j = λk gk (xm , t) + ϵ(t)
k=1
=
N ∑ k=1
m
=
λk
cs ∑ iso ∑
ck,ij lk (t)Ixm =αk,ij + ϵ(t), (4)
i=1 j=0
1, 2, . . . , M, t = 1, 2, . . . , T.
In the above two equations, xm is the m-th mass-to-charge ratio in ∪ the signal region, i.e., xm ∈ {m/z values of detected elution peaks} {m/z values of all candidates’ theoretic peaks }, t indexes spectra, M and T are the total number of m/z values and spectra, respectively, y(xm , t) represents the intensity at point (xm ,t), I is an indicator function, IA = 1 if A ̸= ∅, IA = 0 otherwise, and the noise term ϵ(t) follows a Gaussian distribution with zero mean and standard deviation σ(t), which is generally a good model for thermal noise in electrical instruments. The value of σ(t) can be approximated by the standard deviation of the background region in the t-th scan. The parameters of the kth candidate, namely, αk,ij , lk (t), λk and ck,ij are discussed in detail below:
• αk,ij is the theoretic centroid position (in the m/z axis) of the elution peak generated by candidate k, at charge state i and isotopic number j, the value of which is given by Eq. 2.
• lk (t) is the normalized elution profile of the k-th peptide candidate, which is already obtained in previous section.
• λk is an indicator random variable, which is 1 if the kth peptide candidate truly exists in the sample and 0 otherwise.
• ck,ij is the apex intensity of the elution peak generated by peptide k, at charge state i and isotopic number j. In summary, the model considers peptides’ elution peaks at different isotopic positions and charge states simultaneously, incorporating candidates’ existence probabilities and spectra thermal noise.
2.3
Bayesian peptide detection
Let θ , {λk , ck,ij ; k = 1, . . . , N, i = 1, . . . , cs, j = 0, . . . , iso} be the set of all unknown model parameters. The goal of our algorithm is to determine the value of θ based on the observed spectra vector y = [y(xm , t); m = 1, 2, . . . , M, t = 1, 2, . . . , T ]T . The λk values are of our prime interest in the peptide detection problem. For this purpose, we can use a Bayesian approach to first obtain the a posteriori probability (APP) of all the parameters, P (θ|y). Then the APPs P (λk |y), k = 1, . . . , N, can be obtained by integrating the joint posterior distribution P (θ|y) over all parameters except λk . Clearly, the calculation involves intricate high dimension integration. Besides, due to the highly nonlinear nature of the data model, none of these desired APPs can be obtained analytically. To overcome the computational obstacle, we resort to the Gibbs sampling
4
0, . . . , iso]T for the kth candidate Apexes of all possible elution peaks (over different charge states and isotopic positions) of the kth peptide candidate are included in ck and are sampled simultaneously from the conditional posterior distribution of ck , which, by the Bayesian principle, is proportional to the likelihood times the prior: P (ck y, θ−ck ) ∝ P (y|θ)P (ck ), (5)
where θ−ck , θ \ ck . Derivations of the likelihood, the prior distribution (which makes use of the Averagine model (Senko et al., 1995)) and the conditional posterior distribution of ck are given in the supplementary file.
• Sample the peptide existence indicator variable λk The conditional posterior distribution of λk is given by P (λk |y, θs −λk )
∝
p(y |θ )p(λk )
(6)
where θ−λk , θ \ λk . Absent prior knowledge about which peptide candidates are more likely to be present in the sample, then a reasonable choice is a uniform prior for λk ; however, we wish to be conservative regarding the existence of peptide candidates. The idea is that by including more candidates, it is possible to reduce the MSE between the inferred and the observed spectra, but at the same time the chances of overfitting increase as model complexity grows. Thus, a prior based on Bayesian information criterion (BIC) (Schwarz, 1978) is adopted to address overfitting by introducing a penalty term for the number of parameters of the model. The penalty only takes effect when inclusion of one peptide does little to improve the goodness of fit. For Gibbs sampling, it is well known that the correlation between parameters can reduce sampling efficiency. Thus, we cluster peptide candidates which have large overlaps in both m/z and RT dimensions together. Candidates within one cluster have strong correlations among each other, and their indicator variables are sampled from the joint conditional posterior distribution. The iteration order also affects the performance. Therefore, peptide clusters are first sorted by their importance, which is defined as the maximal intensity of the peptides in the cluster. The iteration starts from the most significant cluster and continues to the next significant one. Our experimental results suggest that this scheme helps to reduce false positives and speed up convergence. The pseudocode of the entire Gibbs sampling process is given in supplementary file. Samples taken after convergence can be used to estimate target parameters, so the existence probability of peptide k is calculated as R ∑ λrk , where r0 is the first iteration after P (λk = 1|y) = R−r1 +1 0
r=r0
convergence is reached, R is the total number of iterations, and λrk is the sample value of λk in the rth iteration.
Downloaded from http://bioinformatics.oxfordjournals.org/ at University of Texas at San Antonio on December 9, 2011
gk (xm , t)
method (Geman et al., 1984), which is a variant of the Markov Chain Monte Carlo approach (Robert et al., 2004), to sample the model parameters. Gibbs sampling iteratively sample a subset of parameters while fixing the rest at the sample values from the previous iteration. In other words, for the lth parameter group θl , we sample from the conditional posterior distribution P (θl |θ−l , y), where θ−l , θ \ θl . After this sampling process iterates among the parameter groups for a sufficient number of cycles (which is referred to as the “burn-in” period), convergence is reached. The samples collected afterwards are shown to be from the marginal posterior distribution P (θl |y), which is independent of mathbf θ−l , and thus these samples can be used to estimate the target parameters. The Gibbs sampling process for the kth peptide candidate and the derivations of the conditional posterior distributions of important model parameters are briefly summarized below. Detailed derivations can be found in supplementary file.
If the LC-MS data also contain MS2 fragmentation spectra, then MS1 detected peptides can be linked to MS2 identified features given by software such as SEQUEST to obtain peptide sequence information.
3 RESULTS AND DISCUSSION We report the observed performance of BPDA2d, side by side with state-of-the-art methods, such as msInspect and BPDA in a number of experiments using both synthetic and real data. The efficiency of BPDA2d in detecting low abundance and overlapping peptides is illustrated.
3.1.1 Synthetic 100-mix LC-MS data sets with different abundance levels (SNRs) First, to test robustness of various algorithms, we generated LC-MS data sets with different signal to noise ratios (SNRs) using methods described by Schulz-Trieglaff et al.. More specifically, the mean signal strength (peptide abundance) was varied while the noise level (mean and variance of noise) was fixed. For each peptide abundance level a ∈ {100, 500, 5000}, the simulation was repeated 30 times. In each repetition, 100 true peptides (with abundance level a and masses randomly selected from tryptic digested human proteins) served as inputs of the model given by Eq. 4. The charge state distribution of one peptide was modeled by a binomial distribution, which was reported to approximate the real data well (Schulz-Trieglaff et al., 2008). The isotopic distribution was calculated theoretically based on peptide sequence. The peptide elution profile was modeled by an exponentially modified Gaussian distribution, which captures different distortions of elution peaks by considering tailing and fronting effects (Di Marco et al., 2001). Each output data set consists of 100 MS spectra with mass resolution 15,000. BPDA2d, BPDA and msInspect (the latest Build 613) were applied to the same data sets to give detection results. We mainly focus on the performance comparison between BPDA2d and its precursor BPDA, which was shown to outperform popular algorithms such as OpenMS (Version 1.6.0), Decon2LS and VIPER in (Sun et al., 2010). We also include msInspect in the comparison since it is widely used and has been reported to outperform other algorithms (Zhang et al., 2009) such as MZmine. To apply BPDA, we followed the procedure introduced in the original paper (Sun et al., 2010): Peptide elution peaks were first detected along the RT dimension, and elution peaks with similar RT were grouped. Each group contains a series of consecutive spectra, which were then averaged to form a mean spectrum. Each mean spectrum was analyzed by BPDA, and finally an overall feature list was produced. To apply msInspect, we first wrote each simulated data set into a text file with three columns specified by RT, m/z, and intensity. Next, the text file was converted to mzXML and then msInspect was applied to give detection results including detected features and their qualities. The input parameters of msInspect were set to enable the inclusion of as many reasonable features as possible (“minpeaks” and “maxkl” were set to 2 and 10, respectively). When comparing BPDA2d to its precursor BPDA, we found that the former had several advantages over the latter as detailed below. (I) For each experiment conducted, the total number of candidates considered in BPDA2d was greatly reduced compared to BPDA (reduced by 43% on average). This is expected since BPDA2d imposes additional constraints on candidates’ elution peaks and can
5
Downloaded from http://bioinformatics.oxfordjournals.org/ at University of Texas at San Antonio on December 9, 2011
3.1 Results for synthetic data
preclude non-reproducible noise peaks from the candidate list. To clarify, BPDA2d searches for candidates which can be repetitively observed across retention time — i.e. candidates whose elution peaks can be clearly identified. Thus, a major fraction of noise peaks (e.g. shot noise) which are not reproducible in time is removed. In contrast, BPDA is a 1D algorithm which works along the m/z dimension and processes one mean scan at a time. The mean scan is produced by taking the average of a few consecutive spectra. Thus, although noise in the form of random intensity fluctuation can be canceled out to some degree, non-reproducible noise peaks are still likely to be included in the resulting mean scan and therefore in the candidate list. Also, BPDA is likely to split long elution peaks into multiple mean scans and thus generate multiple candidates for a single true peptide. In summary, BPDA2d can compile a more reliable candidate list, which may help to reduce the number of detected false positives (FPs), and can allocate limited computational resources to candidates more likely to be true positives (TPs). (II) BPDA2d reported significantly fewer FPs with existence probability larger than 0.9 than BPDA (reduced by 47% on average) and detected more TPs than the latter (increased by 6% on average). This improvement of BPDA2d is achieved by taking into account peptide elution peaks in addition to isotopic distribution and charge station distribution. BPDA2d tries to use all available observations from possible positions on the m/z-RT plane to infer the overall signal of each peptide candidate. By utilizing more information, detected signals become more reliable and the evidence of candidates’ existence or non-existence becomes stronger, resulting in better detection results in terms of more TPs and less FPs. When comparing BPDA2d to msInspect, we found that on average the TPs detected by BPDA2d increased by 16% with respect to the latter while the FPs reduced by 40% (quality thresholds were set to existence probability larger than 0.9 and KL less than 1, for the two algorithms, respectively). To give a complete picture of the detection results, the classic Precision-Recall (PR) curve has been adopted to evaluate the performance of various algorithms since the ground truth of the data is known. To obtain the PR curve, first a series of detection levels was selected, which range from the lower bound to the upper bound of feature quality scores (i.e. existence probability for BPDA and BPDA2d; KL score for msInspect). Features with quality score better than a given detection level were said to be detected at this specific detection level. A detected feature was claimed to be a true positive if it had the correct monoisotopic mass (e.g. within 10 ppm of the true mass), the correct RT (with a 6-scan tolerance), and the true RT is within the boundaries of the feature’s elution peak; otherwise, the detected feature was called a false positive. Then, the True Positive Rate (TPR, i.e. recall) and precision (Prec) were calculated at each detection T rueP ositive level as follows: T P R = T rueP ositive+F and alseN egative T rueP ositive P rec = T rueP ositive+F alseP ositive . The average PR curve for one abundance level was then obtained (each point on the curve was a pair of average precision and TPR at one detection level for all repetitions). We found that the Precision-Recall results were largely influenced by the size of the mass window used for matching detected features with the list of true peptides. Precision-Recall curves for various mass windows are shown in Fig. 1.
Precision−Recall at 10 ppm
0.4 0.2 0 0
0.8 BPDA2d−1e2 BPDA−1e2 msInspect−1e2 BPDA2d−5e2 BPDA−5e2 msInspect−5e2 BPDA2d−5e3 BPDA−5e3 msInspect−5e3
0.6 0.4 0.2
0.2
0.4 0.6 Recall (i.e. TPR)
0.8
0 0
0.2
0.4 0.6 0.8 Recall (i.e. TPR)
0.6 0.4 0.2
1
0 0
0.2
0.4 0.6 0.8 Recall (i.e. TPR)
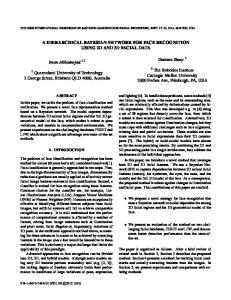
In the PR space, the upper right corner (with coordinate [1,1]) represents 100% sensitivity (no false negatives) and 100% precision (no false positives). The closer the PR curve is to the upper right corner, the better the algorithm. In this sense, BPDA2d is generally the best among all methods at all abundance levels. BPDA2d’s performance is the least affected by the deterioration of SNRs among the three algorithms. Thus, BPDA2d provides the most robust performance for lower abundance peptides. Another advantage of BPDA2d is that it has much higher reported mass accuracy. In the supplementary file, we provide comparison of mass accuracies of all three algorithms, and we have shown that the mass accuracy reported by BPDA2d is significantly higher than the other two algorithms. Given different mass accuracies, there is not a fair way for performance evaluation. Thus, we provide performance evaluation in three cases when different mass window sizes are used. It can be seen that the mass window size does not affect the performance of BPDA2d significantly after 10 ppm because of its high mass accuracy. On the other hand, msInspect deteriorates quickly as we narrow the mass window from 20ppm to 10ppm due to its low mass accuracy. BPDA2d outperforms msInspect at higher mass accuracies of 10ppm and 5ppm. In the case of 20ppm, given the simple composition of the simulated data, the performance between BPDA2d and msInspect is similar. It shall be noted that with different mass accuracies by different algorithms, sample composition will strongly affect the reported PR curve — if the sample is more complex, with more peptides of similar weights, then an algorithm with lower mass accuracy like msInspect will further deteriorate in performance. 3.1.2 Synthetic LC-MS data set with 8 pairs of overlapping peptides As noted, overlapping peptide peaks can complicate mass spectra and make the detection problem much harder. Hence, it is important to investigate algorithm performance in the presence of overlapping peptides. A synthetic 16-peptide-mix was generated by 8 pairs of overlapping tryptic digested human peptides. The data set contains 1000 LC-MS spectra with mass resolution 15,000. The intensity ratio of each pair (light/heavy) ranges from 0.25 to 3, and peptide charge states range from 1 to 4. More details on these peptides and the detection results of different algorithms are summarized in Table 1. For the first 4 pairs, the challenges are mainly to detect and split overlapping elution peaks of the two peptides in each pair with similar weights and close RT. For instance, the elution profiles and observed signals of the two peptides in the 1st pair are shown
6
1
Elution profiles of the 1st overlapping pair 1 1st peptide 2nd peptide
0.8 0.6 0.4
RT
0.2 0 80
100
120
140 160 RT
180
200
220
m/z
(a) (b) Fig. 2. Overlapping signals of the first pair in 16-mix. a) Overlapping LC profiles of the two peptides. (b) Signal peaks of the two peptides at charge state 1 in a 3D view. SNR at this region is quite low, and significant peak overlapping can be observed.
For the last 4 pairs, the weights of two peptides in each pair differ approximately by a multiple of the neutron weight. As a result, their isotopic peaks overlap at different isotope numbers and the overall isotope pattern deviates from each individual’s. Thus, it is more challenging to utilize individual isotope pattern to discern the overlapping pair. As a vivid example, the elution profiles and the observed signals of peptides in the sixth pair are shown in Fig. 3. It is observed that the SNR at corresponding regions was quite high and peaks of the second peptide in this pair almost got completely shadowed under all but the first isotope peak of the first peptide (Fig. 3(a),(b)). Hence, the overall signal pattern (Fig. 3(c)) deviates from each individual’s isotope pattern (see Fig. 3(d)). MsInspect was not able to detect this deviation: The calculated KL distance between the overlapping peak cluster and the first peptide’s theoretical isotope pattern was surprisingly small (around 0.027), suggesting a ’good’ match by its own criterion (a smaller KL score suggests a better match). MsInspect thus stopped there and assigned all overlapping signals to the first peptide, failing to consider the second peptide. This failure was not caused by chance. In fact, for the last 4 pairs, msInspect could correctly detect only one pair of peptides (the one with the least overlap) and missed one peptide in each of the other 3 pairs.
Downloaded from http://bioinformatics.oxfordjournals.org/ at University of Texas at San Antonio on December 9, 2011
Fig. 1. Precession-Recall results for synthetic LC-MS data sets with different abundance levels (SNRs). Each panel shows the results obtained at a different mass window size as suggested by the title. Color codes for different abundance levels. Each method is represented by a unique line type. BPDA2d renders the best precision and sensitivity (i.e., recall) among all the methods compared for all abundance level in the first two mass window cases. In the last case, the performance between BPDA2D and msInspect has a very small difference.
in Fig. 2. We observe that the two peptides have significant overlapping signal regions, which makes the detection problem tough. MsInspect experienced difficulty in identifying this pair. In fact, it failed to split the overlapping elution peaks and treated the two peptides as a single one. As a result, the intensity of the reported peptide (the 2nd one) equals the total intensity of the two. For BPDA, although it could report both peptides correctly, the intensity results were inaccurate (the intensity ratio turned out to be greater than 1 while the true ratio was 0.67). BPDA detected the second peptide correctly from 106s to 128s (approximately from the beginning to the maximum of the second peptide’s elution profile, see Fig. 2(a)), while the rest of the signal peaks which appeared after 128s were shadowed by the 1st peptide, whose signal was stronger. Therefore, in this region BPDA failed to include the 2nd peptide in its candidate list and tried to use the 1st peptide alone to explain the observed signal. The second peptide’s corresponding intensity was thus wrongly attributed to the first one, thereby leading to inaccurate intensity results. In contrast to msInspect and BPDA, BPDA2d correctly split the elution peaks of the two peptides by capturing the tiny mass difference of the two and by detecting intensity dips in the observed overlapping peaks.
Intensity(101)
0.8
0.6
Scaled intensity
0.8
Precision−Recall at 20 ppm 1
Precision
1
Precision
Precision
Precision−Recall at 5 ppm 1
Table 1. Results of the data set with 8 pairs of overlapping peptides Pair No. 1 2 3 4 5 6
8
DYSYER DENGELR VVFMSLCK LLLPCLVR MTPELMIK IAVMLMER ACCLLCGCPK MLCAGIMSGK AYDPDYER EEPSGDGELP NGNEEGEER TEGEEDAQR MLANLVMHK LTLDLMKPK LLPPLLQIVCK LMLFMLAMNR
True peptide info Mass(Da) RT(s) 831.34 831.37 925.48 925.58 961.50 961.51 1009.42 1009.48 1027.42 1028.43 1032.41 1033.43 1055.56 1057.62 1235.77 1238.63
141 127 414 456 323 340 302 314 174 194 75 79 312 321 561 577
CS
Intn
1-2 1-2 1-2 1-2 1-3 1-3 1-3 1-3 1-3 1-3 1-3 1-3 1-3 1-3 1-4 1-4
.0004 .0006 .0046 .0054 .0001 .0002 .0011 .0008 .0077 .0307 .4612 .1537 .0019 .0009 .1768 .1537
BPDA2d CS Intn
BPDA CS Intn
1-2 1-2 1-2 1-2 1-3 1-3 1-3 1-3 1-3 1-3 1-3 1-3 1-3 1-3 1-4 1-4
1-2 1-2 1-2 1-2 1-3 1-3 1-3 1-3 1-3 1-3 1-3
.0003 .0006 .0033 .0044 .0001 .0002 .0008 .0009 .0078 .0344 .5110 .1065 .0018 .0010 .1755 .1516
1-3 1-3 1-4 1-4
msInspect CS Intn
.0008 .0005 .0043 .0056 .0001 .0003 .0023 .0014 .0081 .0418 .7140 NA .0017 .0008 .1405 .0779
NA .001 .0050 .0068 .0001 .0003 .0024 .0020 NA .0382 .7284 NA .0023 NA .1193 .0943
1-2 1-2 1-2 1-2 1-3 1-3 1-3 1-3 1-3 1-3 1-4 1-4
CS and Intn denote detectable charge states and normalized intensity, respectively. Elution profiles of the 6th overlapping pair
0.8
1st peptide 2nd peptide
0.6 0.4
RT
0.2 0 50
60
3.2.1 Data preparation A QTOF LC-MS/MS dataset was downloaded from the repository of the Seattle Proteome Center that is provided as a standard for testing algorithms. The dataset was collected on a Waters/Micromass (Milford, MA) Q-TOF Ultima with Agilent 1100 series autosampler, Agilent 1100 series
70
80
90
100
110
120
RT
m/z
(a)
(b)
RT = 78
4
18
x 10
Theoretical isotopic distribution of the 6th pair
16
0.6 Scaled intensity
14
Intensity
12 10 8 6
1st peptide 2nd peptide
0.5 0.4 0.3 0.2
4 0.1
2 0 345
345.5
346
346.5
347
0 345
347.5
345.5
m/z
346
346.5
347
347.5
m/z
(c) (d) Fig. 3. Overlapping signals of the sixth pair in 16-mix. (a) Overlapping LC profiles. (b) Signal peaks of the two peptides at charge state 3 in a 3D view. This region has a high SNR, where peaks of the 2nd peptide almost get completely shadowed by all but the first isotope peak of the 1st peptide. (c) MS scan sampled at 78s showing signals of the same pair. The observed overall signal pattern deviates from (d) theoretic isotope patterns of the two peptides. Intensity deviation (%)
30 25 20 15 10 5 0
120 100 80 60 40 20 0
BPDA2d
3.2 Results for real data
Intensity (104)
Scaled intensity
1
Mass deviation (ppm)
This illustrates the inefficiency of template matching algorithms such as msInspect in dealing with overlapping isotope patterns as compared to BPDA2d and BPDA. Indeed, one should be wary of taking KL distance, or other distance measures adopted by template matching algorithms, as a reliable measurement of the isotope pattern deviation. BPDA proposed a candidate corresponding to the second peptide; however, the candidate’s existence probability was inferred to be 0, thereby rendering it undetectable. This was caused by the penalty term adopted in BPDA that penalizes model complexity. More specifically, the additional inclusion of the second peptide could reduce the MSE between the observed and inferred peaks to a small extent, but this reduction in MSE could not beat the increase of model complexity. Therefore, BPDA inferred the second peptide to be non-existent. Although BPDA2d utilizes a similar penalty strategy, the penalty term did not cause exclusion of the second peptide because BPDA2d used more observations from the m/z-RT plane than BPDA and the improvement in fitting the observed signal by inclusion of the second peptide was significant, thereby offsetting the penalty. In summary, BPDA2d correctly detected all 46 charge states of the 16 peptides (along with 16 FPs), while BPDA and msInspect correctly detected 43 and 34 charge states, along with 57 and 4 FPs, respectively (See the supplementary file for more details). All detected TPs of BPDA2d and BPDA had existence probability equaling to 1. For msInspect, the KL scores of TPs were less than 0.76. The box plots of mass and intensity deviation results given by the three algorithms are shown in Fig. 4. We observe that among the three algorithms, on average BPDA2d gave the most accurate abundance results and msInspect’s results were the least accurate. BPDA had the best mass accuracy evaluated by the median mass deviation, but it rendered a few outliers and a larger variance compared to BPDA2d. Overall, msInspect produced the least accurate mass results. The synthetic test data are available upon request.
BPDA
msInspect
BPDA2d
BPDA
msInspect
(a) (b) Fig. 4. Box plots of (a) absolute mass deviation and (b) normalized intensity deviation of BPDA2d, BPDA and msInspect for the 16-mix data set
nanopump flowing at 200 nL/min and electrospray ionization.
7
Downloaded from http://bioinformatics.oxfordjournals.org/ at University of Texas at San Antonio on December 9, 2011
7
Sequence
8
1100
180
Number of detected features
Number of detected features
190
170 160 150 140
BPDA2d BPDA msInspect
130 120
1000 900 800 700 600
BPDA2d BPDA msInspect
500 400
110 0.01
0.02
0.03
0.04
0.05
0.06
0.07
0.08
0.09
300 0.01
0.1
0.02
0.03
0.04
0.05
0.06
0.07
0.08
0.09
0.1
Significant level
Significant level
(a)
(b)
20 18
40 16
Mass deviation (ppm)
• For BPDA2d and BPDA, existence probabilities are employed to measure feature quality. The cutoff thresholds of existence probability were calculated based on its null distribution, i.e. the distribution of existence probability of those candidates that are non-existing in the sample. We identify these peptides as those highly correlated ( i.e. can be grouped into the same cluster as described in Method section) with one of the candidates that can be matched to the MS2 identification list. Although the ground truth is unknown, the latter candidates are likely to be TPs as they are confirmed by the MS2 identifications with high reliability, while the former are false identifications co-existing with the latter. These co-existing candidates should be assigned with a low existence probability. Given a significant level α, the corresponding threshold γ of the existence probability p can be calculated based on the righttail probability of the null distribution: {γ|P rob(p ≥ γ) = α}.
From Fig. 5(a), it can be seen that BPDA2d detected many more features from the MS2 list than BPDA and msInspect at each significant level compared. Improvements are from 32% to 18%, and 64% to 19% compared to BPDA and msInspect, respectively, when significance level increases from 0.01 to 0.1, indicating a 36 fold increase in peptide coverage and quantification. In addition, all three MS1-based algorithms detected significantly more features than that covered by the 234 MS2 identifications (see Fig. 5(b)), illustrating the under-sampling problem of MS2 and highlighting the benefits of employing MS1-based peptide detection algorithms to improve protein coverage rate. Performances of various algorithms were further investigated at a 0.05 significance level. The histogram of normalized intensity of MS2-level identifications detected by BPDA2d but not by msInspect is plotted in Fig. 5(c). The majority of identifications detected only by BPDA2d concentrate at the low intensity region (i.e. the area with normalized intensity less than 0.1), illustrating that BPDA2d can better identify low abundance peptides than msInspect. Moreover, extra identifications yielded by BPDA2d did not cause degradation in mass accuracy (Fig. 5(d)). Moreover, BPDA2d slightly beat the other two methods in terms that the mean mass deviation is reduced by around 2%. The
14
Counts
3.2.2 Comparative results Direct comparison of results across different methods is meaningless unless ground truth of the data is known, but owing to contaminants and issue of peptide detectability, the true data composition is hard to know. As a workaround, SEQUEST and PeptideProphet were applied to analyze all the acquired MS2 spectra, rendering 234 unique peptide identifications associated with a high probability score (i.e. PeptideProphet score greater than 0.9) and could somehow reveal a portion of the truly existing peptides in the sample. We thus compared the detection results given by aforementioned MS1-based methods to the MS2 identifications. We say a MS1 feature is matched to a MS2 feature if the RT of the MS2 feature is within the retention peak of the MS1 feature and the mass deviation is within 40 ppm. The size of the mass window is chosen to include as many good matches as possible. It is larger than that used for synthetic data since here the ground truth peptide weights are unknown, and mass errors are associated with MS2 identifications as well as MS1 features. MS1 identifications were first filtered based on mass and RT. Only features with mass 1000-3710 Da. and RT in the range of 840 to 2030 scan were considered since all MS2 identifications were from these ranges. Remaining features were then selected based on the reported quality score. Because schemes used for calculating feature quality score vary across different algorithms, to ensure a fair and meaningful comparison, quality cutoff thresholds for various algorithms were carefully chosen as detailed below so that they corresponded to the same significant level.
• MsInspect uses KL score to measure feature quality. Cutoff KL thresholds were selected based on KL null distribution, i.e. the distribution of KL scores calculated between random noise and authentic isotopic distributions, as described by Haskins et al.. If KL score can faithfully reflect the deviation between random noise and real isotopic patterns, then the KL null distribution should skew to the right or have a small left-tail probability. On the other hand, given a significant level α, the corresponding KL threshold τ could be calculated based on the left-tail probability: {τ |P rob(KL ≤ τ ) = α}.
12 10 8 6 4 2 0 0
0.1
0.2
0.3
0.4
0.5
Normalized intensity
0.6
0.7
35 30 25 20 15 10 5 0
BPDA2d
BPDA
msInspect
(c) (d) Fig. 5. Detection results of the QTOF LC-MS/MS dataset. BPDA2d, BPDA and msInspect detected (a) total number of features and (b) number of features that can be matched to MS2 identifications at various significant levels. At significant level 0.05, the following two panels are obtained: (c) Histogram of normalized intensity of features detected by BPDA2d but not msInspect. Most of the features are from the low intensity region. (d) Box plots of absolute mass deviation of different algorithms.
Downloaded from http://bioinformatics.oxfordjournals.org/ at University of Texas at San Antonio on December 9, 2011
Approximately 200 fmol of total protein was injected on-column. The dataset contains over 3500 MS1 spectra (m/z ranges from 250 to 1400 with FWHH around 0.15 Da.) and 775 MS2 spectra generated by peptides from 18 tryptic digested proteins (obtained from Bovine, Rabbit, Horse, etc.). More details can be found in Klimek et al. (2008). MS1 level peptide detection was performed using BPDA2d, BPDA, and msInspect (the latest Build 613). We tried to optimize input parameters for msInspect: “minpeaks” was set to 2 and “maxkl” was set to 10, enabling the inclusion of as many reasonable features as possible. The “walksmooth” option was selected as it was recommended for QTOF data and improved the performance. For BPDA, post-processing was applied to combine features that were split over consecutive mean spectra.
average computational time of BPDA2d, BPDA and msInspect for testing data sets are 3.5 hr, 1 hr and 2.2 min, respectively (see the supplementary file for more details). BPDA2d is expected to be more time-consuming since it looks for the optimal solution iteratively through Gibbs sampling on the whole spectra, while greedy template-matching based algorithms work on one local region at a time and calculate the fitting score, which typically does not require much computation. But we point out that the BPDA2D algorithm is fully parallelizable, and the authors are in fact working on a parallel version of the software that will be much faster.
4 CONCLUSION
REFERENCES Bantscheff ,M. et al. (2007) Quantitative mass spectrometry in proteomics: a critical review. Anal Bioanal Chem, 389, 1017–1031. Bellew ,M. et al. (2006) A suite of algorithms for the comprehensive analysis of complex protein mixtures using high-resolution lc-ms. Bioinformatics, 22, 1902–1909. Cox, J. et al. (2008) Maxquant enables high peptide identification rates, individualized p.p.b-range mass accuracies and proteome-wide protein quantification. Nat. Biotech, 26, 1367–372. Di Marco, V. B. et al. (2001) Mathematical functions for the representation of chromatographic peaks. J. Chromatogr. A, 931, 1–30. Dijkstra M. et al. (2009) Optimal analysis of complex protein mass spectra. Proteomics, 9, 3869–3876. Domon B. et al. (2006) Mass spectrometry and protein analysis. Science, 312, 212. Frank, R. et al. (2003) Clinical biomarkers in drug discovery and development. Nat Rev Drug Disc, 2, 566–580. Geman, S. et al. (1984) Stochastic relaxation, gibbs distributions, and the
9
Downloaded from http://bioinformatics.oxfordjournals.org/ at University of Texas at San Antonio on December 9, 2011
We have presented BPDA2d, a global optimization based Bayesian peptide detection algorithm for LC-MS data. Feature extraction from LC-MS data is complicated by several factors such as protein wide dynamic range, high signal density, and variability of liquid chromatography. BPDA2d is designed to tackle these problems. It extracts all pertinent observations (including isotope pattern, charge state distribution and LC elution peaks) and pieces all evidence together for the detection of each candidate, blending information to better identify weak peptide signals. Based on a rigorous statistical framework, BPDA2d optimizes all candidates’ signals globally, resulting in more effective detection of overlapping peptides compared to local template-matching based methods that detect peptides one by one in a greedy manner. Instead of employing pre-assumed elution peak models, BPDA2d derives peptide elution profiles directly from observations. Therefore, it is more robust in dealing with LC fluctuations and more adaptable across analysis platforms. We have shown that BPDA2d performs well on both simulated data and real data for various signal to noise ratios and in complex cases where features overlap. Our experimental results indicate that BPDA2d outperforms state-of-the-art software such as msInspect and BPDA in terms of sensitivity and detection accuracy. As the mass resolution and accuracy of MS instruments continue to improve, we expect BPDA2d to achieve better qualification and quantification results. We think the main application of BPDA2d will be on TOF instruments, which suit our data model better. BPDA2d is publicly available and we hope it will be useful to the wider community.
bayesian restoration of images. IEEE Trans. Pattern Anal. Mach. Intell., 6, 721–741. Haskins, W. E. et al. (2011) MRCQuant- an accurate lc-ms relative isotopic quantification algorithm on tof instruments. BMC Bioinformatics, 12, 74. Hoopmann M. R. et al. (2007) High speed data reduction, feature selection, and MS/MS spectrum quality assessment of shotgun proteomics datasets using high resolution mass spectrometry. Anal. Chem., 79, 5630–5632. Jaitly, N. et al. (2009) Decon2ls: An open-source software package for automated processing and visualization of high resolution mass spectrometry data. BMC Bioinformatics, 10, 87. Katajamaa, M. et al. (2005) Processing methods for differential analysis of lc/ms profile data. BMC Bioinformatics, 6, 179. Keller, A. et al. (2002) Empirical statistical model to estimate the accuracy of peptide identifications made by ms/ms and database search. Anal. Chem., 74, 5383–5392. Klimek, J. et al. (2008) The standard protein mix database: A diverse dataset to assist in the production of improved peptide and protein identification software tools. J. Proteome Res., 7, 96. Leptos ,K. C. et al. (2006) MapQuant: Open-source software for large-scale protein quantification. Proteomics, 6, 1770–1782. Li ,X. J. et al. (2005) A software suite for the generation and comparison of peptide arrays from sets of data collected by liquid chromatography-mass spectrometry. Mol Cell Proteomics., 4, 1328–40. Monroe, M. E. et al. (2007) VIPER: an advanced software package to support high-throughput lc-ms peptide identification. Bioinformatics, 23(15), 2021–2023. Morris, J. S. et al. (2005) Feature extraction and quantification for mass spectrometry in biomedical applications using the mean spectrum. Bioinformatics, 21, 1764–1775. Mueller ,M. et al. (2007) Superhirn-a novel tool for high resolution lc-ms based peptide/protein profiling. Proteomics, 7, 3470–3480. Nesvizhskii, A. I. et al. (2006) Dynamic spectrum quality assessment and iterative computational analysis of shotgun proteomic data: toward more efficient idenfitication of post-translational modifications, sequence polymorphisms, and novel peptides. Mol. Cell. Proteomics, 5, 652–670. Perkins, D. N. et al. (1999) Probability-based protein identification by searching sequence databases using mass spectrometry data. Electrophoresis, 20, 3551–3567. Renard, B. Y. et al. (2008) NITPICK: peak identifcation for mass spectrometry data. BMC Bioinformatics, 9, 355. Robert, C. P. et al. et al. (2004) Monte Carlo Statistical Methods. Springer, New York. Rockwood, A. L. et al. (1995) Rapid cacluation of isotope distributions. Anal Chem, 67, 2699–2704. Schulz-Trieglaff ,O. et al. (2008) Lc-MSsim – a simulation software for liquid chromatography mass spectrometry data. BMC Bioinformatics, 9, 423. Schwarz, G. (1978) Estimating the dimension of a model. Ann. Stat, 6, 461– 464. Senko, M. W. et al. (1995) Determination of monoisotopic masses and ion populations for large biomolecules from resolved isotopic distributions. J Am Soc Mass Spectrom, 6, 229–233. Sturm ,M. et al. (2008) Openms — an open-source software framework for mass spectrometry. BMC Bioinformatics, 9, 163. Sun, Y. et al. (2010) BPDA — a Bayesian peptide detection algorithm for mass spectrometry. BMC Bioinformatics, 11, 490. Zhang ,J. et al. (2009) Review of peak detection algorithms in liquidchromatography-mass spectrometry. Curr Genomics, 10, 388–401.