kmeans, lloyds, llyds-kmeans, pso clustering, ga clustering and jaya optimisation ... comparison, the manual segmentation results of MR images from BRATS 2012 dataset have ..... MRI segmentation methods in software tools," in. Biomedical ...
International Journal of Computer Applications (0975 – 8887) Volume 155 – No 3, December 2016
Brain MRI Segmentation based on Different Clustering Algorithms Enver Küçükkülahli
Pakize Erdoğmuş
Kemal Polat
Düzce University Computer Department Vocational High School Düzce, Turkey
Düzce University Department of Computer Engineering Düzce, Turkey
Abant Izzet Baysal University Department of Electrical and Electronics Engineering Bolu, Turkey
ABSTRACT In this study, MR Image segmentation has been realized with some clustering algorithms. In the study, the performances kmeans, lloyds, llyds-kmeans, pso clustering, ga clustering and jaya optimisation algorithms on some MR images from BRATS 2012 dataset have been compared. For the comparison, the manual segmentation results of MR images from BRATS 2012 dataset have been referenced and results have been compared with these referances. In the comparison RI (Rand Index), VOI (Variation of Information) and GCE (Global Consistency Error) have been used and results have been submitted. The results showed that the PSO algorithm yielded better results and has a better processing time than the other algorithms.
General Terms Clustering, Segmentation, MR Images
Keywords Kmeans, particle swarm optimization, genetic algorithm, jaya optimization, Lloyds
1. INTRODUCTION Disease diagnosis using medical images is a subject that has been studied in many disciplines of computer engineering. Various studies are conducted in order to obtain the MR images in a mobile manner and make meaningful conclusions from these images when required. In these studies, the first step in determining the tumours using Magnetic Resonance (MR) images is segmentation [1]. In image processing, segmentation is clustering the pixels of the objects on the image. In medical image processing, segmentation acts as the key process in the determination of the location and size of the tumours on the image [2]. For segmentation, region based, cluster-based and histogrambased segmentation algorithms are mainly used. In this study, especially brain images were segmented. The CSM (Cohesion based Self-Merging)-based partial k-means clustering algorithm [3] was used for the segmentation in brain images in the studies carried out, FCM (Fuzzy C-Means) and artificial neural networks [4], flock-based clustering algorithm [5], FCM-based HS (Harmony Search) hybrid algorithm [6], and fuzzy-logic based genetic algorithm [7] were used in order to increase clustering success. After using K-means and SVM (Support Vector Machine) [8] in order to overcome the difficulties that arise as a result of the failure to find the noise and reference image in MR images, and wavelet transform to reduce the noise in the images, the K-means clustering algorithm [9] was used for segmentation. The K-means clustering algorithm and hybrid methods based on K-means are frequently preferred for the segmentation process. In the segmentation of MR images, the K-means algorithm was used
with the watershed segmentation algorithm, K-means with the genetic algorithm, c-means with the genetic algorithm, and traditional K-means algorithms were used with c-means [10]. Testing and comparing the studies performed on the segmentation of MR images is another issue. In their study, Cabria and Gondra used the public brain tumour image segmentation (BRATS)[11,12] MRI database in order to test the success of the automatic K-means algorithm [13]. BRATS database provides access to the segmentation results that are manually performed in addition to the MR images of the brains with tumour. In the studies carried out, RI (Rand Index), VOI (Variation of Information) and GCE (Global Consistency Error) are among the methods that are frequently used for the performance comparison [14,15,16].
2. MATERIAL MR images obtained from the Multimodal Brain Tumour Image Segmentation Benchmark (BRATS) 2012 database were used in this study. 55 of these MR images of low and high-grade glioma patients were taken from real patients, and 65 of them were produced synthetically. 80 of these 120 MR images have human segmentation results and are used for training purposes. Human segmentation results were divided into four areas as tumour-area necrosis in real patients, contrast-enhancing tumour, non-enhancing tumour and oedema. They were divided into two areas being tumour core and oedema in synthetic data. 10 MR images with human segmentation results of real patients were used in this study.
3. METHOD The segmentation process was defined as separating the objects inside the image from one another. In general, the segmentation process is used in order to find the limits or objects inside the image. At the end of the process, it becomes easier to analyse and define the image. Clustering algorithms have an extremely important place in medical image processing. In this section, certain clustering algorithms frequently used for the segmentation of MR images were examined.
3.1 K-MeansClustering Algorithm The K-means algorithm is one of the simplest and effective ways used in the solution of clustering problems. It is a method that is based on the idea that the gravity centres of the cluster elements represent the cluster [17]. The K-Means algorithm divides the data cluster entered into the system by the user and consisting of n number of the data into k number of clusters that are entered by the user again. It determines the distance of cluster belongings to the cluster centres of the objects.
37
International Journal of Computer Applications (0975 – 8887) Volume 155 – No 3, December 2016 There is not a specific standard in order to create a good starting set. Different results can be yielded as a result of the random assignment of the starting values each time they are operated [18].
3.2 Lloyd’s Clustering Algorithm Lloyd’s algorithm is also known as Voronoi Iteration. It groups the points in the search space in the categories according to the number of given categories. It can reduce the complexity of K-means by working with the K-means algorithm [19].
3.3 Particle Swarm Optimisation (PSO) Particle Swarm Optimisation (PSO) is a population-based stochastic optimisation technique developed by Kennedy and Eberhart by being inspired by the two-dimensional movements of bird flocks and fish schools [20]. Shi and Eberhart added the inertia weight to the optimisation model [21]. In PSO, each particle represents a candidate solution. In each iteration, each particle measures the adequacy of itself and those around it. These measurements are used in finding the new location of the particle in the subsequent iteration.
3.4 Genetic Algorithm (GA) Genetic Algorithms were found by John Holland in the 1960s. Holland’s GA method was developed in order to take the chromosomes in a population to a new population with genetic operators such as crossover and mutation by using a kind of natural selection. Good individuals in a particular population are selected using the selection operator, a new individual is created by crossing over these individuals among themselves, and this individual formed is transferred to the next population.
3.5 Jaya Optimisation Algorihm It is an algorithm newly developed by Jaya, Rao [22]. The basic structure of the algorithm is based on a solution cluster that is obtained from the problem, goes to the best and avoids the worst. f(x) being the objective function; m is the number of design variables (j=1,2,…,m) in any iteration i, and n is the number of candidate solutions (number of population, k=1,2,…,n). In all solution clusters, best represents the best solution while worst represents the worst solution. If Xj,k,i is accepted as the jth variable of the kth solution in the ith iteration, it is calculated as follows for the subsequent iterations. 𝑋𝑗′,𝑘,𝑖
= 𝑋𝑗 ,𝑘,𝑖 + 𝑟1,𝑗 ,𝑖 𝑋𝑗 ,𝑏𝑒𝑠𝑡 ,𝑖 − 𝑋𝑗 ,𝑘,𝑖
− 𝑟2,𝑗 ,𝑖 𝑋𝑗 ,𝑤𝑜𝑟𝑠𝑡 ,𝑖 −
𝑋𝑗 ,𝑘,𝑖 (1) Here, Xj,best,i is the value of j variable for the best solution and Xj,worst,i is the value of the j variable for the worst solution. X’j,k,i is the updated state of Xj,k,i ,and r1,j,i and r2,j,i are random numbers created in the interval of [0,1] for the jth variable in the ith iteration. “r1,j,i (Xj,best,i -| Xj,k,i |)” represents the tendency of the solution to approach the best conclusion, while “r2,j,i (Xj,worst,i -| Xj,k,i |)” expresses the tendency of the solution to avoid the worst result. If a better result than the value produced in the previous iteration is achieved, X’j,k,i is accepted, and it is accepted as input values for the subsequent iteration. The absolute value | Xj,k,i | of the candidate solution was considered in order to further increase the searching capability.
4. EXPERIMENTAL RESULTS K-means, Lloyd’s, Lloyd’s-Kmeans, PSO, GA and Jaya Optimisation algorithms that are briefly mentioned in the Method section were run on 10 sample MR images taken from Brats2012 database, and the results obtained were recorded for the comparison process. The data obtained after the segmentation process were compared with the human segmentation results of the MR image from Brats database. RI (Rand Index), VOI (Variation of Information) and GCE (Global Consistency Error) used for the comparison process are briefly explained below.
4.1 Rand Index (RI) Rand Index (RI) counts the matching pairs between reliable data and the data obtained as a result of the experiment. Basically, RI measures the similarity between two data sets. For a data set consisting of S defined from n elements and 2 sections; a being the number of the matching elements in S that are in the same set in X and Y, b: the number of the matching elements in S that are in different sets in X and Y, c: the number of the matching elements in S that are in the same set in X but in the different set in Y, and d: the number of the matching elements in S that are in the different set in X and in the same set in Y. 𝑎+𝑏
𝑅𝐼 = 𝑎+𝑏+𝑐+𝑑 =
𝑎 +𝑏
(2)
𝑛 2
a+b was defined as the similarity between X and Y and c+d as the difference between X and Y. Rand Index has a value between 0 and 1. 0 indicates that there is no similarity between the two data sets, while 1 indicates that the two data sets are exactly the same.
4.2 Global Consistency Error (GCE) Global Consistency Error (GCE) measures which segmentation yields more refined results when compared to others. Interrelated segmentations, which represent the parts of the same image, are regarded as consistent. If a section is an appropriate sub-cluster of another section, it means that that pixel is in a refined area, and the error must be 0. If there is no sub-cluster relationship, then the two areas overlap inconsistently. 1
𝐺𝐶𝐸 = 𝑛 𝑚𝑖𝑛
𝑖
𝐸 𝑠1, 𝑠2, 𝑝𝑖 ,
𝑖
𝐸 𝑠2, 𝑠1, 𝑝𝑖
(3)
is defined with the above formula. It takes the two segmentation results as S1 and S2 and measures the segmentation error. A value between 0 and 1 is produced as a result of the error measurement. Here, 0 means that there is no error. For a particular pixel, pi determines that it is covered by s1 and s2.
4.3 Variation of Information (VOI) Variation of Information (VOI) defines the distance between two segmentation results as the average conditional entropy of a segmentation to the other. Hence, it measures the amount of randomness that cannot explain a segmentation result with the other. Variation of Information (VOI) is calculated with the following formula upon two clustering results, being X and Y; 𝑉𝐼 𝑋, 𝑌 = 𝐻 𝑋 + 𝐻 𝑌 − 2𝐼(𝑋, 𝑌)
(4)
Here, H(X) is X’s entropy, and I(X,Y) is the mutual information between X and Y. This information is the loss of uncertainty between a cluster and the other. That the VOI
38
International Journal of Computer Applications (0975 – 8887) Volume 155 – No 3, December 2016 value is found to be low shows that the result obtained is better than the other [23]. The averages of RI (Rand Index), VOI (Variation of Information), GCE (Global Consistency Error) values obtained as a result of the comparison are presented in Table 1, the best values are presented in Table 2. The best, worst and average operating time of the algorithms are presented in Table 3. Table 1. Averages Of The Performance Values Of The Algorithms That Are Run 30 Times On 10 Mr Images Algorithm Kmeans Lloyds LloydsKmeans PSO Clustering GA Clustering Jaya
Average Values GCE↓
RI↑ 0,792984898
0,05713884
0,742092889
0,841362985
0,055293512
*
0,63060031
0,841362985
0,055293512*
0,63060031
0,855907832*
0,061135636
0,578421956*
0,826025054
0,063858993
0,660213155
0,845464419
0,061632943
0,610849743
Table 2. The Best Of The Performance Values Of The Algorithms That Are Run 30 Times On 10 Mr Images RI↑
Best Values GCE↓
VOI↓
Kmeans
0,849368287
0,055132484
0,612579521
Lloyds LloydsKmeans PSO Clustering GA Clustering Jaya
0,841362985
0,055293512
0,63060031
0,841362985
0,055293512
0,63060031
0,964014663
0,025229639*
0,278655924*
0,035782077
0,287130326
0,032405018
0,279268352
0,963406155 0,964117907
*
(b)
(c)
(d)
(e)
(f)
(g)
(h)
VOI↓
* Best results are marked.
Algorithm
(a)
* Best results are marked.
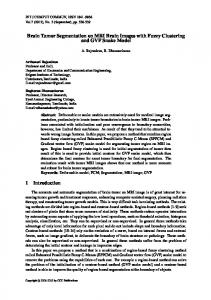
Fig 1: For MR image I; (a) Original MR image, (b) Human segmentation result used for the comparison, (c) Image after KMeans, (d) Image after Lloyd’s, (e) Image after Lloyd’s-Kmeans, (f) Image after PSO, (g) Image after GA, (h) Image after Jaya.
(a)
(b)
(c)
(d)
(e)
(f)
Table 3. Average, Minimum And Maximum Operating Time Of The Algorithms That Runs 30 Times On 10 Mr Images Algorithm
Ortalama
Time Comparisons Minimum Maksimum
Kmeans
0,04908606
0,010719928
0,138891245
Lloyds LloydsKmeans PSO Clustering GA Clustering Jaya
0,036079251
0,035111112
0,047496997
0,036032711
0,035273277
0,040450363
0,029637054
0,028139346
0,045329867
0,021302079*
0,020141668*
0,029649382*
0,880973572
0,873014976
0,898927257
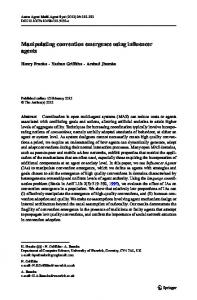
(g) (h) Fig 2: For MR image VI; (a) Original MR image, (b) Human segmentation result used for the comparison, (c) Image after KMeans, (d) Image after Lloyd’s, (e) Image after Lloyd’s-Kmeans, (f) Image after PSO, (g) Image after GA, (h) Image after Jaya.
5. CONCLUSION
* Best results are marked.
The best segmentation results according to the GCE,RI and VOI values for 2 sample MR images from the outputs obtained as a result of the tests performed are shown in Figure 1,2.
The data obtained as a result of the tests performed have shown that a more stable segmentation was performed by running Lloyd’s algorithm with the K-means algorithm. However, this stability may cause being stuck at the local minimum point. PSO clustering, GA clustering and Java optimisation algorithms moved relatively more unstable in the search space, however, better results could be found. While Jaya optimisation algorithm is in the worst state in terms of time succession, PSO and GA clustering studies came to a conclusion more quickly when compared to other algorithms in terms of time complexity.
39
International Journal of Computer Applications (0975 – 8887) Volume 155 – No 3, December 2016 The PSO algorithm achieved a conclusion in a relatively longer time than the GA algorithm, while its results obtained are better when compared to GA. With this study, certain algorithms that can be used in the segmentation process were compared, and the basis was prepared for future studies.
6. REFERENCES [1] Kasiri, K.; Dehghani, M.J.; Kazemi, K.; Helfroush, M.S.; Kafshgari, S., "Comparison evaluation of three brain MRI segmentation methods in software tools," in Biomedical Engineering (ICBME), 2010 17th Iranian Conference of , vol., no., pp.1-4, 3-4 Nov. 2010, J. O. and Abel, J. S., ``Bark and ERB Bilinear Trans¬forms'', IEEE Trans. Speech and Audio Proc., 7(6):697-708, 1999. [2] Duraisamy, M.; Jane, F.M.M., "cellular neural network based medical image segmentation using artificial bee colony algorithm," in Green Computing Communication and Electrical Engineering (ICGCCEE), 2014 International Conference on , vol., no., pp.1-6, 6-8 March 2014 [3] Koley, S.; Majumder, A., "Brain MRI segmentation for tumor detection using cohesion based self merging algorithm," in Communication Software and Networks (ICCSN), 2011 IEEE 3rd International Conference on , vol., no., pp.781-785, 27-29 May 2011 [4] Rostami, M.T.; Ghasemi, J.; Ghaderi, R., "Neural network for enhancement of FCM based brain MRI segmentation," in Fuzzy Systems (IFSC), 2013 13th Iranian Conference on , vol., no., pp.1-4, 27-29 Aug. 2013 [5] Si, T.; De, A.; Bhattacharjee, A.K., "Brain MRI segmentation for tumor detection using Grammatical Swarm based clustering algorithm," in Circuit, Power and Computing Technologies (ICCPCT), 2014 International Conference on , vol., no., pp.1196-1201, 20-21 March 2014 [6] Alia, O.M.; Mandava, R.; Aziz, M.E., "A hybrid Harmony Search algorithm to MRI brain segmentation," in Cognitive Informatics (ICCI), 2010 9th IEEE International Conference on , vol., no., pp.712-721, 7-9 July 2010 [7] Hasanzadeh, M.; Kasaei, S., "Multispectral brain MRI segmentation using genetic fuzzy systems," in Signal Processing and Its Applications, 2007. ISSPA 2007. 9th International Symposium on , vol., no., pp.1-4, 12-15 Feb. 2007 [8] Jianwei Liu; Lei Guo, "A New Brain MRI Image Segmentation Strategy Based on K-means Clustering and SVM," in Intelligent Human-Machine Systems and Cybernetics (IHMSC), 2015 7th International Conference on , vol.2, no., pp.270-273, 26-27 Aug. 2015 [9] Jianwei Liu; Lei Guo, "A new brain MRI image segmentation strategy based on wavelet transform and Kmeans clustering," in Signal Processing, Communications and Computing (ICSPCC), 2015 IEEE International Conference on , vol., no., pp.1-4, 19-22 Sept. 2015
IJCATM : www.ijcaonline.org
[10] Sinha, K.; Sinha, G.R., "Efficient segmentation methods for tumor detection in MRI images," in Electrical, Electronics and Computer Science (SCEECS), 2014 IEEE Students' Conference on , vol., no., pp.1-6, 1-2 March 2014 [11] B. H. Menze et al., "The Multimodal Brain Tumor Image Segmentation Benchmark (BRATS)," in IEEE Transactions on Medical Imaging, vol. 34, no. 10, pp. 1993-2024, Oct. 2015. [12] http://www2.imm.dtu.dk/projects/BRATS2012/ [13] Cabria, I.; Gondra, I., "Automated Localization of Brain Tumors in MRI Using Potential-K-Means Clustering Algorithm," in Computer and Robot Vision (CRV), 2015 12th Conference on , vol., no., pp.125-132, 3-5 June 2015 [14] Badmera, M.S.; Nilawar, A.P.; Karwankar, A.R., "Modified FCM approach for MR brain image segmentation," in Circuits, Power and Computing Technologies (ICCPCT), 2013 International Conference on , vol., no., pp.891-896, 20-21 March 2013 [15] Nguyen Duong Trung Dung; Huynh Thi Thanh Binh, "Using contour information for image segmentation," in Soft Computing and Pattern Recognition (SoCPaR), 2013 International Conference of , vol., no., pp.258-263, 15-18 Dec. 2013 [16] Xiaofang Wang; Yuxing Tang; Masnou, S.; Liming Chen, "A Global/Local Affinity Graph for Image Segmentation," in Image Processing, IEEE Transactions on , vol.24, no.4, pp.1399-1411, April 2015. [17] Han, J., and Kamber, M., (2006), Data Mining Concepts and Techniques, Morgan Kauffmann Publishers Inc. [18] AjalaFunmilola A, Oke O.A, Adedeji T.O, Alade O.M, Adewusi E.A, " Fuzzy k-c-means Clustering Algorithm for Medical Image Segmentation", Journal of Information Engineering and Applications, ISSN 22245782 (print) ISSN 2225-0506 (online) Vol 2, No.6, 2012. [19] Greg Hamerly and Jonathan Drake. Accelerating Lloyds algorithm for k-means clustering. In Partitional Clustering Algorithms, pages 41{78. Springer, 2015. [20] Kennedy, J., Eberhart, R., 1995, Particle Swarm Optimization, Proc. IEEE Intl. Conf. on Neural Networks, 1995 Perth Australia, Piscataway NJ: IEEE Service Center, 1942-1948. [21] Eberhart, R., Shı, Y., 2001, Partical Swarm Optimization: Developments, Applications and Resources, Proc. IEEE Int'l Conf. on Evolutionary Computation, 2001 Seoul Korea, Piscataway, NJ: IEEE Service Center, 81-86. [22] Rao R.V., 2016, Jaya: a simple and new optimization algorithm for solving constrained and unconstrained optimization problems, Int. J. Ind. Eng. Comput. 7 (1). [23] Sathya, B., and R. Manavalan. "Image segmentation by clustering methods: performance analysis." International Journal of Computer Applications 29.11 (2011).
40