http://dx.doi.org/10.5755/j01.eee.19.5.1440
ELEKTRONIKA IR ELEKTROTECHNIKA, ISSN 1392-1215, VOL. 19, NO. 5, 2013
Broadband PLC Network Cross-Layer Simulation in Accordance with the IEEE P1901 Standard A. Gogic1, A. Mujcic1, M. Zajc2, N. Suljanovic1 Faculty of Electrical Engineering, University of Tuzla, Franjevacka 2, 75000 Tuzla, Bosnia and Herzegovina 2 Faculty of Electrical Engineering, University of Ljubljana, Tržaška 25, 1000 Ljubljana, Slovenia
[email protected] 1
II. PLC TECHNOLOGY EVOLUTION
Abstract—This paper presents the discrete-event simulator of the low-voltage broadband power line communication (BPLC) access network in accordance with the IEEE P1901 standard. The proposed simulator enables the cross-layer simulation of the physical (PHY) and medium access control (MAC) layer. The performance of the digital communication techniques at the physical layer and the characteristics of the shared medium are integrated at the MAC layer through the probability of the bit error. The proposed simulator was applied in order to estimate the throughput in the simple BPLC network. For the selected set of parameters at the MAC and PHY layer in the test network, the simulator recorded average download throughput of 900kbps, registration time of 36ms and packet delivery ratio of for 0.98 between each station and the HE.
During the last decade, communications over power lines evolved to a mature technology providing reliable and fast data transmission. PLC technology is used in the wide range of applications, from the in-home LAN connectivity and broadband Internet access for residence users to data transmission for power utility purposes. Power utilities found this technology attractive since it ensures their independence from telecom operators and requires no additional investments in the cable installations. Furthermore, PLC systems are recognized as fundamentally important in the on-going process of the power grid modernization known as smart grid [3]. According to the exploited frequency band and provided bit rates, the PLC systems are categorized into three categories: ultra narrow-band (UNB), narrow-band (NB) and broad-band (BB) [3]. UNB PLC utilizes frequency band 0.3-3 kHz for data transmission at rates below 100 bps and long distances. NB PLC operates in the range up to 500 kHz. In this range, CENELEC standard defines 3-148.5 kHz band while US FCC allows 10-490 kHz band. Standards IEEE 1901.2, ITU-T G.hnem, PRIME and G3-PLC define data transmission at high rates (up to 500 kbps) in the band bellow 500 kHz. BB PLC systems ensure data transmission at Mbps rate, but in the broad frequency range 1.8-250 MHz in general [3]. Examples of standards which describe BB PLC communications at PHY and MAC layer are IEEE P1901 [1], HomePlug 1.0 and ITU-T G.hn. The listed standards are intended for in-house networking, while IEEE P1901 is also aimed for the last-mile access to the end user over the low-voltage (LV) power grid.
Index Terms—Cross-layer design, media access control, powerline communication, smart grid.
I. INTRODUCTION In this paper, we propose a discrete-event simulator that simulates behaviour of one cell in the broadband power line communication (BPLC) access network at the media access (MAC) layer, in compliance with the standard IEEE P1901 [1]. The major advantage of the cross-layer simulation approach is the analysis of influence of digital modulation and coding techniques on the system performance at the MAC layer. Namely, probability of the bit error rate Pe as a function of the energy per bit to noise power spectral density ratio Eb/N0 is simulated in MATLAB and stored for different distribution grid topologies and characteristics. Obtained functions are further used for the packet loss probability determination at the MAC level. The MAC-level simulator is developed using the open-source OMNeT++ [2] simulation framework and represents a useful tool for estimation of the power line communication (PLC) system performance. In the further subsections we briefly describe the PLC technology, its role in the smart grid concept and approaches to PLC network simulations.
III. PLC SYSTEM AND ITS MODELLING Power distribution network is characterized by intensive signal distortion and attenuation, primarily due to numerous branching and impedance fluctuations [4]. Noise in PLC channel is impulsive, with the present radio interference [5]. Such channel characteristics significantly impairs data transmission rate and range. Furthermore, power grid is a shared communication medium and communication characteristics depend on a number of users. Mechanisms
Manuscript received April 02, 2012; accepted October 23, 2012. This work was partially supported by ARRS, Slovenia, under the Scientific Program P2-0246 and ITEA2 09030 project IMPONET.
83
ELEKTRONIKA IR ELEKTROTECHNIKA, ISSN 1392-1215, VOL. 19, NO. 5, 2013 for media access and collision detection must be implemented. The above listed standards describe PLC system at PHY and MAC layer, addressing mentioned problems. According to these standards, nodes in the PLC system are assigned different functionalities, such as transceiver, repeater and router, in order to accomplish the functionality of the overall system. Operation regime of all stations strongly depends on the grid topology, power cable characteristics and user behavior patterns. Investigation of different scenarios applied in the PLC system requires comprehensive simulations at both PHY and MAC layer. Performance analysis of the MAC protocols used in PLC systems have been reported in [6] together with modeling methodology of the MAC layer protocols, later further refined and modified in the IEEE P1901 standard. Simulations are needed to obtain the access network performance for variations of number of users, user locations and changes in the network topology, resulting in simpler and lower cost installation process.
The combination of SNID and TEI is an address of a station. End-to-end communication between the HE and a station in the access cell is likely to occur in two or more hops via RPs affiliated with the same HE. A station in the access cell receives the connectivity level information from all neighbouring stations and decides which station to utilize as a RP (next hop) for communications with the HE. A structure of RPs will change dynamically with the variations of the power grid conditions.
IV. IEEE P1901 STANDARD FOR THE BROADBAND PLC
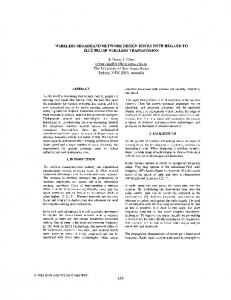
The IEEE P1901 standard defines mechanisms at MAC layer to ensure best-effort service as well as traffic with a required quality of service (QoS). The access to the shared media is defined by the protocol that exploits MAC cycles (Fig. 2).The duration of the MAC cycle is synchronized with the power frequency (50/60 Hz) period in order to improve PLC system performance due to power-line cyclic nature of noise. MAC cycles are synchronized in the network and each cycle is divided into the three regions (Fig. 2). The first is the beacon region which contains information required for the synchronization. In the second period (CSMA region) neighbouring stations compete for the media access using the carrier sense multiple access with collision avoidance (CSMA/CA) mechanism. The random backoff algorithm is utilized in order to reduce the collision probability. The CSMA/CA algorithm defined by IEEE P1901 also determines contention priorities for the high-priority traffic implementing two proposed mechanisms: priority resolution symbols (PRS) and interframe space (IFS).HE determines which mechanism should be used. In the proposed simulator the PRS mechanism is implemented.
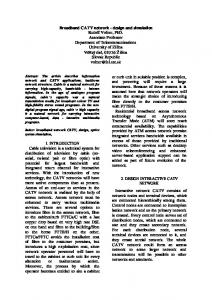
Fig. 1. BPLC access cell topology example.
IEEE P1901 is a comprehensive standard which defines both broadband access and in-home PLC networks using the frequency range from 2 to 30 MHz, in terms of addressing, media access mechanisms and collision avoidance, synchronization and quality of service assurance [1], [7], [8]. According to the IEEE P1901 BPLC access network is divided into the access cells. Each access cell contains a group of stations administrated by the head end (HE). The HE establishes a connection to WAN and communicates to HEs in the same grid [7]. An example of the BPLC access cell topology is presented in Fig. 1. All stations in the cell synchronize their local clocks with the HE clock or with the signals emitted by the neighbouring stations. The HEs are addressed using the short network identifications (SNIDs), which are unique and used as an identifier of a given access cell [7], [8]. All stations except the HE, in the access cell are passing through a registration process, where the HE assigns network terminal unit (NTU) with the terminal equipment identifier (TEI) and authorizes stations for different levels of services.
Fig. 2. MAC cycle according to the IEEE P1901 standard.
The IEEE P1901 standard defines several packet types which can be interchanged between stations at the MAC layer (Fig. 2): beacon, start of frame (SOF), selective acknowledgement (SACK), reverse start of frame (RSOF), SOUND, request to send (RTS) and clear to send CTS packets. After the packet emission, the transmitting station releases the medium for a short period (Fig. 2). The pause
also known as interframe space provides a sufficient amount of time for the receiver to interpret the received packet. Every station in the BPLC access network implements the algorithm for the selective acknowledgment (SACK) at the MAC layer. The SACK algorithm is implemented in the proposed simulator and provides mechanism for the reliable transmission of packets by utilization of acknowledgements
84
ELEKTRONIKA IR ELEKTROTECHNIKA, ISSN 1392-1215, VOL. 19, NO. 5, 2013 active nodes, interconnected by links which are characterized by the transmission delay only. A passive node has two or more gates, connected to the links (Fig. 4). It corresponds to a branching in the LV power grid and basically forwards MAC packets to the remained connections of a given passive node. In such way, the packet flooding of the BPLC network is achieved. A signal representing the MAC packet is divided at each branching and its power is significantly reduced. Passive nodes check the packet origins and discard packets whose signal power is below the threshold determined by the receiver sensitivity (Fig. 4).
(SACK packets) and timeouts. The contention-free access which guaranties some bandwidth and QoS is provided in the third period of the MAC cycle exclusively by application of TDMA mechanism [6]. V. SIMULATOR CONCEPT The proposed simulator is designed to allow researchers and engineers to effectively investigate BPLC access network performance, such as availability of the stations in the network and bandwidth, for different network characteristics and topologies. Since LV and medium voltage (MV) power grids represent a shared medium, our efforts are focused on the communication network behaviour at the MAC and PHY layers as specified by IEEE P1901 standard. Simulator design incorporates both MAC layer protocols and PHY layer characteristics. The basic simulator architecture is given in Fig. 3.The MAC layer of the BPLC network is modelled and simulated using the simulation framework OMNeT++ [2].
Fig. 4. Passive node model.
The signal power threshold in each passive node is computed for all possible packet origins using MATLAB. These thresholds are computed whenever network topology is modified. For an arbitrary passive node, power P of the received signal is =
|
|
,
(1)
where S(ω) is the power spectral density of the signal at the transmitter (determined by the used tone map in of OFDM) and H(ω) is the frequency response of the channel between the transmitter (packet origin) and considered passive node. The frequency response is computed for the multiple branching in MATLAB and these values are further used in the calculations implemented in the passive nodes (Fig. 4). The active node corresponds to a model of the station in the BPLC network and represents the processing core of the proposed simulator (Fig. 5). In the case that branching is present at the station, an additional passive node is used to provide the branching. Active nodes are capable to generate traffic with priorities defined by the P1901, but also to listens the channel and to generate the corresponding response for a received message. These nodes implement functionality of the HE, RP and NTU.CSMA/CS with priorities, according to the specifications given in the standard P1901, is implemented as a functionality of this module. The active node listen the channel and captures the incoming packets. If an error in the received packet is detected, the packet is dropped. Detection of the packet error is done by means of the bit error rate of a given end-to-end connection. Probability of the error in the received packet Pp is computed in the active node using the bit error probability Pe, as in [9]
Fig. 3. LV BPLC simulator architecture.
Performance of the BPLC network at the PHY layer is implemented through the probability of bit error rate (Pe) as a function of the signal-to-noise ratio (SNR) for all links between stations in the network. Functions Pe=f(SNR) are simulated in MATLAB in accordance with the specifications given by IEEE P1901, taking into account power cable parameters, noise characteristics, reflections and impedance fluctuations [1], [4]. The BPLC network model is composed of passive and
= 1− 1−
,
(2)
where Nb is the number of bits per packet. If the channel noise is considered as additive white Gaussian noise (AWGN), packet errors are statistically uncorrelated. In
85
ELEKTRONIKA IR ELEKTROTECHNIKA, ISSN 1392-1215, VOL. 19, NO. 5, 2013 such case, packet dropping is made according to the uniform distribution with the probability Pp.In other words, all packets coming to the station from the same origin are equally probable to be discarded. Packets coming from the sources at different locations will be dropped with different probabilities. Comprehensive simulations of the end-to-end communication links between all stations in the BPLC network are completed for a range of SNRs. Functions Pe=f(SNR) (bit error rate vs SNR) are further used in the OMNeT++ model for the purpose of the packet error check and drop (Fig. 5). We observe that characteristics of the BPLC channel are rather implemented inside the active nodes instead as a part of the OMNeT++ connections. The error in the received packet can also appear due to the collision. Collision occurs if two or more stations begin to transmit simultaneously. Since the event in the simulator is
generated when the complete packet is received, the medium cannot be characterized as occupied until the end of the transmission. Therefore, this event cannot be utilized for the collision detection. The collision detection is implemented in the proposed simulator in the manner that the link between two neighbouring stations is emulated by two simplex connections. The transmitting station emits the packet which is delivered to the receiving stations with transport delays. Each time the packet is received by the other station, an event is generated and the sending connection of a receiving station is marked as occupied for the packet duration interval. The receiving station can start to transmit a new packet at any moment, if the sending connection is not marked as occupied. In the case that the event of the received packet is generated during the transmission interval, a collision is detected and both packets are dropped.
Fig. 5. Active node (station) model.
A collision also occurs if the received packet is different from the expected response. Additionally, a collision occurs if two or more stations select the same back-off value in the CSMA/CA procedure. Correctly received packets are further forwarded to the block in the model which analyzes the packet content. If the received packet corresponds to the management message, the station generates the response (Fig. 5). If the received message is the SACK packet, however, the station can retransmit the previously transmitted message or generate a new message. Each generated message is classified according to its priority and queued into the one of four priority queues denoted as CA0CA3 (Fig. 5). The highest priority queue is the CA3 queue. Using the first in - first out (FIFO) mechanism, packets are dequeued from the queues in accordance with their priorities. Selected message from the queue is formatted in compliance with the P1901 standard and according to the channel access rules in the CSMA region [1]. Before the simulation process equivalent to the physical transmission of the selected packet is initiated, the station has to acquire the channel access. In order to access the channel with a given priority, the station emits the priority resolution symbols during the priority resolution period. There are two types of the priority resolution symbols: PRS0 and PRS1. The two priority resolution symbols together correspond to the one of four types of the channel access priorities, associated with the four priority queues CA0CA3. Each station with the pending packet of the priority
equal or higher than CA1 emits the PRS0 symbol. Stations with the lower priority defer and wait for the next priority resolution period. The station which has already sent PRS0 symbol and whose pending packet priority equals the CA3, emits the PRS1 symbol. Further, the stations with the highest priority traffic compete for the channel access using the PRS/IFS CSMA algorithm. At this point, simulator implements contention access to the medium based on the CSMA with priorities. Contentionfree access, utilizing TDMA, is not implemented at this stage. The procedure of station registration, in accordance with the standard P1901, is also embedded in the simulator. VI. SIMULATION RESULTS The proposed simulator was used to simulate the BPLC access cell network with five stations (Fig. 6).
Fig. 6. LV BPLC test network.
86
ELEKTRONIKA IR ELEKTROTECHNIKA, ISSN 1392-1215, VOL. 19, NO. 5, 2013 The S1 represents the HE, while the remaining stations from S2 to S5 correspond to RP/NTU. The frequency response of the LV cables are computed as [4] =
/"
,
for the throughput for the selected set of the communication parameters in continuous transmission is 10.69 Mbps and can be computed as #$ =
(3)
%&' %()*+
,
(4)
where the Nb is the number of bits per OFDM symbol, TCP and TOFDM duration of the cyclic prefix and OFDM symbol, respectively. The throughput is reduced due to the emission of the priority resolution symbols, pause in the contention region, emission of the preamble prior to the packet payload and the existence of the pauses after the emission of each packet.
where parameters a0, a1, k and n are adopted from [4], l is the cable length and c0 is the speed of light. The frequency response of the path between arbitrary two stations is calculated using four-port networks and A parameters [10]. The path S2-S3 is 200 m long and represent the link with the highest attenuation (Fig. 7). We also observe ripples in the frequency responses, caused by the branching. The same computation methodology is used for determination of the frequency responses between the branching (passive) nodes. These results are further used for the packet dropping functionality in the passive nodes. Computation of the bit error probability for a given path requires simulation of the point-to-point communication system (Fig. 8) in accordance with the specifications given in IEEE P1901. In the simulated scenario, we utilized 544 OFDM carriers from set of possible 2048. Some of the OFDM carriers cannot be used due to electromagnetic compatibility regulations. We utilized 544 carriers so that one OFDM symbol can carry whole MPDU payload. Turbo convolutional coder, with the code rate 1/2, is applied and each OFDM symbol is preceded by the cyclic prefix of 756 samples. Probabilities of the bit error are computed using Monte Carlo simulations in the MATLAB for the point-topoint links between all stations in the simulated network (Fig. 9). Noise is considered as AWGN. The Pe=f(SNR) functions are loaded in the OMNeT++ during the initialization phase and further used for the calculation of the packet error probability with an assumption that the signal power level on the transmitter side is 16.23 dBm and noise level is -8 dBm.
Fig. 8. IEEE P1901 transceiver block diagram.
Fig. 9. The probability of bit error for different links.
The preamble is used for carrier sensing, synchronization and equalization purposes at the receiver side. All these factors reduce the effective throughput to the value of 2.04 Mbps which is theoretical limit for the BPLC network containing two stations only. In our test network there are five stations and the theoretical limit for the throughput which each station can achieve on a fair share basis is 417.79 kbps. In Fig. 9, b we observe that upload throughput of the station S2 (red curve) varies around 350 kbps. Download throughput of the station S2 (Fig. 10) is approximately 900 kbps and represents the cumulative download throughput of the medium. The other important parameter is the registration time. The registration procedure is composed of the three phases: association, authorization and authentication. During these phases, the station obtains TEI address, network encryption and membership key, from the HE. Average duration of each phase is presented in
Fig. 7. Frequency responses of the paths in the test network.
We found the following quantities as important for the analysis of the BPLC access network behaviour: throughput (upload and download), registration time and packet delivery ratio [11]. Simulation results are computed with the time step of 40 ms. Priority queues are enqueued every millisecond in accordance with the Poisson distribution. Each priority queue is characterized by its own parameter λ determining the packet enqueuing rate. The theoretical limit
87
ELEKTRONIKA IR ELEKTROTECHNIKA, ISSN 1392-1215, VOL. 19, NO. 5, 2013 network behaviour at both PHY and MAC layer. The simulator allows detailed analysis of different digital communication techniques at the PHY layer and their influence on the performance at the MAC layer. In compliance with the IEEE P1901, the CSMA/CA algorithm with priorities, the registration procedure and the algorithm for the selective acknowledgement have been fully implemented. For a given network topology and the set of parameters at the physical layer, the simulator will estimate the duration of the registration procedure, available throughput between HE and any given station in the CSMA region and packet delivery rate at the MAC layer. The simulator is the environment for investigations of the routing and repeating algorithms at the MAC layer in the BPLC network. The simulated performance of the BPLC network can significantly reduce the overhead costs in the planning of network. Furthermore, the simulator can be important for the analysis of the PLC system performance within smart grid research as well as for the performance analysis of the BPLC systems used as last mile access network. Detailed simulation of the BPLC devices under different scenarios are important for the development of the plug and play equipment which will reduce installation costs.
Fig. 11. Each procedure phase requires approximately 10 15 ms starting from all unregistered stations.
Fig. 10. The throughput between the S2 and the HE.
Example of such event is a power outage when the all stations are rebooted.
REFERENCES [1]
I. P. W. G., “2010 IEEE standard for broadband over power line networks: Medium access control and physical layer specifications IEEE P1901”, Tech. Rep., Dec. 2010, p. 1586. [2] A. Varga, “The OMNeT++ discrete event simulation system”, in Proc. of the European Simulation Multiconference (ESM), 2001, pp. 319–324. [3] S. Galli, A. Scaglione, W. Zhifang, “For the grid and through the grid: The role of power line communications in the smart grid”, in Proc. of the IEEE, 2011, vol. 99, no. 6, pp. 998–1027. [Online]. Available: http://dx.doi.org/10.1109/JPROC.2011.2109670 [4] M. Zimmermann, K. Dostert, “A multipath model for the powerline channel”, IEEE Trans. Communication, vol. 50, no. 4, pp. 553–559, 2002. [Online]. Available: http://dx.doi.org/10.1109/26.996069 [5] Y. H. Ma, P. So, E. Gunawan, “Performance analysis of OFDM systems for broadband power line communications under impulsive noise and multipath effects”, IEEE Trans. Power Del., vol. 20, no. 2, pp. 674–682, 2005. [Online]. Available: http://dx.doi.org/10.1109/TPWRD.2005.844320 [6] H. Hrasnica, A. Haidine, “Modelling MAC layer for the powerline communication networks”, in Proc. of the SPIE's (The International Society for Optical Engineering) symposium on Information Technologies, Internet Performance and Control of Network Systems, 2000, pp. 5–8. [7] M. M. Rahman, S. Choong, L. J. Lee, M. Razzaque, J. Kim, “Medium access control for power line communications: An overview of the IEEE 1901 and ITU-T G.hn Standards”, IEEE Communications Magazine, vol. 49, no. 16, pp. 183–1191, 2011. [Online]. Available: http://dx.doi.org/10.1109/MCOM.2011.5784004 [8] S. Goldfisher, S. Tanabe, “IEEE 1901 access system: An overview of its uniqueness and motivation”, IEEE Communications Magazine, vol. 48. no. 10, pp. 150–157, 2010. [Online]. Available: http://dx.doi.org/10.1109/MCOM.2010.5594690 [9] G. Bumiller, “Power-line physical layer emulator for protocol development”, in Proc. of the International Symposium on Power Line Communications and Its Applications (ISPLC), 2004, pp. 212– 217. [10] S. Galli, T. A. Banwell, “Novel Approach to the Modelling of Indoor Power Line Channel - Part II: Transfer Function and Its Properties”, IEEE Transaction on Power Delivery, vol. 20, no. 3, pp.1869–1878, 2005. [Online]. Available: http://dx.doi.org/10.1109/TPWRD. 2005.848732 [11] “Report on the implementation MAC-Level OPERA PLC network simulator”, OPERA Project number 026920, Technische Universitat Dresden (TUD), Design of Systems on Silicon (DS2), Tech. Rep., 2008, p. 46.
Fig. 11. Average duration of registration procedure.
We computed the packet delivery ratio (PDR) for the test network. PDR is the ratio of successfully received packets and total number of the sent packets to a given station. This parameter is important metric for the packet forwarding and the best route selection [11]. In Fig. 12 we presented PDRs of all stations in the test network.
Fig. 12. Packet delivery ratio (PDR).
VII. CONCLUSIONS This paper proposed the OMNeT++ based BPLC network simulator implementing IEEE P1901 standard. The crosslayer approach enables the simulator to simulate the BPLC
88