Broken Rotor Bar Fault Detection in Induction Motors Using Starting Current Analysis Randy Supangat, Nesimi Ertugrul, Wen L. Soong, Douglas A. Gray, Colin Hansen and Jason Grieger University of Adelaide School of Electrical and Electronic Engineering Adelaide, Australia
[email protected]
Acknowledgements This project is funded by the Australian Research Council Linkage Grant No. LP0453951. The authors would like to acknowledge the valuable support provided by National Instruments Corporation and the assistance provided by the workshop staff at the School of Electrical and Electronic Engineering.
Keywords diagnostics, electrical machine, induction motor, signal processing
Abstract Fault detection based on a common steady-state analysis technique, such as FFT, is known to be significantly dependant on the loading conditions of induction motors. At light load, it is difficult to distinguish between healthy and faulty rotors because the characteristic broken rotor bar fault frequencies are very close to the fundamental component and their amplitudes are small in comparison. As a result, detection of the fault and classification of the fault severity under light load is almost impossible. In order to overcome this problem, this paper investigates the detection of rotor faults in induction machines by analysing the starting current using a newly developed quantification technique based on the wavelet transform. The analysis technique applies the wavelet transform to the envelope of the starting current. The envelope extraction is used to remove the strong fundamental component, which overshadows the characteristic differences between a healthy motor and a faulty motor with broken rotor bars. The results are then verified using tests on a machine with a varying numbers of broken bars. The effects of initial rotor position, supply imbalance and loading are also investigated.
1. Introduction Induction motors are inherently reliable and require minimum maintenance. However, like other motors, they eventually deteriorate and fail. This gives rise to the need for cost effective preventive maintenance based on condition monitoring, which can be addressed by monitoring and analysing the real-time signals of the motors. There has been a substantial amount of research over the past 15 years on the development of various steady-state condition monitoring techniques, which are mainly based on the fast Fourier transform (FFT) [1-6]. FFT analysis is usually applied when the motor is operating in the steady-state. Then, a set of measurements is taken over a period of time and is analysed to obtain the signal frequency components with any desired frequency resolution. Broken rotor bars are one of the easiest induction motor faults to detect using steady-state stator current condition monitoring. This is based on monitoring the amplitudes of the double slip frequency sidebands of the fundamental supply frequency in the current spectrum [3]. It has been shown that the greater the rotor bar fault severity, the higher is the amplitude of these sidebands. However, the sideband amplitudes are also sensitive to motor loading [1]. For example at no load or at light loads, these broken rotor bar sidebands are undetectable due to the small rotor currents under this condition.
Furthermore, a broken rotor bar fault at an early stage or partially broken rotor bars, which can lead to a larger failure or even be catastrophic, may not be detectable even under full load conditions. Therefore, there is a strong need to develop condition monitoring techniques to address these issues to allow earlier detection of rotor faults. During direct-on-line (DOL) starting, the rotor current of the induction machine is very high, typically 5 to 6 times rated current. Under these conditions, rotor faults should be much more evident than under normal running conditions. There is also the advantage that the starting current is less sensitive than the running current to the level of motor load, and so reliable data analysis can be obtained even with motors with no mechanical load. The two drawbacks in dealing with the starting current are firstly the motor speed is constantly changing during starting which means the fault related signal frequency components are changing in both amplitudes and frequency, and secondly that the starting current only occurs for a short time. The starting time, which depends upon the total inertia of the motor and the load, may vary from a fraction of a second for small motors, up to several seconds for large motors. Therefore, due to the transient nature of the signal, conventional FFT analysis is not suitable for analysing starting currents. Although Short-Time Fourier Transform (STFT) can be used for analysing transient signals using a time-frequency representation, it can only analyse the signal with a fixed sized window for all frequencies, which leads to poor frequency resolution. However, wavelet techniques can overcome this problem by using a variable sized window. A wavelet technique for detecting broken rotor bars in induction motors has been reported in [7,8]. In these studies, [7] uses an adaptive signal cancellation technique and wavelet coefficients, and [8] utilises a wavelet ridge method in order to distinguish healthy and faulty motors. However, these earlier studies do not investigate the effect of the degree of fault (such as partial or multiple broken rotor bars), motor loading, the effects of the initial rotor position, supply imbalance, and the differences between the three phase currents. Furthermore, the studies do not investigate the variability of the technique under multiple motors of the same condition. This paper aims to address these issues and proposes an improved technique for effective broken bar fault detection in induction motors.
2. Description of the wavelet methods The wavelet transform is governed by
C (a, φ ) =
∞
∫ f (t )Ψ (a, φ , t )dt ,
(1)
−∞
where C is the wavelet transform, a is the wavelet scale, φ is the wavelet position, f(t) is the signal, and Ψ is the wavelet function [9]. Equation (1) shows that the main concept of the wavelet transform is to divide a signal into its various scaled and shifted versions of a wavelet, in a similar fashion that the Fourier transform divides a signal into its sinusoidal components of various amplitudes and frequencies. A high scale wavelet corresponds to a "stretched" wavelet, which has a slow rate of change and hence low frequency. On the other hand, a low scale wavelet corresponds to a "compressed" wavelet with a rapid changing detail and hence high frequency. The wavelet function used for the analysis is “db8” from the Daubechies family. There are two types of wavelet techniques, the continuous wavelet transform (CWT) and the discrete wavelet transform (DWT), which can be used to analyse the induction motor starting current. The CWT utilises a continuous range of scales and shifts at the expense of increased computational time, whereas the DWT utilises a discrete range (in power of 2) of scales and shifts. Since the CWT utilises a continuous range, it is more accurate than the DWT counterpart and hence the CWT is the technique used in this paper. However, DWT may be more beneficial in practical applications because of the shorter computational time, which is of the order of 2nm (where n=number of scales and m=number of shifts).
The operation of the wavelet transform is illustrated in Figure 1. At each level, the signal is separated using low and high pass filters into a "detail" component, which is the high frequency components (in terms of the wavelet used), and an "approximation" component, which is the low frequency components (in terms of the wavelet used), by correlating the scaled and shifted versions of the wavelet. The correlation between the signal and the wavelet at each level of scaling and shifting is termed the wavelet coefficient. HPF
Detail
LPF
Approximation
Signal
HPF
Detail
LPF
Approximation
…
Figure 1 - Multiple level wavelet decomposition, where LPF and HPF are a low pass filter and a high pass filter, respectively, in terms of the wavelet used. In this paper the wavelet transform is applied to the induction motor starting current and its envelope. The envelope of the signal, as will be explained in the later section, provides additional benefits about the transient characteristics of the starting current signal. Finally, the resulting wavelet coefficients are then compared with different degrees of broken rotor bars under various loading conditions.
2.1. Continuous wavelet transform (CWT) on the starting current The wavelet technique allows the analysis of a transient signal, such as the starting current of an induction motor, where a normal FFT would not be beneficial. The continuous wavelet transform (CWT) can be utilised to extract and analyse the transient characteristics of the starting current of an induction motor. Figure 2 shows an example where the CWT has successfully extracted the transient characteristics of starting currents and distinguished the differences, which are faintly visible in the wavelet plots, between healthy and faulty motors. Starting current of phase A (Faulty motor)
Starting current of phase A (Healthy motor)
50 amplitude (A)
amplitude (A)
50
0
-50 0
200
400 600 time(ms)
0
-50 0
800
scale
scale 2000
4000 sample
a
400 600 time(ms)
800
CWT (Faulty motor)
CWT (Healthy motor) 482 422 362 302 242 182 122 62 2
200
6000
482 422 362 302 242 182 122 62 2
2000
4000 sample
6000
b
Figure 2 – The starting current signal (top), sampled at 8 kHz, and the Continuous Wavelet transform (bottom) of the original signal (with 50Hz component): a healthy motor running at no load (a) and a faulty motor with 4 broken rotor bars running at no load (b). Figure 2 shows that there are two evident effects of a broken rotor bar fault on the starting current. The first effect of a broken rotor bar fault is that the starting current takes a longer time to decay and reach steady-state in comparison to a healthy induction motor. This is because an induction motor
with broken rotor bars has less torque and hence it takes longer to reach steady-state. However this effect cannot be used as a feature for distinguishing healthy and faulty motors because it can also be caused by changes in the inertia and the loading conditions of the motor. The second effect is apparent in the Continuous Wavelet Transform (CWT) plots. There are certainly observable differences between the CWT plot of a healthy motor and the CWT plot of a faulty motor with 4 broken rotor bars at samples around 1 to 2500 in Figure 2. These differences are suggested to be the identifying feature for detecting a broken rotor bar fault. However, these differences are being overshadowed by the strong fundamental 50 Hz component in the signal (as highlighted by the dashed lines in the figures), which does not have any useful information. Therefore, this 50 Hz component needs to be removed in order to have a more accurate analysis.
2.2. Continuous wavelet transform (CWT) on the envelope of the starting current Interestingly, the way to remove the strong fundamental 50 Hz component in the starting current signal and to get the transient characteristics is by extracting the envelope of the starting current signal. This is because a transient signal tends to have multiplicative signal components. For example, consider the transient signal shown in Figure 3. The figure shows that the example transient signal is made by a multiplication of two signal components, which are the fundamental signal component and the envelope of the transient signal. Clearly, if the fundamental component is to be removed, the component left in the transient signal is its envelope. A Fundamental Signal
Example of a Transient Signal
An Envelope Signal 1
0
-0.5
amplitude
amplitude
amplitude
0.8
0.5
0.5
x
0
-0.5
0.6 0.4 0.2 0
0
200
400
0
sample
200
400
100
sample
200
300
400 500
sample
Figure 3 – Transient signal and its components. In order to extract the envelope of a transient signal, the signal components in the frequency domain need to be considered. In the frequency domain, the transient signal (Figure 3a) is made by a convolution of the fundamental signal component and the envelope of the transient signal. This convolution introduces a skirt around the fundamental signal component. Therefore, extracting the envelope of a transient signal can be achieved by demodulating the fundamental signal component to base band and filtering the skirt, which is equivalent to the envelope of the transient signal in the time domain. x[n]
X
LPF
yI[n]
50 Hz
yI[n] + jyQ[n]
+ 90° X
LPF
yQ[n]
Figure 4 – Implementation flow diagram of the envelope extraction.
In the case of the starting current of an induction motor, the signal component which needs to be removed is the fundamental 50 Hz component. Therefore, the fundamental component is demodulated to base band and its skirt is filtered and extracted in order to obtain the envelope of the starting current signal. The process flow diagram is shown in Figure 4, where the starting current signal, x[n], is multiplied by cosine and sine 50 Hz sinusoids, which is the supply frequency estimated based on the data used. Then, the resulting real and quadrature components are filtered separately. Finally the magnitude of the real and quadrature components gives the envelope of the signal. Figure 5 shows the improvement obtained in applying the continuous wavelet transform (CWT) on the envelope of the starting current signal over applying it on the signal itself. Figure 5 shows that by applying the CWT on the envelope, the fundamental 50 Hz component has been successfully removed. As a result, a more accurate and precise transient analysis can be performed and investigated. Note that this process has also been tested on the other current phases where similar results are obtained.
20
0 0
Starting current envelope, faulty motor, no load 40 amplitude (A)
amplitude (A)
Starting current envelope, healthy motor, no load 40
200
400 600 time(ms)
20
0 0
800
scale
scale 2000
4000 sample
a
400 600 time(ms)
800
CWT (Faulty motor)
CWT (Healthy motor) 482 422 362 302 242 182 122 62 2
200
6000
482 422 362 302 242 182 122 62 2
2000
4000 sample
6000
b
Figure 5 – After the 50 Hz component is removed, the envelope (top) and the Continuous Wavelet transform (bottom) of the starting current given in Fig.2: a) For the healthy motor running at no load. b) For the faulty motor with 4 broken rotor bars running at no load. Figure 5 reveals another effect of a broken rotor fault. The effect can be seen from the starting current envelope plots, in which the faulty motor draws slightly less current than the healthy motor during starting. This is because there are effectively less rotor bars in the faulty motor. This is also the reason for the torque’s reduction in the faulty motor. Further examination of the CWT plots in Figure 5 shows that the starting current of a healthy motor exhibits two patterns under the wavelet analysis, where the first pattern corresponds to the initial part of the envelope and the second pattern corresponds to the end (discontinuity) of the signal, while a faulty motor with broken rotor bars exhibit an extra pattern between the 2 patterns. This extra pattern is proposed to be the identifying feature for distinguishing a healthy and a faulty motor.
2.3. Wavelet indicator The patterns described in the previous section are confirmed by results from wavelet analysis based on computer simulations of the starting current of the motor. The differences between the patterns of a healthy motor and the patterns of a faulty motor with 4 broken bars need to be quantified in term of numbers for a more convenient identification and possibly future automated condition monitoring system. These pattern differences are quantified by calculating the sum of all the absolute values of the wavelet coefficients between the first pattern, which corresponds to the initial part of the envelope,
and the second pattern, which corresponds to the end of the signal. Then, the resultant value is normalised against the number of samples used, the number of scales used, and the sum of the wavelet coefficients in the first pattern and the second pattern. In this paper, the square of this quantification value is termed as “wavelet indicator”. Figure 6 shows that wavelet indicator has successfully quantified the pattern differences and hence distinguished a faulty motor with broken rotor bars from a healthy one. The wavelet indicator of a faulty motor with 4 broken rotor bars (4 BRB) is consistently higher than the wavelet indicator of a healthy motor under various loading conditions. This finding shows a significant improvement over steady-state analysis methods, such as FFT analysis, where the fault detection is dependant on the loading conditions (i.e. the fault detection is inaccurate at light load). Power Magnitude of Wavelet Indicator (dB)
0 -10
Faulty motor with 4 BRB -20 -30 -40
Healthy motor -50 -60 0
20
40
60
80
100
120
Load (%)
Figure 6 – Wavelet indicator plot of various loading conditions between a healthy motor and a faulty motor with 4 broken rotor bars (BRB).
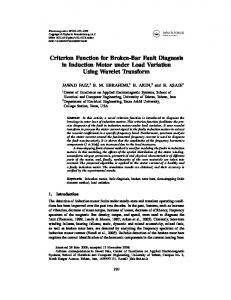
3. Experimental Results The experimental results given below were obtained using a purposely built test rig (Figure 7a) based on a high-speed data acquisition system (2 x DAQPAD-6052E boards from National Instruments, capable of simultaneous sampling at 5MHz) with custom written LabVIEW software (Figure 7b). Identical 2.2kW, 415V, 4 pole induction motors were used in this test. The motors were loaded by a separately-excited DC generator. The motors were installed on the test rig by using an advanced laser alignment tool (Optalign Plus from Prűftechnik) and a torque wrench (Norbar, set at 35Nm) in order to ensure the accuracy and the repeatability of the data obtained. During the test, two current sensors were attached to the motor and the sensor outputs were sampled simultaneously via an anti-aliasing filter, which was an 8th order Butterworth filter, with a cut-off frequency of 2 KHz.
a b c Figure 7 - Photographs of the motor test setup (a), the data acquisition and data analysis hardware (b), and the rotor cross-section showing the profile of the rotor bars (c). Experimental data of the motor starting currents is taken with healthy motors, healthy motors with an unbalanced supply, and faulty motors with varying degrees of broken bars. An unbalanced supply is simulated by inserting a resistor in series with one of the supply phases. The broken rotor bar fault is simulated by cutting a hole through the rotor bar at the end-ring using a small milling cutter and a partial broken rotor bar fault is determined by the amount of material removed from the rotor bar (see
Fig. 7c for the profile of the rotor bars). For example, 25% broken rotor bar means 25% of the rotor bar’s cross-sectional area is removed. A separately-excited DC machine with a resistive load is used to load the test machine. This produces a load torque which varies approximately linearly with motor speed. Thus for instance when the machine is started at full load, the load torque only reaches its rated value when the machine reaches rated speed. The % load given in the figures is estimated using the slip of the machine after the motor reaches the steady state operation. The experimental data, which is the starting current of the induction motors sampled at 8 kHz, is then analysed by using the wavelet technique described in the previous section. In order to show that the wavelet technique can be reliably used for detecting broken rotor bar faults, it is necessary to experimentally show that: • measurements are repeatable, • the changes in the wavelet coefficients due to broken rotor bars are not sensitive to effects such as motor loading, initial rotor position, and supply imbalance, and • the wavelet technique is able to distinguish various degrees of broken rotor bar fault.
3.1. Variability of the test setup and the wavelet technique There are two types of variability tests considered in the paper. Firstly the variability of the motor setup, which is performed to ensure that the measurements obtained are equivalent, and secondly the variability of the wavelet technique under different loading conditions, initial rotor positions, and initial phase angle of the supply. The wavelet technique variability test is required to ensure that the pattern differences between the healthy and faulty motors (with broken rotor bars) can only be caused by the broken rotor bar fault and not due to loading conditions, initial rotor position, and the initial phase angle of the supply. The wavelet technique also needs to be able to distinguish between the acceleration characteristic due to broken rotor bars on an unloaded machine, with the acceleration characteristic of a healthy machine starting under load. Figure 8 shows the variability of the measurements for 3 different healthy motors, namely motor CM1, CM8, and CM10. As shown by the figure, the three wavelet indicator lines are very close to each other, which indicate a small degree of variability of the measurement data between different healthy machines. Also note that the wavelet indicator lines for the healthy motors are well below the lowest level obtained for the faulty machine. Therefore, the slight variability between the healthy motors is insignificant. Power Magnitude of Wavelet Indicator (dB)
0 -10 -20 -30
Faulty motor CM1-1BRB
-40 Healthy motor CM10 Healthy motor CM1 Healthy motor CM8
-50 -60 0
20
40
60
80
100
120
140
Load (%)
Figure 8 – The motor setup variability test results under various loading conditions: Wavelet indicator plots for three healthy (CM1, CM8 and CM10) and one faulty motor with one broken rotor bar (1BRB). The wavelet indicator plots in Figure 9 are given to show the variability of the wavelet technique under different loading conditions, initial rotor positions, and phases of the supply. This variability test is done on a healthy motor (CM1) and is repeated three times by choosing random initial rotor
positions and random phases of the supply for every test and every loading condition. As shown by Figure 9, the three wavelet indicator lines are close to each other, which indicate that the results from the wavelet technique are not very sensitive to the loading conditions, initial rotor position, and phases of the supply. Therefore, it can be concluded that any changes to the wavelet indicator by a faulty motor with broken rotor bars can only be caused by the broken rotor bar fault. Figures 8 and 9 also show a general trend of the wavelet indicator plots for healthy motors, where they tend to decrease as the load increases. Power Magnitude of Wavelet Indicator (dB)
0 -10 -20 -30 Faulty motor CM1-1BRB
-40
Healthy motor CM1_2
-50
Healthy motor CM1_1
Healthy motor CM1_3
-60 0
20
40
60
80
100
120
140
Load (%)
Figure 9 – Wavelet indicator plot for the wavelet technique variability test under various loading conditions.
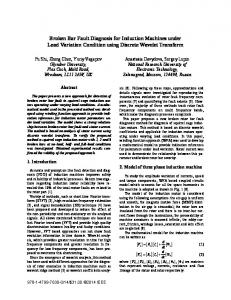
3.2. Comparison and classification of healthy and faulty motors As stated above, the wavelet indicator is the means used for comparing healthy and faulty motors (with broken rotor bars) and classifying the various degrees of broken rotor bar fault. The comparison and classification is done by measuring the magnitude of the wavelet indicator, and is given in Figure 10. Power Magnitude of Wavelet Indicator (dB)
0
-10
-20
Faulty motor CM1-4BRB
-30
Faulty motor CM1-2BRB Faulty motor CM1-1BRB
-40 Healthy motor CM1 Faulty motor CM1-75%BRB
-50
Healthy motor CM10 Faulty motor CM1-25%BRB
Healthy motor CM8
-60 0
20
40
60
80
100
120
140
Load (% )
Figure 10 – Wavelet indicator plot for the comparison and classification of healthy and faulty motors under different loading conditions, where BRB is broken rotor bar. Figure 10 clearly shows that the wavelet indicators of faulty motors with broken rotor bars are consistently higher than the wavelet indicators of healthy motors. The reason for this increase is due to the broken rotor bar “third pattern” that emerges in the wavelet transform of the envelope of the starting current for motors with broken rotor bar fault but not in healthy motors. It should also be
noted that the third wavelet pattern changes its scale and position depending on the loading conditions, such that the higher the load, the higher is the scale and the further is the position, but it always lies within the first and the second wavelet pattern. Figure 10 also shows a general trend of the wavelet indicator lines for faulty motors, where they tend to increase as the load increases. This trend characteristic of faulty motors is significantly different from the trend characteristic of healthy motors, where the wavelet indicator lines tend to decrease with loads. Hence distinguishing between the two characteristics is made easier if the motor can be started with varying levels of load. Another trend observable in Figure 10 is that the wavelet indicator increases as the severity of the broken rotor bar fault increases. As we can see from the figure, the faulty motor with 4 broken bars has the highest wavelet indicator. They are then followed by the wavelet indicator of the faulty motor with 2 broken rotor bars, and then followed by the faulty motor with 1 broken rotor bar. In addition, this trend is consistent under different loading conditions. Hence classifying different severities of the fault is simple, at least for fully broken rotor bars. The wavelet indicators for the motors with 25% and 75% partially broken rotor bar are very close to the healthy motors and hence it is difficult to distinguish between the two cases. The reason for this is that there is still a large amount of current flowing through the rotor bar of the test motor and no significant changes of the resistance when the rotor bar is only partially broken.
3.3. Motors with unbalanced supply Motors with unbalanced supplies show different wavelet characteristics than motors with broken rotor bar faults. They do not produce an extra wavelet pattern between the first and the second wavelet patterns, like motors with broken rotor bar faults do, but rather slightly alter the shape of the first wavelet pattern. This characteristic is shown in Figure 11a, which displays the plot of a wavelet envelope analysis on a motor with 33% of current unbalance and 7.1% of voltage unbalance. The unbalance factor is calculated based on the full-load steady-state signal according to the equations given in (2) and (3) for the voltage only.
UF = Vavg =
max( Va ( rms ) − Vavg , Vb ( rms ) − Vavg , Vc ( rms ) − Vavg )
(2)
Vavg (Va ( rms ) + Vb ( rms ) + Vb ( rms ) )
(3)
3
482 422 362 302 242 182 122 62 2 2000
4000 6000 sample
8000 10000
Power Magnitude of Wavelet Indicator (dB)
scale
Here UF is the unbalanced factor; Va(rms), Vb(rms), Vc(rms) are the rms values of the three phase voltages of the motor; and Vavg is the average value of these three voltages. 0 -10 -20 -30
Faulty motor CM1-1BRB
-40
Motor CM10-33%CU Motor CM10-20%CU
-50
Healthy motor CM1-B -60 0
50
100
150
Load (% )
Figure 11 – The wavelet plot of a motor with 33% of current unbalance (left) and wavelet indicator plot for motors with unbalanced supply (right), where CU is current unbalance and B is balance.
In Figure 11b, the wavelet indicator line of the motor with 33% of current unbalance is slightly higher than the healthy motor case. However, the wavelet indicator is still well below the wavelet indicator lines of the faulty motor with a broken rotor bar. On the other hand, the wavelet indicator of the motor with 20% of current unbalance is about the same level as the healthy one. As a result, the wavelet technique presented in this paper is not affected by an unbalance in the supply and hence it is reliable in detecting broken rotor bar faults even if the motor has an unbalanced supply.
4. Conclusion This paper investigates the detection of broken rotor bars using wavelet analysis of the starting current. The wavelet technique presented is able to extract useful characteristics of a transient signal, such as the starting current of an induction motor, and distinguish healthy and faulty motors by means of a numerical value called the wavelet indicator. Furthermore, the wavelet indicator can also be used to classify the different degrees of broken rotor bar faults. As a general rule, the higher the value of the wavelet indicator is, the greater the severity of the fault. Although the results of the partial broken rotor bars do not provide a clear indication about the severity of the fault, this is primarily due to the small size of the motor under test. Due to this, the effect of the resistance change under partial broken rotor bar is minimal. The proposed analysis technique has also been tested for its consistency under different motor loading conditions. The proposed technique, using the wavelet indicator, is able to distinguish faulty motors from healthy ones and classify the different degrees of the fault irrespective of the loading conditions. In addition, the wavelet technique has also been shown to be reliable and not affected by various other factors, such as initial rotor position, phase of the supply, and supply imbalance. The future studies will include using the real time data from large industrial machines and from laboratory machines with multiple faults. In addition, an alternative mechanical load (such as an eddy current brake) will be designed to simulate a constant torque load during starting.
5. References [1]. I. Ahmed, R. Supangat, J. Grieger, N. Ertugrul, and W. L. Soong, "A Baseline Study for On-Line Condition Monitoring of Induction Machines," Australasian Universities Power Engineering Conference (AUPEC), Brisbane, Australia, 2004. [2]. A. Bellini, F. Filippetti, G. Franceschini, C. Tassoni, and G. B. Kliman, "Quantitative evaluation of induction motor broken bars by means of electrical signature analysis," IEEE Transactions on Industry Applications, vol. 37, pp. 1248-55, 2001. [3]. M. E. H. Benbouzid, "A Review of Induction Motor Signature Analysis as a Medium for Faults Detection," IEEE Transactions on Industrial Electronics, vol. 47, no. 5, October 2000. [4]. G. B. Kliman, W. J. Premerlani, B. Yazici, R. A. Koegl, and J. Mazereeuw, "Sensorless, Online Motor Diagnostics," IEEE Computer Applications in Power, April 1997. [5]. S. Nandi and H. A. Toliyat, "Condition Monitoring and Fault Diagnosis of Electrical Machines - A Review," IEEE Industrial Applications Society Annual Meeting, 1999. [6]. J. Siau, A. Graff, W. L. Soong, and N. Ertugrul, "Broken Bar Detection in Induction Motors Using Current and Flux Spectral Analysis," Australasian Universities Power Engineering Conference (AUPEC), Christchurch, New Zealand, October 2003. [7]. H. Douglas, P. Pillay, and A. K. Ziarani, "A New Algorithm for Transient Motor Current Signature Analysis Using Wavelets," IEEE Transactions on Industry Applications, vol. 40, no. 5, September/October 2004. [8]. Z. Zhang, Z. Ren, and W. Huang, "A novel detection method of motor broken rotor bars based on wavelet ridge," IEEE Transactions on Energy Conversion, vol. 18, pp. 417-423, 2003. [9]. I. Daubechies, "The wavelet transform, time-frequency localization and signal analysis," IEEE Transactions on Information Theory, vol. 36, pp. 961-1005, 1990.