Building a portable device based on DSP for meat discrimination Assia Arsalane1, Noureddine El Barbri2, Karim Rhofir3, Abdelmoumen Tabyaoui4, Abdessamad Klilou5 1,4 2,3
Laboratory of Radiation, Material and Instrumentation, FST, University of Hassan 1, Settat, Morocco Laboratory of Electrical Department, Electronic Signals and Systems Team, ENSA, Khouribga, Morocco 5 LGECOS Lab, ENSA-Marrakech, University of Cadi Ayyad, Marrakech, Morocco
[email protected]
Abstract—More than ever, people today demand quality in the food that they consume. In this work, we will present an instrument and a method to discriminate horse and beef meat. Meat color is a long established property that is used to classify meat. The proposed device employs Charge-coupled Device (CCD) imaging techniques, digital image processing, Digital Signal Processor (DSP) control, processing techniques and Liquid Crystal Display (LCD) screen. Image analysis methods were developed for discriminating beef and horse meat. Samples were placed under cold storage at 4°C for two weeks. Two color models are used to define beef and horse meat color: the RGB (Red, Green and Blue) and HSI (Hue, Saturation and Intensity) model. Principal Component Analysis (PCA) was employed to optimize the data matrix. Results show that the portable device was able to distinguish between beef and horse meat using HSI model. Keywords—Meat discrimination; Digital Signal Processor; Portable instrument
I.
INTRODUCTION
With the increasing news of fraud and meat scandal adulteration in Europe in 2013 [1], and with the ongoing people health care interest, more than ever, high quality in meat product is required. Beef meat is one of the main foods over the world, thus, determining its quality parameters has always been a matter of research. For many costumers, meat quality is related to meat freshness, color, texture and fat color. In fact, color is one of the most important quality traits of meat that customer check before purchase [2]. Horse meat is used instead of beef meat due to its lower cost of rising. However in most cases horses are being slaughtered when they are injured or at the end their lives when most of the important compounds are depleted in their meats which have no more nutritional properties. Moreover in many parts of the world eating beef and horse meat is forbidden due to religious reasons [1]. Thus, many techniques and methods have been established in recent years to assess quality and origin of red meats. Indeed, microbial population evaluation, sensory, and chemical methods have been used for meat quality evaluation. However, they are destructive and time-consuming [3]. Furthermore, immunological, enzymatic, electrophoretic, and DNA-based techniques have been used to identify meat
1
species [4].As these techniques are laborious and require expensive laboratory equipments and high qualified staff, they are not efficient for real-time assessment. Recently, Hyperspectral imaging, and Raman spectroscopy techniques coupled with chemometric data analysis, have shown to be useful for meat adulteration. In fact, they are rapid, non-destructive, efficient analytical techniques and used in real-time process [5]. Machine vision is commonly used for beef meat quality assessment, and has proven its efficiency in several cases [6]. Though, as these methods are based on computer system for data processing, it can easily be affected by processor speed and computer stability. The limitation of hardware arithmetic speed affects the real-time performance of the system. In addition, the detection system has several drawbacks like is bulky and it is difficult to insure an in-situ measurement. Therefore, the development of a portable device which can discriminate between beef and horse meat rapidly and non-invasively is strongly sought. The objective of this work is to develop a portable device which can distinguish among beef and horse meat. The reminder of this paper is organized as follows. Section 2 presents related works on studying meat discrimination using different techniques. Section 3 gives an overview of the materiel and methods used. Section 4 describes the feature extraction. Section 5 presents the obtained results. Finally, a conclusion is provided in section 6. II.
RELATED WORKS
In recent years, many research communities were interested in studying meat adulteration using different methods. Raman spectroscopy in combination with chemometric was used to discriminate beef and horse meat at different concentrations (25%, 50%, 75%,w/w) of meat in beef based 978-1-5090-5579-1/16/$31.00 ©2016 IEEE
on pure fat samples. Results showed that Raman method was capable to determine 25% of horse meat in beef successfully [7]. Multispectral image analysis approach was developed to detect adulteration of beef and pork in raw meats with different levels of adulteration. The results showed very good discrimination between pure and adulterated samples yielding to 98.48% overall correct classification [8]. NIR hyperspectral imaging and multivariate image analysis were investigated to visualize adulteration of minced lamb meat at different ranges (2-40%w/w). The partial least squares regression (PLSR)-based prediction model showed a strong correlation (R2cv=0.99) with adulteration level. Four important wavelengths (940, 1067, 1144 and 1217 nm) were selected to build a MLR model, which yielded to a good prediction performance (R2cv =0.98) [9]. The electronic nose based on metal oxide sensors has detected adulteration of the cotenant of pork in minced mutton at different levels (20%, 40%, 60%, and 80% w/w). It was found that the Back propagation neural network (BPNN) model could predict the adulteration exactly (R2 higher than 0.97). Results demonstrated that the electronic nose system is a useful authentication method for meat adulteration detection [10]. The electronic tongue and the electronic nose were used for the distinction among meats from beef, goat and sheep by developing analytical methods for acquiring aroma and taste signatures from the three types of meat samples, and then determines the degree of spoilage of each product [11]. A portable device was developed for beef marbling detection. The proposed system is based on DSP TMS320DM642 processor. The instrument contained a camera for image acquisition, TMS320DM642 for image processing and a LCD for results display. All required operations such as image acquisition, data transmission, image processing algorithms and display were implemented on the same device. The device can determine the grade of beef marbling reliably and correctly [12]. All presented papers are based on computer system for data processing. To the best of our knowledge, only [12] has worked on a portable instrument based on DSP for beef marbling detection. The major contribution of our paper is the discrimination between beef and horse meat based on artificial vision and the implementation of all proposed methods on a portable system based on a DSP. III.
MATERIAL AND METHODS
A. Meat samples preparation Beef and horse meat samples were purchased from different providers from the central market of the city of Rabat and the local market of the city of Sala (Morocco). The samples were transported under refrigeration to the laboratory. They were placed in plastic boxes and kept under cold storage at 4 ± 1°C for two weeks. The choice of 4± 1°C temperature storage refers to the temperature storage of meat in grocery stores [13].
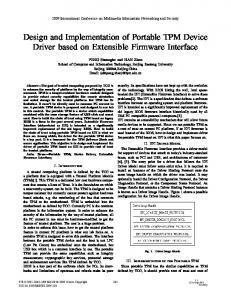
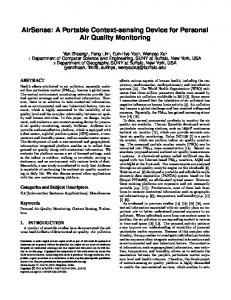
B. Device description The hardware of the portable device consists of a powersupply module, an image acquisition module, a DSP processing unit and image processing module, and a display module. Fig. 1 represents the structure of the system hardware. First, the power-supply module is turned on. Then, ARM µ-controller will order the CCD camera to collect a sample image each time (thirty frames per second). After the sample image is captured, it is then transferred into the DSP side for processing step. Images of beef and horse meat are then analyzed. Image parameters (mean, standard deviation, variance and interquartile rang) of RGB and HSI components are extracted. The beef and horse meat discrimination is conducted using the PCA analysis. Finally, the PCA results are transferred to the display screen in real-time. Power-supply Module
CCD Camera
Control and image processing (TMS320DM6446)
Display results LCD
Fig. 1. Structure of the device hardware
C. System design 1) System hardware a) Image acquisition module A Video camera with NTSC (720x480 pixels) format is used in the module to acquire beef and horse meat images. The illumination was achieved with 2 Philips fluorescent lights. b) Control and image processing module DSP is a processor developed for real-time digital signal processing. It can perform intensive numerical computations at high computing performances, such as performing multiple instructions per cycle [14-16]. The processing was performed using an Evaluation Module (EVM) board. The development board consists of DaVinci TMS320DM6446 dual core processor from Texas Instruments. This processor has an ARM926EJ-S 300 MHz core and a fixed point C64x+ DSP 600MHZ core. The application runs on the ARM core, featuring user interface, algorithms, peripheral control and overall system management [17]. The image processing algorithms runs on the DSP core. EVM provides two video input ports, four video output ports, a RS232 interface, an URT interface, two USB ports, a MicroSD interface and a 32-bit DDR2 memory controller, 256 MBs FlashNAND which are important for image processing and data transmission.
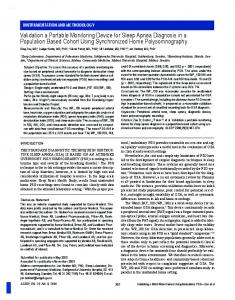
Standard video signals acquired by the CCD camera are decoded into paralleled digital signals BT.656 code stream through a video decoder chip (A/D) and transferred to CCD Controller Video Interface. It is responsible for accepting raw image and video data from CCD sensors in Video Processing Front End subsystem (VPFE) of TMS320DM6446 (Fig. 2). The VPFE gets images by decoding BT.656 code stream and transfers images to DDR2 automatically. When one frame image is ready in the video input buffer, it is processed by the DSP Central Processing Unit (CPU). Finally, the results are sent to the output buffer [18]. c) Display module The Video processing Back End subsystem is in charge to display the output of the processed visual images. The VPBE block is comprised of the on-screen display (OSD) which is responsible for gathering, blending and then transferring it to the video encoder that generates analog video output, the digital LCD controller that generates digital RGB/YUV data output and timing signals, and the timing generator including the digital LCD interface [19]. The screen of LCD which achieves the communication with the outside world is 7 inches with 720×480 resolution. The LCD screen has a color adjustment, brightness control, and low power consumption.
R = 1.164(Y - 16) + 1.596(U - 128)
(1)
G = 1.164(Y - 16) - 0.813(U - 128) - 0.392(V - 128)
(2)
B = 1.164(Y – 16) + 2.017(V – 128)
(3)
IV.
FEATURE EXTRACTION
In order to measure changes in surface color characteristics of meats, we have used the Red, Green, Blue (RGB) and Hue, Saturation, Intensity (HSI) color models. Therefore, color features of beef and horse meat were extracted in RGB and HSI color spaces. The RGB system is usually used in image capture and display. It represents a color by primary spectral components of red, green, and blue. Besides, the HSI color model can be compared to how the human eyes perceive colors and then makes it ideal for developing image processing algorithms. Thus, hue describes the color itself in the form of an angle between [0,360] degrees. Saturation indicates the degree of the color purity, and describes how the color is polluted with white light. On the other hand, intensity characterizes the luminance information. The transformation from RGB to HSI is given by the followings equations (4), (5) and (6) [3]:
As color features provide information about the color intensity of beef and horse meat, we extracted four features (mean, standard deviation, variance, and Interquartile range) per color channels: Red, Green, and Blue from RGB model and Hue, Saturation, Intensity from HSI base. Hence, we extracted 24 features i.e. 4x6 from six color channels in a window of 100x100 pixels from beef and horse meat images.
Fig. 2. TMS320DM6446 Functional Block Diagram
2) System software To assure beef and horse meat discrimination based on surface color and its evaluation, encoded images were captured in YUV422 format. As a first step we have developed an algorithm which decodes images and transform it from YUV422 to YUV444 and then from YUV444 to RGB format using the following equations (1), (2) and (3) [20].
The data obtained from RGB and HSI images is gathered in a dataset and used to build a model to discriminate among beef and horse meat. PCA is developed in order to reduce the dataset by projecting the multidimensional data onto new coordinate base formed by the orthogonal direction with data maximum variation [11]. Moreover, PCA generates the principal components (PCs) which can be used to predict and to identify the origin of unknown samples. V.
RESULTS AND DISCUSSION
Images were acquired by the device using a program under Code Compose Studio v5.5 and an XSD200 JTAG Emulator [21]. It was saved on computer memory in order to build our reference model that has already established in Matlab2013. We have used image acquisition and image processing
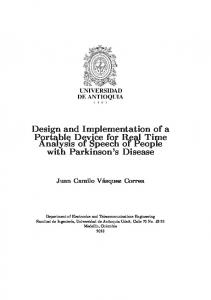
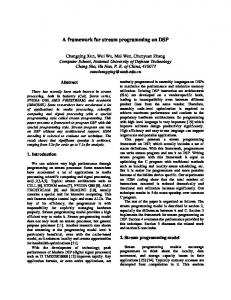
toolboxes for image analysis and features extraction. Fig. 3 represents beef and horse meat color evolution at different storage days. We can clearly see the difference between beef and horse meat from day 1, 3, 6 and 9. Beef color changes from light red to dark red mixed with light green color from day 1 to 9. Horse meat color changes from dusky red at day 1 to brown one at day 6 and becames dark red at day 9. These changes are related to the evolution of the number of microbiological colonies formed in beef and horse meat samples [3]. Fig. 4 and Fig. 5 represent respectively the histograms of R component of beef and horse meat images at day 1, 3, 6 and 9. The color evolution and the deference between beef and horse meat can be easly observed. In fact, for beef meat images, the histogram is centred at 230 gray level value at day 1, 200 grey level value at day 3, 170 grey leve value at day 6, and 150 grey level value at day 9. However, for horsemeat images, the histogram is centred at 160 grey level value at day 1, 140 grey level value at day 3, and at 130 gray level value for day 6 and 9. After the extraction of all the parameters form RGB and HSI components from each sample image, principal component analysis was employed to classify beef and horse meat using IBM SPSS STATISTICS 20 software [22].
(a)
(e)
(b)
(f)
(c)
(g)
(d)
(h)
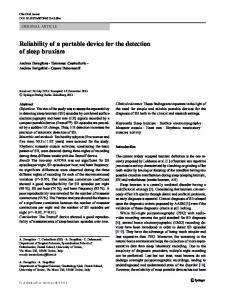
PCA transforms data into several (PCs). The first PCs resulting from PCA retain most of the variation present in all of the original variables. Each PC can be interpreted independently which permit to have an overview of the data structure. Moreover, it permits to visualize differences, similarities and grouping by identifying the most important directions according to image features of samples [9]. Besides, when the scores of the PCs are plotted, samples having similar properties tend to combine together. Fig. 6 revealed the clustering between beef and horse meat from RGB components on a two dimensional plane PC1-PC2. The first two components can be used to represent 92% of the data variance related to R component. A clear discrimination of the two clusters of beef and horse meat can be obtained. This indicated that is it possible to distinguish between beef and horse meat using R component combined to PCA analysis. However, PCA has failed to discriminate between beef and horse meat using G component. Indeed, PC1 and PC2 represent 95.71% of the data variance, and a notable scattering overlap was noticed. For B component, PC1 and PC2 represent 93.47% of the data variance, and an overlap between horse meat and beef meat was observed. Fig. 7 represents the clustering between beef and horse meat for HSI components using PCA. Here, the first two components can be used to represent 98.51% of the data variance related to H component. A clear discrimination of two clusters of beef and horse meat can be obtained. The same observation can be made for S component which indicate an apparent clustering of beef and horse meat. Thus 96.47% of the data variance was represented by PC1 and PC2. PCA using I component data has also revealed two clusters of beef and horse meat with 93.47% of the data variance explained by PC1 and PC2. These results indicate that the three components of HSI system coupled with PCA analysis were able to discriminate among beef and horse meat successfully compared to the 3 component of RGB system.
Fig. 3. Color evolution change illustration of beef meat at: (a) day 1, (b) day 3, (c) day 6, (d) day 9, and horse meat at: (e) day 1, (f) day 3, (g) day 6, (h) day 9.
Fig. 5. R component histograms of horse meat at day 1, 3 ,6, and 9.
Fig. 4. R component histograms of Beef meat at day 1, 3 ,6, and 9
(a)
(b)
(a)
(b)
(c) (c) Fig. 6. PCA scores plot for beef and horse meat discrimination based on: (a) R component, (b) G component, (c) G component
Fig. 7. PCA scores plot for beef and horse meat discrimination based on: (a) H component, (b) S component, (c) I component
VI.
CONCLUSION
The aim of this work was the discrimination of beef and horse meat samples using artificial vision in combination with PCA analysis. To achieve this objective, we have developed a rapid and a non-destructive portable device which consists of an image acquisition module, a DSP processing unit and image processing module, and a display module. The model system developed in this paper was able to discriminate clearly among beef and horse meat images samples using each component of HSI system. Moreover, for RGB system, only R component coupled with PCA can give the best results among G and B components in term of discrimination.
[8]
[9]
[10]
[11]
[12]
In future work, we will implement our reference model on the portable device, and we will attempt to evaluate the quality and the degree of spoilage of beef meat and horse meat samples under cold storage using our portable device.
[13]
REFERENCES
[14]
[1] [2]
[3]
[4]
[5]
[6]
[7]
Premanandh, “Horse meat scandal – A wake-up call for regulatory authorities”, Food Control, vol. 34, pp. 568-569, December 2013. K. Chena, X. Sun, C. Qin, X. Tang, “Color grading of beef fat by using computer vision and support vector machine”, Computers and Electronics in Agriculture, vol. 70, pp. 27–32, January 2010. N. El Barbri, A. Halimi, K. Rhofir, “A Nondestructive Method Based on an Artificial Vision for Beef Meat Quality Assessment”, International Journal of Innovative Research In Electrical, Electronics, Instrumentation and Control Engeineering, vol. 2, pp. 2060-2063, October 2014. M.A. Sentandreu, E. Sentandreu, “Authenticity of meat products: Tools against fraud”, Food Research International, vol. 60, pp. 19-29, June 2014. M. Kamruzzaman, Y. Makino, S. Oshita, “Non-invasive analytical technology for the detection of contamination, adulteration, and authenticity of meat, poultry, and fish: A review”, Analytica Chimica Acta, vol. 853, pp. 19-29, January 2015. P. Jackman, D.W. Sun, P. Allen, “Recent advances in the use of computer vision technology in the qualityassessment of fresh meats”, Trends in Food Science & Technology, vol. 22, pp. 185-197, April 2011. I.H. Boyaci, H.T. Temiz, R.S. Uysal, H.M. Velioglu, R.J. Yadegari, M. M. Rishkan, “A novel method for discrimination of beef and horsemeat using Raman spectroscopy”, Food Chemistry, vol. 148, pp. 37-41, April 2014.
[15]
[16]
[17] [18] [19] [20] [21] [22]
A.I. Ropodi, D.E. Pavlidis, F. Mohareb, E.Z. Panagou, G.J.E. Nychas, “Multispectral image analysis approach to detect adulteration of beef and pork in raw meats”, Food Research International, vol. 67, pp. 12-18, January 2015. M. Kamruzzaman, D.W. Sun, G. ElMasry, P. Allen, “Fast detection and visualization of minced lamb meat adulteration using NIR hyperspectral imaging and multivariate image analysis”, Talanta, vol. 103, pp. 130136, January 2013. X. Tian, J. Wang, S. Cui, “Analysis of pork adulteration in minced mutton using electronic nose of metal oxide sensors”, Journal of Food Engineering, vol. 119, pp. 744-749, December 2013. Z. Haddi, N. El Barbri, K. Tahri, M. Bougrini, N. El Bari, E. Llobet, B. Bouchikhi, “Instrumental assessment of red meat origins and their storage time using electronic sensing systems”, Analytical Methods, vol. 7, pp. 5193-5203, May 2015. T. Zhou, Y. Peng, “A portable detection instrument based on DSP for beef marbling”, Proceeding SPIE 9108, Sensing for Agriculture and Food Quality and Safety VI, pp. 1-7. May 2014. S. Panigrahi, S. Balasubramanian, H. Gu, C. Logue, M. Marchello, “Neural-network-integrated electronic nose system for identification of spoiled beef”, LWT-Food Science and Technology, vol. 39, pp. 135145, March 2006. A. Klilou, S. Belkouch, P. Elleaume, P. Le Gall, F. Bourzeix, M.M. Hassani, “Real-time parallel implementation of Pulse-Doppler radar signal processing chain on a massively parallel machine based on multi-core DSP and Serial RapidIO interconnect”, EURASIP Journal on Advances in Signal Processing, vol. 2014, December 2014. A. Klilou, S. Belkouch, P. Elleaume, P. Le Gall, F. Bourzeix, M.M. Hassani, “Performance optimization of high-speed Interconnect Serial RapidIO for onboard processing”, 2012 International Conference on Complex Systems (ICCS), Agadir, Morocco, pp. 1-6, November 2012. A. Klilou, S. Belkouch, A. Elmaizi, P. Elleaume, P. Le Gall, F. Bourzeix, M.M. Hassani “Case studies of data traffic management on a high-performance computing system based on multi-DSPs and Serial RapidIO interconnect”, 2016 International Conference on Information Technology for Organizations Development (IT4OD), Fez, Morocco, pp. 1-6, April 2016. Texas Instruments, “TMS320DM6446 Digital Media System-on-Chip”, September 2010. Texsas Instruments,“ TMS320DM644x DMSoC Video Processing Front End (VPFE) User’s Guide”, August 2010. Texsas Instruments,“ TMS320DM644x DMSoC Video Processing Back End (VPBE) User’s Guide”, January 2011. K. Jack, “YCbCr to RGB considertions”, Application Note, March 1997. Spectrum Digital, “XDS200 Quick Start Guide”, 2012. IBM, “IBM SPSS Statics 22 Brief Guide”, 2013.