[22] T. Leung and J. Malik. Representing and recognizing the visual appearance of materials using three-dimensional tex- tons. IJCV, 43(1), 2001. [23] J. Li and ...
Building and Using a Semantivisual Image Hierarchy Li-Jia Li∗,1 1 2
Chong Wang∗,2
Yongwhan Lim1
David M. Blei2
Li Fei-Fei1
Computer Science Department, Stanford University, Stanford, CA 94305
Computer Science Department, Princeton University, Princeton, NJ 08540
My Pictures
Abstract A meaningful image hierarchy can ease the human effort in organizing thousands and millions of pictures (e.g., personal albums), and help to improve performance of end tasks such as image annotation and classification. Previous work has focused on using either low-level image features or textual tags to build image hierarchies, resulting in limited success in their general usage. In this paper, we propose a method to automatically discover the “semantivisual” image hierarchy by incorporating both image and tag information. This hierarchy encodes a general-to-specific image relationship. We pay particular attention to quantifying the effectiveness of the learned hierarchy, as well as comparing our method with others in the end-task applications. Our experiments show that humans find our semantivisual image hierarchy more effective than those solely based on texts or low-level visual features. And using the constructed image hierarchy as a knowledge ontology, our algorithm can perform challenging image classification and annotation tasks more accurately.
1. Introduction The growing popularity of digital cameras allows us to easily capture and share meaningful moments in our lives, resulting in giga-bytes of digital images stored in our harddrives or uploaded onto the Internet. While it is enjoyable to take, view and share pictures, it is tedious to organize them. Vision technology should offer intelligent tools to do this task automatically. Hierarchies are a natural way to organize concepts and data [5]. For images, a meaningful image hierarchy can make image organization, browsing and searching more convenient and effective (Fig. 1). Furthermore, good image hierarchies can serve as knowledge ontology for end tasks such as image retrieval, annotation or classification. Two types of hierarchies have recently been explored in computer vision: language-based hierarchy and low-level visual feature based hierarchy. Pure language-based lexicon taxonomies, such as WordNet [28, 31], have been used in vision and multimedia communities for tasks such as im*indicates equal contributions.
5.jpg
181939.jpeg
DSC_1962.jpg
hawaii.gif
New_w_ts.jpg
(a) now: computers organize images by meta-data (dates, filenames,...) My Pictures Work
Travel
More...
More...
Hawaii
More...
Eiffle Tower
More...
Whistler
More...
(b) future: computers organize images by semanc and visual contents
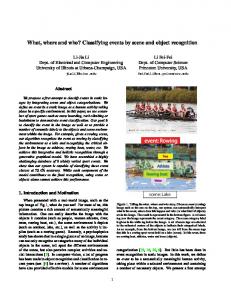
Figure 1. Traditional ways of organizing and browsing digital images include using dates or filenames, which can be a problem for large sets of images. Images organized by meaningful hierarchy could be more useful.
age retrieval [19, 20, 13] and object recognition [26, 32]. While these hierarchies are useful to guide the meaningful organization of images, they ignore important visual information that connects images together. For example, concepts such as snowy mountains and a skiing activity are far from each other on the WordNet hierarchy, while visually they are close. On the other hand, a number of purely visual feature based hierarchies have also been explored recently [16, 27, 30, 1, 4]. They are motivated by the observation that the organization of the image world does not necessarily follow a language hierarchy. Instead, visually similar objects and concepts (e.g. shark and whale) should be close neighbors on an image hierarchy, a useful property for tasks such as image classification. But visual hierarchies are difficult to interpret – none of the work has a quantitatively evaluated of the effectiveness of the hierarchies directly. It is also not clear how useful a purely visual hierarchy is. Motivated by having a more meaningful image hierarchy useful for end-tasks such as image annotation and classification, we propose a method to construct a semantivisual hierarchy, which is built upon both semantic and visual information related to images. Specifically, we make the following contributions: 1. Given a set of images and their tags, our algorithm automatically constructs a hierarchy that organizes im-
ages in a general-to-specific structure. 2. Our quantitative evaluation by human subjects shows that our semantivisual image hierarchy is more meaningful and accurate than other hierarchies. 3. Serving as a knowledge ontology, our image hierarchy performs better on image classification and annotation.
2. Related Work Building the Image Hierarchy. Several methods [1, 4, 16, 27, 30] have been developed for building image hierarchies from image features. Most of them assess the quality of the hierarchies by using end tasks such as classification, and there is little discussion on how to interpret the hierarchies1 . We emphasize an automatic construction of meaningful image hierarchies and quantitative evaluations of the constructed hierarchy. Using the Image Hierarchy. A meaningful image hierarchy can be useful for several end-tasks such as classification, annotation, searching and indexing. In object recognition, using WordNet [28] has led to promising results [26, 32]. Here, we focus on exploiting the image hierarchy for three image related tasks: classification (e.g., “Is this a wedding picture?”), annotation (e.g., a picture of water, sky, boat, and sun) and hierarchical annotation (e.g., a picture described by photo→ event → wedding → gown). Most relevant to our work are those methods matching pictures with words [3, 14, 9, 6, 33, 24]. These models build upon the idea of associating latent topics [17, 7, 5] related to both the visual features and words. Drawing inspiration from this work, our paper differs by exploiting a image hierarchy as a knowledge ontology to perform image annotation and classification. We are able to offer hierarchical annotations of images that previous work cannot, making our algorithm more useful for real world applications like album organization. Album Organization in Multi-media Research. Some previous work has been done in the multimedia community for album organization [8, 18, 11]. These algorithms treat album organization as an annotation problem. Here, we build a general semantivisual image hierarchy. Image annotation is just one application of our work.
3. Building the Semantivisual Image Hierarchy Our research in building such a meaningful image hierarchy considers the following issues: • Images should cluster meaningfully at all levels of the hierarchy. Tags related to the images should be correctly assigned to each node of the hierarchy; 1 [30] has provided some interesting insights of their hierarchy by labeling the nodes with class names of human segmented image regions [34] but without any quantitative evaluations.
Training images w1 = photo w2 = beak w3 = parrot
Region (R) Descriptiors
Testing images w1 = photo w2 = zoo w3 = parrot
T
photo C1
Color =
zoo C2 Texton =
SIFT = Location = {Center, Top Bottom}
parrot Cn-1 beak C n
Figure 2. Schematic illustration of associating a training image in the semantivisual hierarchical model (left) and assigning a test image to a node on a given path of the hierarchy (right). The hierarchical model is summarized in variable T , where only one path is explicitly drawn from C1 to Cn . Left of the model: Two training images and their Flickr tags are shown. Each image is further decomposed into regions. Each region is characterized by the features demonstrated in the bounding box on the left. A region is assigned to a node that best depicts its semantic meaning. Right of the model: A query image is assigned to a path based on the distribution of the concepts it contains. To further visualize the image on a particular node of the path, we choose the node that corresponds to the dominating region concepts in the image.
• Our algorithm organizes the images in a general-tospecific relationship which is deliberately less strict compared to formal linguistic relations; • It is unclear what a semantically meaningful image hierarchy should look like in either cognitive research [29] or computer vision. Indeed formalizing such relations would be a study of its own. We follow a common wisdom - the effectiveness of the constructed image hierarchy is quantitatively evaluated by both human subjects and end tasks. Sec. 3.1 details the model. Sec. 3.2 sketches out the learning algorithm. Sec. 3.3 visualizes our image hierarchy and presents the quantitative evaluations by human subjects.
3.1. A Hierarchical Model for both Image and Text We use a multi-modal model to represent images and textual tags on the semantivisual hierarchy (Fig.2). Each image is decomposed into a set of over-segmented regions R = [R1 , . . . , Rr , . . . , RN ], and each of the N regions is characterized by four appearance features – color, texture, location and quantized SIFT [25] histogram of the small patches within each region. An image and its tags W = [W1 , . . . , Ww , . . . , WM ] form an image-text pair. M is the number of distinct tags for this image. Each image is associated with a path of the hierarchy, where the image regions can be assigned to different nodes of the path, depending on which visual concept the region depicts. For example, in the “photo→zoo→parrot→beak” path, a foliage region of a bird photo is likely to be associated with the more general
α γ
C1
image text pair
λ θ image regions
tags
T Tree
ϕ
Z
W
Cl R NF
CL
N
S M D
φ
β NF
xNF
Notation α γ λ φ θ C Z S β ϕ R W
Conditional dist. – – – – Dirichlet(θ|α) nCRP(Cd |C−d , γ) Mult(Z|θ) Uniform(S|N ) Dirichlet(β|φ) Dirichlet(ϕ|λ) Mult(R|C, Z, β) Mult(W |C, Z, S, ϕ)
Description Parameter for the Dirichlet dist. for θ. Parameter for the nCRP. Parameter for the Dirichlet dist. for ϕ. Parameter for the Dirichlet dist. for β. Mixture proportion of concepts. Path in the hierarchy. Concept index variable. Coupling variable for a region and a tag. Concept dist. over region features (Dim. Vj ). Concept dist. over tags (Dim. U ). Image region appearance feature. Tag feature.
Figure 3. The graphical model (Left) and the notations of the variables(Right).
“zoo” node, whereas a region containing the bird beak is likely to be assigned to the leaf node “beak”. Fig.3 (Left) shows the graphical model. Each image-text pair (R, W ) is assigned to a path Cc = [Cc1 , . . . , Ccl , . . . , CcL ] in the infinite image and text hierarchy T = [C1 , . . . , Cc , . . . , C∞ ]. Here l indicates the level in the path, with L the maximum. The path is sampled from an nCRP(γ) (nested Chinese Restaurant Process)[5], where γ is a parameter controlling the branching probability. Let d be the index of an image-text pair, with Nd regions, Md tags in this image-text pair, and NF = 4 types of region descriptors indexed by j. The joint distribution of all random variables (hidden and observed) is p(C, θ, Z, R, S, W , β, ϕ|α, φ, λ) = Q Q4 QD c∈T j=1 p(βj,c |φj )p(ϕc |λ) d=1 p(Cd |C1:d−1 )p(θd |α) Q4 QNd r=1 p(Zd,r |θd ) j=1 p(Rd,r,j |Cd , Zd,r , β) QMd (1) w=1 p(Sd,w |Nd )p(Ww |Cd , Zd , Sd,w , ϕ),
where λ, φj , α are Dirichlet priors for the mixture proportion of concepts θ, region appearances given concept β, and words given concept ϕ. The conditional distribution of Cd given C1:d−1 , p(Cd |C1:d−1 ), follows the nested Chinese restaurant process (nCRP). Remarks. The image part of our model is adapted from the nCRP [5], which was later applied in vision in [4, 30]. We improve this representation by coupling images and their tags through a correspondence model. Inspired by [6], we use the coupling variable S to associate the image regions and the tags. In our model, the correspondence of tags and image regions occurs at the nodes in the hierarchy. This differentiates our work from [1, 4, 16, 27, 30]. Both textual and visual information serve as bottom up information to estimation of the hierarchy. As shown in Fig.5, by combining the tag information, the constructed image hierarchy becomes meaningful, since textual information are often more descriptive. A comparison between our model and [5] demonstrates that our visual-textual representation is more effective than the language-based representation (Fig.6).
3.2. Learning the Semantivisual Image Hierarchy Given a set of unorganized images and user tags associated with them (e.g. Flickr images and user tags), the goal of learning is to estimate an image hierarchy in which images and tags of the same concept can be associated with each other via learning of the concept index Z and the coupling variable S. In addition, their location in the hierarchy is estimated by learning the concept index Z and the path C. This involves computing the posterior distribution of the hidden variables given the observations. However, this posterior is intractable to compute in our model. We use an approximation algorithm i.e. Gibbs sampling [15]. Gibbs sampling defines a Markov chain whose stationary distribution is the posterior of interest. The chain is defined by iteratively drawing each hidden variable from its conditional distribution given the other hidden variables and observations. We use a collapsed version of Gibbs sampling algorithm by integrating out β, ϕ and θ. It samples the concept index Z, the coupling variable S and the path C. Sampling concept index Z. The conditional distribution of a concept index of a particular region depends on 1) the likelihood of the region appearance, 2) the likelihood of tags associated with this region and 3) the concept indices of the other regions in the same image-text pair. Since the path assignment for the image-text pair is fixed at this step, the resampled concept index is restricted to this path. For the rth region of dth image-text pair, let Sr = {w : Sd,w = r} be the set of tags associated with this region r, p(Zd,r = l|rest) ∝ p(Zd,r = l|Zd−r , α)
Q4 j=1
p(Rd,r,j |R−dr , Cd , Z, φj )
p({Wd,w : w ∈ Sr }|W−dw:w∈Sr , Cd , Zd,r , λ) = Q4 j=1
n−dr C ,j,R
+φj
d,l d,r,j n−dr +Vj φj Cd,l ,j,·
×
Q w∈Sr
n−dw C ,W d,l
d,w
+λ
n−dw +U λ C ,· d,l
×
n−r +α d,l +Lα n−r d,·
,
where n−r d,l is the number of regions in the current image assigned to level l except the rth region, n−dr Cd,l ,j,Rd,r,j is the number of regions of type j, index Rd,r,j assigned to
node Cd,l except the rth region in image-text pair d, and n−dw Cd,l ,Wd,w is the number of tags of index Wd,w assigned to node Cd,l except the wth region in image-text pair d. Marginal counts are represented with dots. Sampling coupling variable S. Coupling variable S couples the image regions with the tags. Since it has a uniform prior over the number of regions, its conditional distribution solely depends on the likelihood of the tag, i.e. how frequently one specific tag is assigned to a node through an image region. Note that the path assignment is still fixed at this step. The conditional probability is p(Sd,w = r|rest) ∝ p(Wd,w |Sd,w = r, S =
n−dw C
d,Zd,r ,Wd,w
n−dw C
d,Zd,r ,·
−dw
,W
−dw
Figure 4. Example images from each of the 40 Flickr classes.
chosen images per class. Similarly, we obtain our 4 region codebooks of size 100, 50, 100 and 100 for color (HSV histogram), location (vector quantization of the region center, top and bottom position), texture (normalized texton [22] histogram ) and normalized SIFT histogram respectively. To speed up learning, we initialize the levels in a path by assigning the regions with high tf-idf (term frequency-inverse document frequency) scores in one of the visual feature to the leaf node and those with low tf-idf scores to the root node. It takes about 2 hours to learn the hierarchy from 4, 000 images and 30 minutes for test on 4, 000 images on a PC with an Intel 2.66GHz CPU. Visualizing the semantivisual hierarchy. For all 4, 000 images and 538 tags, we obtain a hierarchy of 121 nodes, 4 levels and 53 paths. Fig. 5 visualizes in more details different parts the hierarchy. Our observations are as follows.
, Zd , Cd , λ)
+λ
+U λ
.
Sampling path C. The path assignment of a new imagetext pair is influenced by the previous arrangement of the hierarchy and the likelihood of the image-text pair: p(Cd |rest) ∝ p(Rd , Wd |R−d , W−d , Z, C, S)p(Cd |C−d ),
where p(Cd |C−d ) is the prior probability induced by nCRP and p(Rd , Wd |R−d , W−d , Z, C, S) is the likelihood, p(Rd , Wd |R−d , W−d , Z, C, S) ∝ QL Q4 l=1
Ã
j=1
QMd
w=1
n−d C
d,Zd,S
n−d C
d,w
d,Zd,S
Γ(n−d +Vj φj ) Cd,l ,j,· Q −d +φj ) v Γ(nC ,j,v d,l
Q
×
v
,Wd,w
d,w
,·
+λ
+U λ
×
Γ(n−d +nd Cd,l ,j,v +φj ) Cd,l ,j,v
!
Γ(n−d ++nd +Vj φj ) Cd,l ,j,· Cd,l ,j,·
The Gibbs sampling algorithm samples the hidden variables iteratively given the conditional distributions. Samples are collected after the burn in.
3.3. A Semantivisual Image Hierarchy We use a set of 4, 000 user uploaded images and 538 unique user tags2 across 40 image classes from Flickr3 to construct a semantivisual image hierarchy. The average number of tags for each image is 4. As Fig. 4 shows, photos from real-world sources are very challenging to average, even for human. We detail in this section how we conduct our evaluation and how effective our image hierarchy is compared to other hierarchies. Implementation. Each image is divided into small patches of 10 × 10 pixels, as well as a collection of over-segmented regions based on color, brightness and texture homogeneity [2]. Each patch is assigned to a codeword in a codebook of 500 visual words obtained by applying K-means clustering to the 128-dim SIFT features extracted from 30 randomly 2 Incorrectly
spelled words and adjectives are omitted. image classes are: animal, bride, building, cake, child, christmas, church, city, clouds, dessert, dinner, flower, spring, friends, fruit, green, high-school, calcio, italy, europe, london, love, nature, landscape, macro, paris, party, present, sea, sun, sky, seagull, soccer, reflection, sushi, vacation, trip, water, silhouette, and wife. 3 The
.
• The general-to-specific relationship is observed in most parts of the hierarchy. The root node contains images that are difficult to be named, but fall under the general category of “photo”. Directly under the root, images are organized into “architecture”, “garden”, “event”, “food”, etc. Examine the leftmost path of the “event” subtree. This path is about photos taken at wedding events. The leaf node of this path is “wedding gown”, a child of “wedding” and a sister of “wedding flower”. This organization can be useful for browsing large photo libraries. The users no longer have to remember different dates of various wedding events. Instead, they can quickly access the wedding concept and its related classes. • We have argued that purely visual information sometimes cannot provide meaningful image hierarchy. As demonstrated by the “event” subtree, it is difficult to imagine that pictures of “dancing at a birthday party” can be a sister node to “birthday cake” based only on low-level image features. Our semantivisual hierarchy offers a connection between these two groups via the parent of “birthday.” • Similarly, a purely language-based hierarchy would be likely to miss close connections such as “tower” and “business district” (in the “architecture” subtree). In WordNet, “tower” and “business district” have to traverse 15 inherited parent nodes to reach each other.
“How meaningful is the path?” Exp. Garden Tree Water Rock Leaf Architecture
Accuracy semantivisual 92 % hierarchy
nCRP
Zoo Zoo Parrot Parrot Beak Beak
Parrot Beak Zoo Beak Zoo Parrot
Beak Parrot Beak Zoo Parrot Zoo
70 %
• Our hierarchy illustrates that images assigned to each node are diverse. It is easy to predict that for nodes at the higher levels, the visual appearance of images are diverse because the semantic meaning of the nodes is general. For example, “food” can be interpreted as “sushi”, “cake”, or “dinner”. As one traverses down along a path, concepts represented in the nodes become more specific. However even at the bottom levels such as “sugar” and “cheese”, the images are diverse. This is because of the tightly coupled clustering of images using both the visual and textual information. A purely visual-feature based algorithm would not be able to achieve this. A quantitative evaluation of image hierarchies. Evaluating the effectiveness of an image hierarchy is not an easy task. What makes a meaningful image hierarchy? We consider two criteria for evaluation: 1) good clustering of images that share similar concepts, i.e., images along the same path, should be more or less annotated with similar tags; 2) and good hierarchical structure given a path, i.e., images and their associated tags at different levels of the path, should demonstrate good general-to-specific relationships. To measure if an image on a path associates well with the set of concepts depicted by this path, we present human subjects trials in which each image and six word concepts are presented (Fig. 6). Inspired by [10], we present five of the six tag concepts associated with the path of the image (learned by the model) and one randomly chosen tag concept that is unlikely to be in the path. The subject is asked to select which set of tags are unrelated to the image (Fig. 6
Our Result
Flickr
Photo
Photo
Photo
Zoo
Bird
Football
Football
Stadium
London
Head
Accuracy semantivisual 59 % hierarchy nCRP 50 % Flickr 45 %
Figure 6. Evaluation of the hierarchy. Top: “How meaningful is the path” experiment. Top Left: The AMT users are provided with a list of words. The users need to identify the words that are not related to the image to the left. Top Right: Quantitative results of our hierarchy and nCRP[5]. Our hierarchy performs the best by incorporating the visual information associated to the tags. Bottom: “How meaningful is the hierarchy” experiment. Bottom Left: The AMT users are provided with all permutations of candidate words from the path corresponding to the image 4 . The users need to identify a choice that correctly represents the hierarchical structure. Bottom Right: Quantitative results of our hierarchy, nCRP [5] and Flickr. All three algorithms use exactly the same tag input to construct the hierarchy.
Flickr
Photo
Flamingo Animal
“How meaningful is the hierarchy?” Exp. Photo
Our Result
Human
Our Result
Flickr
Photo
Photo
Event
Wedding
Wedding
Bride
method Our Model nCRP
accuracy 46% 16%
Dress
Figure 7. Results of the hierarchical annotation experiment. Three sample images and their hierarchical annotations by our algorithm and the original Flickr tags are shown. The table presents quantitative comparison on our hierarchy and nCRP[5]. The performance is measured by the modified Damerau-Levenshtein distance between the proposed hierarchical annotation by each algorithm and the human subjects’ result.
(top left)). In the ideal case, if the image path is effective, then it is more likely that the randomly chosen word would be the only irrelevant concept to the image. An Amazon Mechanical Turk (AMT) experiment is set up for this evaluation (see supplementary material for details). We compare our hierarchy with one that is obtained by using only text clustering [5]. Fig. 6 (top right) shows that our hierarchy is more effective than the purely text-based method. The second metric measures how good the hierarchical relations are in our image hierarchy. Again we use AMT. We break down the evaluation by path. For each trial, a path of L levels is selected from the hierarchy. The (L − 1)! permutations of the nodes in the path4 are presented to a human subject, depicted by the text concepts (see Fig. 6 (bottom left)). Subjects are instructed to select the path that best illustrates a general-to-specific hierarchical relation. We compare the human selected path (as ground-truth) with the model generated path using modified DamerauLevenshtein distance (see supplementary material for more details). We compare our hierarchy with two purely textbased hierarchies including one obtained by [5] and the default by Flickr. Fig. 6 (bottom right) shows that our hierarchy agrees more with human ground-truth than the others.
4. Using the Semantivisual Image Hierarchy A good image hierarchy can serve as a knowledge ontology for difficult recognition tasks such as image classification and annotation. In the following experiments, we choose three tasks to show the applications of the hierarchy.
4.1. Hierarchical Annotation of Images Given our learned image ontology, we can propose a hierarchical annotation of an unlabeled query image, such as photo→zoo→bird→flamingo. For an unannotated image I with the posterior path assignments represented as |S | SC = {CI1 , CI2 , · · · , CI C }, the probability of tag W for 4 The
root node is kept intact because “photo” is always assigned to it.
Photo
More...
Football
Beach
Event
Architecture
Food
Garden
Holiday
Sunset
More...
More...
More...
More...
More...
More...
More...
More...
Garden
Event
Holiday
More...
More...
More...
Plant
Wedding
More...
Lily
More...
Decoration
Birthday
More...
More...
Tulip
Gown
Flower
More...
More...
More...
More...
Dance
Cake
Light
Tree
More...
More...
More...
More...
Football
Food
Architecture
More...
More...
More...
Stadium
Match
Dinner
Sushi
Cake
Tower
Business District
More...
More...
More...
More...
More...
More...
More...
Human
Field
Cheese
Rice
Sugar
Facade
Stairs
More...
More...
More...
More...
More...
More...
More...
Figure 5. Visualization of the learned image hierarchy. Each node on the hierarchy is represented by a colored plate, which contains four randomly sampled images associated with this node. The color of the plate indicates the level on the hierarchy. A node is also depicted by a set of tags, where only the first tag is explicitly spelled out. The top subtree shows the root node “photo” and some of its children. The rest of this figure shows six representative sub-trees of the hierarchy: “event”, “architecture”, “food”, “garden”, “holiday” and “football”.
level l is estimated by averaging the paths in SC , p(W |I, level = l) ≈ (1/|SC |)
P|SC | i=1
p(W |ϕ ˜i , CIi (l)),
where ϕ˜i is the MAP (maximum a posterior) estimate of tag concept distributions from the training data given the ith sample, CIi (l) specifies the node in path CIi at level l
and p(W |ϕ, ˜ CIi (l)) indicates the probability of tag W given i node CI (l) and ϕ, ˜ i.e. ϕ˜CIi (l),W . We show in Fig. 7 examples of the hierarchical image annotation results and the accuracy for 4000 testing images evaluated by using our image hierarchy and the nCRP algo-
Ave. Acc. = 30%
30%
5
15 20 25 30
building photo landscape sky people cake dress garden Corr-LDA architecture flower photo wedding gown Ours bride flower
Alipr
card people female fashion cloth photo birthday bird architecture portrait photo birthday kid cake human
people ocean water landscape snow light cloud photo city human photo cloud sky architecture building
38%
15% 12% 9%
40 5
10 15 20 25 30 35 40
Our Model SPM
SVM Bart et al. Corr-LDA LDA
74%
rithm [5]5 . Our experiment shows that our semantivisual hierarchical model outperforms the text-only model [5]. There are two reasons. First, [5] cannot perform well on sparse tag words (about 4 tags per image in our dataset). Its proposed hierarchy has many words assigned to the root node, resulting in very few paths. This hierarchy cannot demonstrate the real structure of the image-text data. Second, a simple clustering algorithm such as KNN cannot find a good association between the test images and the training images in our challenging dataset with large visual diversity. In contrast, our model learns an accurate association of visual and text data simultaneously.
4.2. Image Labeling Serving as an image and text knowledge ontology, our semantivisual hierarchy and model can be used for image labeling without a hierarchical relation. This is the image annotation task. For a test image I and its pos|S | terior samples SC = {CI1 , CI2 , · · · , CI c } and SZ = |S | {ZI1 , ZI2 , · · · , ZI Z } (|SC | = |SZ |). We estimate the probability of tag W given the image I as, P|SC | PL i=1
35
18%
44%
Figure 8. Results of the image labeling experiment. We show example images and annotations by using our hierarchy, the CorrLDA model [6] and the Alipr algorithm [23]. The numbers on the right are quantitative evaluations of these three methods by using an AMT evaluation task.
p(W |I) ≈ (1/|SC |)
23%
Average performance
10
˜i , CIi (l))p(l|ZIi ), l=1 p(W |ϕ
which sums over all the region assignments over all levels. Here p(l|ZIi ) is the empirical distribution over the levels for image I. In this setting, the most related words will be proposed regardless of which level they are associated to. Quantitatively, we compare our method with two other image annotation methods: the Corr-LDA [6] and a widely known CBIR method Alipr [23]. We collect the top 5 predicted words of each image by each algorithm and present them to the AMT users. The users then identify if the words are related to the images in a similar fashion as Fig. 6(top). 5 Note that the original form of [5] is only designed to handle textual data. For comparison purposes, we allow it to annotate images by applying the KNN algorithm to associate the testing images with the training images and represent the hierarchical annotation of the test image by using the tag path of the top 100 training images.
Ours SPM SVM Bart et al. Corr-LDA LDA
Bride Building London Soccer Friends Italia
Christmas Flower Party City High School High School
City Sushi Sushi Present Italia Child
Dessert Child Italy Sun Dinner Party
Party Friends Christmas Fruit Cake Cake
Figure 9. Comparison of classification results. Top Left: Overall performance. Confusion table for the 40-way Flickr images classification. Rows represent the models for each class while the columns represent the ground truth classes. Top Right: Comparison with different models. Percentage on each bar represents the average scene classification performance. Corr-LDA also has the same tag input as ours. Bottom: classification example. Example images that our algorithm correctly classified but all other algorithms misclassified.
Fig. 8 shows that our model outperforms Alipr and CorrLDA according to the AMT user evaluation. As shown in Fig. 8(first image column), Alipr tries to propose words such as “landscape” and “photo” which are generally applicable for all images. Corr-LDA provides relatively more related annotation such as “flower” and “garden” based on the co-occurrence of the image appearance and the tags among the training images. Our algorithm provides both general and specific descriptions, e.g. “wedding”, “flower” and “gown”. This is largely because our model captures the hierarchical structure of images and tags.
4.3. Image Classification Finally, we evaluate our model on a highly challenging image classification task. Another 4, 000 images are held out as test images from the 40 classes. Each image is represented by the estimated concept distribution over the entire hierarchy. If there are K nodes in the learned hierarchy, the dimension of the distribution is K. Only nodes that are associated to the image have nonzero values in the distribution. We calculate the χ2 -distances between the concept distribution of the test images and those of the training images. The KNN algorithm is then applied to obtain the class label. Fig. 9 shows the confusion table of classification achieved by our algorithm. In the bar plot in Fig.9, we compare our result to spatial pyramid matching (SPM) [21], SVM [12], Bart et. al. [4], Corr-LDA [6] and LDA [7]. From Fig. 9 (top right), we observe that LDA [7] gives the lowest classification performance. This shows that a flat
single modality model cannot capture the complex structure of our challenging dataset. The classification performance improves by incorporating semantic meaning of the images in training (Corr-LDA [6]) or a more descriptive hierarchical representation [4]. By encoding semantic meaning to the hierarchy, our semantivisual hierarchy delivers a more descriptive structure, which could be helpful for classification. Finally, comparison among our algorithm, SPM and SVM demonstrates the importance of semantic meaning in interpreting complicate and noisy real world images such as “Christmas” or “party” photos.
5. Conclusion In this paper, we use images and their tags to construct a meaningful hierarchy, termed the semantivisual hierarchy. The quality of the hierarchy is quantitatively evaluated by human subjects. We then use several end tasks to illustrate its wide applications. The dataset, code and supplementary material will be available at http://vision.stanford.edu/projects/lijiali/CVPR10/. Acknowledgement. We thank Barry Chai, Jia Deng and anonymous reviewers for their helpful comments. Li Fei-Fei is funded by an NSF CAREER grant (IIS-0845230), a Google research award, and a Microsoft Research fellowship. David M. Blei is supported by ONR 175-6343 and NSF CAREER 0745520.
References [1] N. Ahuja and S. Todorovic. Learning the Taxonomy and Models of Categories Present in Arbitrary Images. In ICCV, 2007. [2] P. Arbel´aez and L. Cohen. Constrained image segmentation from hierarchical boundaries. In CVPR, 2008. [3] K. Barnard, P. Duygulu, D. Forsyth, N. de Freitas, D. Blei, and M. Jordan. Matching words and pictures. JMLR, 2003. [4] E. Bart, I. Porteous, P. Perona, and M. Welling. Unsupervised learning of visual taxonomies. CVPR, 2008. [5] D. Blei, T. Griffiths, M. Jordan, and J. Tenenbaum. Hierarchical Topic Models and the Nested Chinese Restaurant Process. In NIPS, 2004. [6] D. Blei and M. Jordan. Modeling annotated data. SIGIR, 2003. [7] D. Blei, A. Ng, and M. Jordan. Latent Dirichlet allocation. JMLR, 3:993–1022, 2003. [8] L. Cao, J. Yu, J. Luo, and T. Huang. Enhancing semantic and geographic annotation of web images via logistic canonical correlation regression. In ACM MM, 2009. [9] P. Carbonetto, N. de Freitas, and K. Barnard. A statistical model for general contextual object recognition. ECCV, 2004. [10] J. Chang, J. Boyd-Graber, C. Wang, S. Gerrish, and D. M. Blei. Reading tea leaves: How humans interpret topic models. In NIPS, 2009. [11] D. Crandall, L. Backstrom, D. Huttenlocher, and J. Kleinberg. Mapping the world’s photos. In WWW, 2009.
[12] N. Cristianini and J. Shawe-Taylor. An introduction to support Vector Machines: and other kernel-based learning methods. Cambridge Univ Pr, 2000. [13] R. Datta, W. Ge, J. Li, and J. Wang. Toward bridging the annotation-retrieval gap in image search. IEEE MM, 2007. [14] P. Duygulu, K. Barnard, N. de Freitas, and D. Forsyth. Object recognition as machine translation: Learning a lexicon for a fixed image vocabulary. ECCV, 2002. [15] A. Gelfand and A. Smith. Sampling-based approaches to calculating marginal densities. Journal of the American statistical association, 1990. [16] G. Griffin and P. Perona. Learning and Using Taxonomies For Fast Visual Categorization. In CVPR, 2008. [17] T. Hofmann. Probabilistic latent semantic indexing. SIGIR, 1999. [18] J. Jia, N. Yu, and X. Hua. Annotating personal albums via web mining. ACM MM, 2008. [19] Y. Jin, L. Khan, L. Wang, and M. Awad. Image annotations by combining multiple evidence & WordNet. In ACM MM, 2005. [20] D. Joshi, R. Datta, Z. Zhuang, W. Weiss, M. Friedenberg, J. Li, and J. Wang. Paragrab: A comprehensive architecture for web image management and multimodal querying. In VLDB, 2006. [21] S. Lazebnik, C. Schmid, and J. Ponce. Beyond bags of features: Spatial pyramid matching for recognizing natural scene categories. In CVPR, 2006. [22] T. Leung and J. Malik. Representing and recognizing the visual appearance of materials using three-dimensional textons. IJCV, 43(1), 2001. [23] J. Li and J. Wang. Automatic Linguistic Indexing of Pictures by a statistical modeling approach. PAMI, 25(9), 2003. [24] L.-J. Li, R. Socher, and L. Fei-Fei. Towards total scene understanding:classification, annotation and segmentation in an automatic framework. In CVPR, 2009. [25] D. Lowe. Object recognition from local scale-invariant features. In ICCV, 1999. [26] M. Marszalek and C. Schmid. Semantic Hierarchies for Visual Object Recognition. In CVPR, 2007. [27] M. Marszalek and C. Schmid. Constructing Category Hierarchies for Visual Recognition. ECCV, 2008. [28] G. Miller. WordNet: A Lexical Database for English. COMMUNICATIONS OF THE ACM, 1995. [29] E. Rosch, C. Mervis, W. Gray, and D. Johnson. Basic objects in natural categories. Cognitive Psychology, 8, 1976. [30] J. Sivic, B. Russell, A. Zisserman, W. Freeman, and A. Efros. Unsupervised discovery of visual object class hierarchies. In CVPR, 2008. [31] R. Snow, D. Jurafsky, and A. Ng. Semantic taxonomy induction from heterogenous evidence. In ACL, 2006. [32] A. Torralba, R. Fergus, and W. Freeman. Million tiny images: A large data set for nonparametric object and scene recognition. PAMI, 30(11):1958–1970, 80. [33] C. Wang, D. Blei, and L. Fei-Fei. Simultaneous image classification and annotation. In CVPR, 2009. [34] J. Winn, A. Criminisi, and T. Minka. Object categorization by learned universal visual dictionary. In CVPR, 2005.