The new availability of very high spatial resolution satellite images offers a mapping potential ... the extraction methods should be adapted to these new images.
BUILDING EXTRACTION FROM VERY HIGH SPATIAL RESOLUTION IMAGE S. Lhomme a, b, C. Weber a, D-C. He b , D. Morin b , A. Puissant a a
b
Laboratoire Image et Ville, Faculté de Géographie et d’Aménagement, Strasbourg, France (stephane, chris, anne) @lorraine.u-strasbg.fr
Centre d’Applications et de Recherches en Télédétection (CARTEL),Université de Sherbrooke, Canada (Dong-Chen.He, Denis.Morin)@USherbrooke.ca
KEYWORDS: Building extraction, DRV feature, IKONOS, Urban building, Very high spatial resolution images ABSTRACT The new availability of very high spatial resolution satellite images offers a mapping potential for scales reaching from 1: 5000 to 1: 10000. The urban man-made objects such as buildings can be delimited. However problems and difficulties can appear, particularly in the high local variance environment and spectral signatures disturbances context. The extraction methods should be adapted to these new images. Two principal techniques are currently explored for automatic building extraction from very high spatial resolution satellite images: the “zonal” approach and the improvement of per-pixel classification. This paper proposes an original detection approach of building’s centres based on variance features. A unique parameter is used, taking into account jointly the variance of building and its close neighbourhood. The proposed method has been applied to a panchromatic IKONOS image (1 metre resolution) in an urban area. Although the methodology is not entirely completed and needs additional developments, the preliminary results encourage us to continue the research in this direction.
1. INTRODUCTION The new availability of very high resolution satellite images offers a mapping potential for scales reaching from 1 : 5000 to 1 : 10000 (Puissant et al, 2002 ; Jacobsen, 2003). The manmade objects such as buildings can be easily detected. The researches in this domain allow to expect significant results in the field of remote sensing in urban areas. However the real potentialities dealing with such high resolution image data remain relatively unknown. Problems and difficulties appear when extracting the objects with high local variance context and spectral signatures disturbances (Lhomme et al, 2004). Thus, the extraction methods should be adapted to these new images. This paper focuses on building extraction in urban areas. Two principal techniques are often reported in the literature for automatic building extraction from very high resolution satellite images: the “zonal” approach and the improvement of per-pixel classification. Other approaches are also explored as for example mathematical morphology (Pesaresi et al, 2001) or Fourrier transform (Sohn et al, 2001). The “zonal ” approach (also called “object-oriented approach”) is not based on pixels classification but on the image segments classification. Image is first segmented and a set of features (spectral, spatial, relational…) is computed for each segment. These features can then be used for segment classification. Different “zonal” methods have been recently developed (Guindon, 2000; Hofmann, 2001). The main problem, in our opinion, is the inaccurate spatial relation between objects and segments. Improvement of per-pixel classification is based on the introduction of semantic information. The main goal is to improve building borders delimitation. The information on spatial relations between the different land cover types can be used to improve per-pixel classifications. Different methods, more or less complex, have been recently developed (Teffelen et al, 2001, Bianchin et al, 2003 ; Van De Voorde et al, 2003).
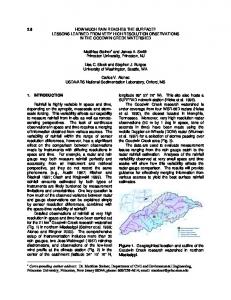
In this paper an original building detection approach is proposed based only on variance features. Theory and methodology is studied first. An application to a panchromatic IKONOS image on a suburban area is then presented. 2. BUILDING EXTRACTION APPROACH 2.1 Principe With very high spatial resolution satellite images a building zone can be defined by "a pixel-cluster with specific size and shape showing a low internal grey level variation and a strong variation in its close neighbourhood". If the whole image is not considered but only a pixel-cluster with specific size and shape (for example a 15 by 21 pixels zone), it becomes possible to simplify this building zone definition by " a pixel-cluster showing a low internal grey level variation and a strong variation in its close neighbourhood". This way, the building zone definition is significantly simplified. In the present building detection approach, it is proposed to search discriminate features inside pixel-cluster with specific size and shape. These pixel-clusters are called "search zones". Firstly the "search zones" is defined; secondly the variations of grey level and the spatial distributions of these variations are quantified. 2.2 " Search zone " definition The "searching zone" should contain the pixels corresponding to the building and its close neighbourhood. Two different subzones can be distinguished from one "search zone". - (a) “building body”: it corresponds to the building location on the image. It contains only pixels that refer undoubtedly to a roof. Thus, to eliminate the potential mixels, one pixel width zone is erased on the entire building perimeter (figure 1).
- (b) “building periphery”: it corresponds to the close neighbourhood of the building. It includes all the pixels that refer to the transition between the building and its close neighbourhood. Thus, a two pixels width zone, located from both sides of the building limits (i.e. around the “building body”) can be defined ( figure 1). Figure 1 shows a 15 by 21 pixels "search zone" used to discriminate the buildings of 13 by 19 pixels (the subdivision in four zones of the “building periphery” is explained in the following sections).
This variance can be calculated in different window sizes. Our goal is to quantify the local grey level variation inside a small zone (building body, building periphery). Thus, a minimum window of 3 x 3 pixels is chosen.
2.4 Quantification of the spatial distribution of grey level variations It is necessary to quantify the spatial distribution of grey level variations. The goal is to discriminate a spatial distribution characteristic of a building to an other spatial distribution. The notions of “building body” and “building periphery” previously defined, are used here. The spatial distribution of grey levels variations of a building could respond to the following three principal requirements:
• A low variance value for the pixels corresponding to the “building body”. This variation can be quantified by the mean variance of the “building body”.
true building borders
side 1 ; mask 1
“building periphery”
side 2 ; mask 2
“building body”
side 3 ; mask 3
building centre
side 4 ; mask 4
Figure 1. "search zone" definition The size and the shape of the building body and of the building periphery should be adapted to the real size of the building to discriminate. Thus, this building detection approach requires as many "search zones" sizes as the different real building sizes presented on the image.
• A high variance value for the pixels corresponding to the “building periphery”. This variation can be quantified by the mean variance of the “building periphery”. However this requirement is not sufficient to describe completely the variance value of the close building neighbourhood. Indeed, it does not take into account the variance repartition between the different building borders sides. To resolve this problem, a new condition is added: the variance value must be uniformly distributed on the greatest possible number of “building periphery” sides. In order to quantify this additional requirement the “building periphery” is subdivided in four zones, corresponding to the four building sides (sides 1, 2, 3 and 4 in figure 1). Then, the mean variance is extracted from each side and the results are multiplied by each order. This multiplication increases the total “building periphery” variance value in the case of a uniform distribution, and decreases the total “building periphery” variance value when the high variance is concentrated on a restricted number of sides. The result of this multiplication is then put on a forth-square root in order to get the same range of variance value as the “building body” (numerator equation 2). • The variance values of the building body and of the building periphery should be taken into account jointly. This is carried out by a simple division of the mean “building periphery” variance by the mean “building body” variance (equation 2). Spatial distribution of grey level variation of a building and its close neighbourhood is finally quantified by a unique parameter described in equation 2. This parameter is called "Discrimination by Ratio of Variance" (DRV).
2.3 Quantification of grey level variations Various parameters can be used in order to quantify grey level variations for a searching window (data range, interquartil, variance). The variance, defined in the equation (1) is used here because it takes into account all the pixels of the window. Var =
M N (Xi, j−X) 2
i =1j=1
(1)
M*N
Where: i and j : row and column pixel index M and N : row and column size of the window Xi,j : value of the pixel at position (i, j) X : mean value of all the pixels in the window
DRV =
4 MeanVarS1)*(MeanVarS2)*(MeanVarS3)*(MeanVarS4)
MeanVarBody (2)
Where: MeanVarS1, 2, 3 and 4: mean variance on the side 1, 2, 3 and 4 MeanVarBody: mean variance of the “building body” According to our definition, a building usually shows a high variance of a minimum number of sides and a low variance of the body. That will result in a strong DRV value. So the DRV value could be used to discriminate buildings from other land cover types.
2.5 Application The described methodology is applied to an IKONOS panchromatic image in order to extract the building centre. The study site is firstly presented. The proposed methodology is detailed into three steps: (2.5.2) variance values computing; (2.5.3) DRV values computing and (2.5.4) building extraction.
2.5.1 Study site: A small image (388 by 190 pixels) extracted from an IKONOS image of Sherbrooke City (Quebec, Canada) is used. It is acquired on May 20, 2001 at 10h50 (local time). Only the panchromatic band (1 metre resolution) is used (image (a), figure 2). The methodology is tested on this site because it contains buildings with similar sizes and orientations but with different roof colours. Moreover a ground truth is available. 2.5.2 Variance computing: The variance is computed over the image by a moving window of 3 x 3 pixels. For each window position the computing result (detailed in equation 1) is assigned to the central pixel. This operation is carried out on ENVI software (3.6 version, Copyright © 2002, research Systems, Inc). The calculated variance image contains a wide range of variance values (0 to 13918) (image (b), figure 2)
With very high spatial resolution satellite images in urban area, the local variance can be very important due to noise or "foreign" elements (metallic chimney on a roof, vehicle on a road...) or very low due to the shadowing. In order to avoid these potential problems, the variance values are reduced into two values (image (c), figure 2). A binary process is applied to the variance image by a simple threshold operation. The used threshold limit corresponds to the median value of the variance image. It is important to note that this step of processing does not need any intervention of the operator, so the whole process can be automatically realised.
2.5.3 DRV values computing: The global process of DRV values computing that can be applied to all the building sizes is presented. In this example only the case of a 15 by 21 pixels "search zone” is showed, corresponding to the building size of 13 by 19 pixels. From the binary variance image, the mean variance values are calculated for each of five interest zones (the body and the 4 periphery sides). This is generated by a simultaneous convolution of the five masks (corresponding to the first zone of the “building body” and to the four zones for the ”building periphery”). The operation is carried out over the whole image and the DRV is then computed (figure 3) as indicated in the equation (2) for each image point and assigned to the central pixel of the "search zone" (red square, figure 1). In the case of presence of several different building sizes, this DRV computing process should be repeated for each corresponding "searching zone" size.
(a) : original image
Figure 3. DRV image (13 by 19 pixels size buildings; darker pixels have lower values)
(b) : variance image (darker pixels have lower values)
(c): binary variance image : ( white: high values) Figure 2. Variance computing
2.5.4 Building extraction: The DRV values can be directly used to extract buildings without any additional spatial or spectral information or feature. First of all, the low DRV values are eliminated by a threshold operation in order to erase pixels that do not correspond, unquestionably, to a building. Threshold value is selected by “training”. A new image containing only DRV values higher than the threshold value is obtained. Then, the local maxima DRV values (figure 4) are extracted from this image. These local maxima are supposed to indicate building’s centres. It should be noted that, as for the previous steps, these local maximum DRV values are associated to a specific "search zone" size.
Figure 4: local maximum DRV image. (13 by 19 pixels size building) In the present work, the extraction process is limited of three building sizes (13*19, 19*13 and 13*13 pixels) corresponding to the approximate majority building sizes located on the original image. All the accurate building sizes and orientations are not taken into account. Moreover, just one study zone, is tested. Thus, the results should be considered as preliminary. The local maxima DRV associated to the three building sizes (13*19, 19*13 and 13*13 pixels) are individually extracted. Then, they are gathered to build a single local maxima DRV image. If different local maxima DRV exist for the same pixel, the highest DRV value is conserved. Then a final number of 77 local maxima DRV points are obtained (figure 5).
2.6 Evaluation and discussion In order to evaluate the preliminary DRV building extraction results, the DRV image is plotted over the ground truth image (figure 5).
23 commissions errors correspond to roads). Moreover, further tests showed that these commission errors increase with the number of "search zone" sizes used for the building extraction process. These preliminary results show that the DRV is an interesting tool to locate building’s centres. The major problem seems to be the high number of local maxima DRV points, which are not associated to building location. In addition, this extraction process is limited to the basic building shapes (square, rectangle) with specific orientations. Indeed this building extraction approach is only based on panchromatic variance values. It is supposed that the use of other image features would improve significantly the results, especially by decreasing the commission errors. The methodology using the DRV directly computed from the original variance image (image (b), figure 2) has been also tested. Results are similar to these presented here. However, small differences are noticed. The binary image variance allows a better extraction of buildings with different roof colours. At the opposite, the original image variance allows a better extraction of buildings with low contrast borders. Additional tests have to be carried out in order to define the variance image (original or binary) to be used for DRV computing.
3. CONCLUSION This paper deals with buildings extraction from very high spatial resolution satellite images. An original detection approach of building’s centres is proposed, only based on a parameter (DRV) taking into account jointly the variance of building and its close neighbourhood. This parameter is tested to extract buildings centres from a panchromatic IKONOS image in an urban area. Preliminary results show that the DRV is an interesting tool for building detection, although the methodology needs additional developments. The major problem is the high commissions errors, which could be reduced by using additional spatial and spectral information or features.
REFERENCES local maxima DRV ; building (19*13 pixels) local maxima DRV ; building (13*19 pixels) local maxima DRV ; building (13*13 pixels) building (ground truth) Figure 5. Building extraction results Some comments can be derived from figure 5: • 53 of the 69 buildings (77 %) are extracted. Some errors can be noticed on extracted building size and building accurate location. For example one 13*19 is extracted as “13*13” pixels building size, while some local maxima RDV are not accurately located in the centre of building (confusion between building borders and building shadow borders). • 16 of the 69 buildings (23 %) are not extracted. Parts of these 16 buildings have different sizes than the three selected “search size”. It is supposed that these buildings would be extracted by an adapted "search zone" size. • 23 of the 77 maxima variances values (30 %) are not associated to buildings on the ground truth image (13 of these
Bianchin A., Bravin L., “land use in urban context from IKONOS image : a case study”, The International Archives Of The Photogrammetry, remote Sensing and Spatial information Sciences (CD-ROM), Vol XXXIV-7/W9, Regensburg, germany, 27-29 June 2003. Guindon, B “A Framework for the Development and Assessment of Object Recognition Modules for High Resolution Satellite Images”. Canadian Journal of remote Sensing, vol 26, No 4, 2000, p 334-348. Hofmann, P. “detecting urban features from IKONOS data using an object-oriented approach”, joint Worshop urban 2001, May 22 ,2001. Jacobsen, K. “Mapping with IKONOS images”. Proceedings of 22nd EARSeL Symposium, Prague, 2002, 7 p Lhomme, S., He D.C., et Morin, D. « Évaluation de la qualité d’une image Ikonos pour l’identification du bâti en milieu urbain », Télédétection vol. 3, no 5, 2004.
Pesaresi M., Benediktsson J. A., “A new approach for the Morphological segmentation of High-Resolution Imagery” IEEE Transaction on Geoscience and Remote sensing, vol. 39, 2001, pp.309-320. Puissant, A. Weber, C., “The Utility of Very High Spatial Resolution Images to Identify Urban Objects “, Geocarto Internationnal, vol. 17, N 1, 2002, pp.31-41. Sohn G., Dowman I.J. “extraction of buildings from highresolution satellite data” in “Automatic Extraction of ManMade Objects from Aerial and Space Images (III)” Balkema ,2001. Teeffelen P.B.M. van, L. van den Berg, S.M. de Jong, “Urban Monitoring : New Possibilities of Combining High Spatial Resolution Ikonos Images with Contextual Image Analysis Techniques”. Proceedings of the IEEE/ISPRS Joint Workshop on Remote Sensing and Data Fusion over Urban Areas, Rome. November, 2001, pp265-269. Van De Voorde T., Canters F., De Genst W., Stephenne N., Wolff E., Binard M.“Extraction of land use/land cover related information from very high resolution data in urban and suburban areas”. EARSeL Symposium Remote Sensing in Transition, 2 – 5 June 2003, Ghent