Building Personalized Activity Recognition Models with Scarce Labeled Data based on Class Similarities Enrique Garcia-Ceja1 and Ramon Brena1 Tecnol´ ogico de Monterrey, Campus Monterrey, Av. Eugenio Garza Sada 2501 Sur, Monterrey, N.L., M´exico
[email protected],
[email protected]
Abstract. With the recent advent of new devices with embedded sensors, human activity recognition (HAR) has become a trending topic in the last years because of its potential applications in pervasive health care, assisted living, exercise monitoring, etc. Most of the works on HAR either require from the user to label the activities as they are performed so the system can learn them, or rely on a trained device that expects a “typical” ideal user. The first approach is impractical, as the training process easily become time consuming, expensive, etc., while the second one drops the HAR precision for many non-typical users. In this work we propose a ”crowdsourcing” method for building personalized models for HAR by combining the advantages of both user-dependent and userindependent models; we detect groups of users that behave in a similar way to the one under consideration, so a more fitted personalized model could be constructed with scarce data. Keywords: activity recognition – wearable sensors – accelerometer – model personalization
1
Introduction
In the last years Human Activity Recognition (HAR) [1] has gained a lot of attention because of its wide range of applications in several areas such as health and elder care, sports, etc. [2, 3, 4]. Inferring the current activity being performed by an individual or group of people can provide valuable information in the process of understanding the context and situation in a given environment and as a consequence, personalized services can be delivered. Recently, the use of wearable sensors has become the most common approach to recognize physical activities because of its unobtrusiveness and ubiquity –specifically the use of accelerometers [4, 5, 6] because they are already embedded in several devices and they raise less privacy concerns than other types of sensors. One of the problems in HAR systems is the labeling process for the training data which is tedious, time consuming, difficult and prone to errors. This problem has really hindered the practical application of HAR systems, limiting them to the most basic activities, for which a general model is enough, as is the
2
case for the pedometer function or alerting the user who spends too much time quiet sitting down, both functions now available in some fitting devices and smartwatches. On the other hand, when trying to o↵er personalized HAR, there is the problem that at the initial state of a system there is little or no information at all (in our case, sensor data and labels). In the field of recommender systems (e.g., movie, music, book recommenders) this is known as the cold-start problem [7] and it includes the situation when there is a new user but nothing or little is known about him/her, in which case it becomes difficult to recommend an item, service, etc. It also encompasses the situation when a new item is added to the system but since no one has yet rated, purchased or used that item, then it is difficult to recommend it to the users. In this work we will focus in the situation when there is a new user in the system and we want to infer his/her physical activities from sensor data with high accuracy even when there is little information about that particular user, assuming that the system already has data from many other users and also that their associated data is already labeled. We are thus attempting to use a ”crowdsourcing” approach which consists in using collective data to fit personal data. The key insight in our approach is that instead of building a model with all the data from all other users, we will use the scarce labeled data from the target user to select a subset of the other users’ data based on class similarities to build a personalized model. The rational behind this idea is that the way people move varies between individuals so we want to exclude instances from the training set that are very di↵erent from those of the target user in order to remove noise. This paper is organized as follows: Section 2 presents some related work. Section 3 details the process of building a Personalized Model. The experiments are described in Section 4. Finally in Section 5 we draw our conclusions.
2
Related Work
From the reviewed literature, broadly three di↵erent types of models in HAR can be identified–namely: General, User-Dependent, and Mixed models. General Models (GM): Sometimes also called User-Independent Models, Impersonal Models, etc. and from now on we will refer to them as GMs. For each specific user i a model is constructed using the data from all other users j, j 6= i; the accuracy is calculated using the model with the data from user i. User-Dependent Models (UDM): They are also called User-Specific Models, here we will refer to them as UDMs. In this case, individual models are trained and evaluated for a user using just her/his own data. Mixed Models (MM): In [8] they call them Hybrid models. This type of model tries to combine GMs and UDMs in the hope of adding their respective strengths, and usually is trained using all the aggregated data of the target user and also other previous users. There are some works in HAR that have used the UDM and/or GM approach [9, 10, 11]. The disadvantages of GM are mostly related to their lack of precision,
3
because the data from many dissimilar users is just aggregated. This limits the GM HAR systems to very simple applications such as pedometers and detection of long periods of sitting down. The disadvantages of UDM HAR systems are related to the difficulties of labeling her/his data for the user, as the training process easily become time consuming and expensive, so in practice users avoid it. For UDMs, several techniques have been used to help users labeling the data, as it is the weakest link in the process. For example, in [12] a mobile application was built in which the user can select several activities from a predefined list. In [13], they first video-recorded the data collection session and then manually labeled the data. Some other works have used a Bluetooth headset combined with speech recognition software to perform the annotations [14] whereas in [15] the annotations were made manually by taking notes. Anyway labeling personal activity remains being very time-consuming and undesirable indeed. From the previous comments, apparently MMs look like a very promising approach, because they could cope with the disadvantages of both GM and UDM, but in practice combining the stregths of both has been an elusive goal; as noted by Lockhart & Weiss [8], no such system has made it to actual deployment. There have been several works that have studied the problem of scarce labeled data in HAR systems [16, 17] and used Semi-supervised learning [18] methods to deal with the problem, however they follow a Mixed model approach, i.e., they do not distinguish between users. Model personalization/adaptation refers to training and adapting classifiers for a specific user according to his/her own needs. Building a model with data from many users and using it to classify activities for a target user will introduce noise due to the diversity between users. Lane et al. [19] showed that there is a significant di↵erence for the walking activity between two di↵erent groups of people (20-40 and > 65 years old). Parviainen et al. [20] also argued that a single general model for activity classification will not perform well due to individual di↵erences and proposed an algorithm to adapt the classification for each individual by only requesting binary feedback from the user. In [21] they used a model adaptation algorithm (Maximum A Posteriori) for stress detection using audio data. In this case all users start with a general model and then it gets adapted to each individual as more data is available. Abdallah et al. [22] proposed an incremental and active learning approach for activity recognition to adapt a classification model as new sensory data arrives. In [23] they proposed a personalization algorithm that uses clustering and a Support Vector Machine that first, trains a model using data from user A and then personalizes it for another person B, however they did not specify how should user A be chosen. This can be seen as a 1 ! n relationship in the sense that the base model is built using data from a specific user A and the personalization of all other users is based solely on A. In real life scenarios a n ! 1 relationship is more desirable, i.e., use data from a collection of di↵erent users to personalize a model for a specific user. Our work di↵ers from this one in that we follow a n ! 1 approach and the proposed method is not tied to any particular classification algorithm.
4
In work [19] they personalize models for each user by first building Community Similarity Networks (CSN) for di↵erent dimensions such as: physical similarity (weight, height, age), lifestyle similarity (diurnal patterns, mobility, etc.) and sensor-data similarity. Then they use the CSNs edge weights to train a Boosting classifier for each dimension and finally the classifiers are unified into a single ensemble classifier. Our study di↵ers from this one in two key aspects: First, instead of looking for inter-user similarities we find similarities between classes of activities. This is because two users may be similar overall but still, there may be activities that are performed very di↵erently between them. Second, we just use accelerometer data to find similarities since other types of data (age, locations, height, etc.) are usually not available or impose privacy concerns. Furthermore, we evaluated the proposed method on 4 di↵erent datasets collected by independent researchers. In this work we will use an approach that is between GMs and UDMs, so it could be seen as a variation on mixed models, but here we use a small amount of the user’s available data to select a subset of the other users’ activities instances to complement the data from the considered user, instead of just aggregating the user data with any other user data. This selection is made based on class similarities and the details will be presented in Section 3.
3
Personalized Models
In this section we describe how a Personalized Model (PM) is trained for a given target user ut . A General Model (GM) includes all instances from users Uother , where Uother is the set of all users excluding the target user ut . In this case there may be di↵erences between users on how they perform each activity (e.g., some people tend to walk faster than others) so this approach will introduce noisy instances to the train set and thus, the resulting model will not be very accurate when recognizing activities for ut . The idea of building a PM is to use the scarce labeled data of ut to select instances from a set of users Usimilar , where Usimilar is the set of users similar to ut according to some similarity criteria. Building PMs for activity recognition was already studied by Lane et al. [19], with the limitations we already explain in the preceding section. In our approach, we look for similarities per class instead of a per user basis, i.e., the final model will be built using only the instances that are similar to those of ut for each class. Procedure 1 presents the proposed algorithm to build a PM based on class similarities. The procedure starts by iterating through each possible class c. Within each iteration, instances of class c from the ut train set ⌧t and all the instances of class c that belong to all other users are stored in dataall . The function subset(set, c) returns all the instances in set of class c. Function instances(U ) returns all the instances that belong to the set of users U . Next, all instances in dataall are clustered using k-means algorithm for k = 2...U pperBound. For each k, the Silhouette clustering quality index [24] of the resulting groups is computed and the k that produces the optimal quality index is chosen. A clustering quality index
5
Procedure 1 Build PM 1: T {} . Start with an empty train set 2: for c in C do . For each class 3: datat subset(⌧t , c) . ⌧t is the target user’s train set 4: dataother subset(instances(Uother ), c) 5: dataall datat [ dataother 6: Cluster dataall using k-means for k = 2..U pperBound and select the optimal k according to some clustering quality index. 7: S arg maxg2G |datat \ g| . G is the set of the resulting k groups 8: T T [ S [ datat 9: end for 10: weight(T) . Assign a weight to each instance such that the importance of ⌧t increases as more training data of the target user is available. 11: Build model using training set T.
[25] is a measure of the quality of the resulting clustering based on compactness and separation. The Silhouette index was chosen because it has been shown to produce good results with di↵erent datasets [25]. Next, instances from the cluster in which the majority of instances from datat ended up is added to the final training set T. Also all instances from datat that ended up in other clusters are added to T. After the f or loop, all instances in T are assigned an importance weight as a function of the size of ⌧t such that instances from the ut train set have more impact as more training data is available for that specific user. The exponential decay function y = (1 r)x was used to assign the weights where r is a decay rate parameter and x = |⌧t |. The weight of all instances in T that are not in ⌧t is set to y and the weight of all instances in ⌧t is set to 1 y. Finally, the model is built using T with the new instances’ weights. Note that the classification model needs to have support for instance weighting. In this case we used a decision tree implementation called rpart [26], which supports instance weighting.
4
Experiments and Results
We conducted our experiments with 4 publicly available datasets. D1: Chest Sensor Dataset [27, 28]; D2: Wrist Sensor Dataset [29, 30]; D3: WISDM Dataset [31, 32]; D4: Smartphone Dataset [13, 33]. For datasets D1 and D2, 16 common statistical features on fixed length windows were extracted. The features were: mean for each axis, standard deviation for each axis, maximum value of each axis, correlation between each pair of axes, mean of the magnitude, standard deviation of the magnitude, mean di↵erence of the magnitude and area under the curve of the magnitude. D3 already included 46 features and D4 already included 561 extracted features from the accelerometer and gyroscope sensors. Several works in HAR perform the experiments by first collecting data from one or several users and then evaluating their methods using k-fold cross validation (being 10 the most typical value for k) on the aggregated data. For a
6
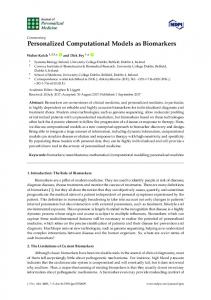
k = 10 this means that all the data is randomly divided into 10 subsets of approximately equal size. Then, 10 iterations are performed. In each iteration a subset is chosen as the test set and the remaining k 1 subsets are used as the train set. For this example, this means that 90% of the data is completely labeled and the remaining 10% is unknown, however, in real life situations it is more likely that just a fraction of the data will be labeled. In our experiments we want to consider the situation when the target user has just a small amount of labeled data. The models’ evaluation consists of sampling a small percent p of instances from ut to be used as the train set ⌧t and use the remaining data to test the performance of the General Model, User-Dependent Model and the Personalized Model. To reduce sampling variability of the train set we used proportionate allocation stratified sampling. We chose p to range between 1% to 30% with increments of 1. For each p percent we performed 5 random sampling iterations for each user. Figures 1-4 show the results of averaging the accuracy of all users for each p percent of data used as train set. For D1 (Figure 1) the PM clearly outperforms the other two models when the labeled data is between 1% and 10% (the curve for PM-2 will be explained soon). The GM shows a stable accuracy since it is independent of the user. For the rest of the datasets the PM shows an overall higher accuracy except for D2 (later we will analyze why this happened).
Fig. 1: D1 - Chest sensor dataset
7
Fig. 2: D2: Wrist sensor dataset
Fig. 3: D3: WISDM dataset
Table 2: Di↵erence of average overall acTable 1: Average number of la- curacy (from 1% to 30% of labeled data) beled instances per class. between the PM and the other two models.
1% 5% 10% 15% 20% D1 D2 D3 D4
1 1 1 1
7 1 2 3
14 2 3 6
21 3 4 9
28 3 5 12
PM - GM PM - UDM D1 D2 D3 D4
22.50% 9.3% 6% 4%
5% -0.80% 22.15% 25.5%
8
Fig. 4: D4: Smartphone dataset
Table 1 shows the average number of labeled instances per class for each p percent of training data. For example for D3 we can see how just using 3 labeled instances per class the PM achieves a good classification accuracy (⇡ 0.8). Table 2 shows the di↵erence of average overall accuracy (from 1% to 30% of labeled data) between the PM and the other two models. Here we can see how the PM significantly outperforms the other two models in all datasets except in the case of D2 when comparing PM - UDM in which case the di↵erence is negligible. This may be due to the user-class sparsity of the dataset, i.e., some users just performed a small subset of the activities. This situation will introduce noise to the PM. In the extreme case when a user has just 1 type of activity it would be sufficient to always predict that activity. However, the PM is trained with the entire set of possible labels from all other users in which case the model will predict labels that are not part of that user. To confirm this, we visualized and quantified the user-class sparsity of the datasets and performed further experiments. First we computed the user-class sparsity matrices for each dataset. These matrices are generated by plotting what activities were performed by each user. A cell in the matrix is set to 1 if a user performed an activity and 0 otherwise. The sparsity index is computed as 1 minus the proportion of 1’s in the matrix. In datasets D1 and D4 all users performed all activities giving a sparsity index of 0. Figures 5-6 show the user-class sparsity matrices of datasets D2 and D3 respectively. D2 has an sparsity index of 0.54 whereas for D3 it is 0.18. For D2 this index is very high (almost half of the entries in the matrix are 0) furthermore the number of classes for this dataset is also high (12). From the matrix we can see that several users performed just a small number of activities (in some cases just 1 or 2 activities). One way to deal with this situation is to train the model excluding activities from other users that were not performed by the target
9
user. Figures 1-4 (gray dotted line PM-2) show the results of excluding types of activities that are not in ut . As expected, for datasets with low or no sparsity the results are almost the same (with small variations due to random initial k-means centroids). For D2 which has a high sparsity the accuracy significantly increased. This confirms that the user-class distribution of the dataset has an impact on the PM and that this can be alleviated by excluding the classes that are not relevant for a particular user.
Fig. 5: D2: wrist sensor dataset user-class sparsity matrix
Fig. 6: D3: WISDM dataset user-class sparsity matrix
5
Conclusions
In this work we proposed a method based on class similarities between a collection of previous users and a specific user to build Personalized Models when labeled data for this one is scarce, getting thus the benefits from a ”crowdsourcing” approach, where the community data is fit to the individual case. We
10
used the small amount of labeled data from the specific user to select meaningful instances from all other users in order to reduce noise due to inter-user diversity. We evaluated the proposed method on 4 independent human activity datasets. The results showed a significant increase in accuracy over the General and User-Dependent Models for datasets with small sparsity. In the case of datasets with high sparsity, the performance problems were alleviated in a great extent by excluding instances from other users that were not performed by the target user. Acknowledgements Enrique Garcia-Ceja would like to thank Consejo Nacional de Ciencia y Tecnolog´ıa (CONACYT) and the AAAmI research group at Tecnol´ ogico de Monterrey for the financial support in his PhD. studies.
References 1. A Brush, John Krumm, and James Scott. Activity recognition research: The good, the bad, and the future. In Proceedings of the Pervasive 2010 Workshop on How to do Good Research in Activity Recognition, Helsinki, Finland, pages 17–20, 2010. ´ 2. Francisco E. Mart´ınez-P´erez, Jose Angel Gonz´alez-Fraga, Juan C. CuevasTello, and Marcela D. Rodr´ıguez. Activity inference for ambient intelligence through handling artifacts in a healthcare environment. Sensors, 12(1):1072– 1099, 2012. 3. Yongkoo Han, Manhyung Han, Sungyoung Lee, A. M. Jehad Sarkar, and Young-Koo Lee. A framework for supervising lifestyle diseases using longterm activity monitoring. Sensors, 12(5):5363–5379, 2012. 4. Edmond Mitchell, David Monaghan, and Noel E O’Connor. Classification of sporting activities using smartphone accelerometers. Sensors, 13(4):5317– 5337, 2013. 5. Oresti Banos, Juan-Manuel Galvez, Miguel Damas, Hector Pomares, and Ignacio Rojas. Window Size Impact in Human Activity Recognition. Sensors, 14(4):6474–6499, 2014. 6. Andrea Mannini and Angelo Maria Sabatini. Machine learning methods for classifying human physical activity from on-body accelerometers. Sensors, 10(2):1154–1175, 2010. 7. Andrew I Schein, Alexandrin Popescul, Lyle H Ungar, and David M Pennock. Methods and metrics for cold-start recommendations. In Proceedings of the 25th annual international ACM SIGIR conference on Research and development in information retrieval, pages 253–260. ACM, 2002. 8. Je↵rey W. Lockhart and Gary M. Weiss. Limitations with Activity Recognition Methodology & Data Sets. In Proceedings of the 2014 ACM International Joint Conference on Pervasive and Ubiquitous Computing: Adjunct Publication, UbiComp ’14 Adjunct, pages 747–756, New York, NY, USA, 2014. ACM.
11
9. JohnPaul Varkey, Dario Pompili, and TheodoreA. Walls. Human motion recognition using a wireless sensor-based wearable system. Personal and Ubiquitous Computing, 16(7):897–910, 2012. 10. Adil Mehmood Khan, Young-Koo Lee, Sungyoung Y Lee, and Tae-Seong Kim. A triaxial accelerometer-based physical-activity recognition via augmented-signal features and a hierarchical recognizer. Information Technology in Biomedicine, IEEE Transactions on, 14(5):1166–1172, 2010. 11. Mi Zhang and Alexander A Sawchuk. A feature selection-based framework for human activity recognition using wearable multimodal sensors. In Proceedings of the 6th International Conference on Body Area Networks, pages 92–98. ICST (Institute for Computer Sciences, Social-Informatics and Telecommunications Engineering), 2011. ´ 12. Oscar D. Lara, Alfredo J. P´erez, Miguel A. Labrador, and Jos´e D. Posada. Centinela: A human activity recognition system based on acceleration and vital sign data. Pervasive and Mobile Computing, 8(5):717–729, 2012. 13. Davide Anguita, Alessandro Ghio, Luca Oneto, Xavier Parra, and Jorge L. Reyes-Ortiz. Human activity recognition on smartphones using a multiclass hardware-friendly support vector machine. In Jos´e Bravo, Ram´on Herv´as, and Marcela Rodr´ıguez, editors, Ambient Assisted Living and Home Care, volume 7657 of Lecture Notes in Computer Science, pages 216–223. Springer Berlin Heidelberg, 2012. 14. AdilMehmood Khan, Young-Koo Lee, Sungyoung Lee, and Tae-Seong Kim. Accelerometers position independent physical activity recognition system for long-term activity monitoring in the elderly. Medical & Biological Engineering & Computing, 48(12):1271–1279, 2010. 15. Enrique Garcia-Ceja, Ramon F. Brena, Jose C. Carrasco-Jimenez, and Leonardo Garrido. Long-term activity recognition from wristwatch accelerometer data. Sensors, 14(12):22500–22524, 2014. 16. Donghai Guan, Weiwei Yuan, Young-Koo Lee, A. Gavrilov, and Sungyoung Lee. Activity Recognition Based on Semi-supervised Learning. In Embedded and Real-Time Computing Systems and Applications, 2007. RTCSA 2007. 13th IEEE International Conference on, pages 469–475, August 2007. 17. Maja Stikic, Kristof Van Laerhoven, and Bernt Schiele. Exploring semisupervised and active learning for activity recognition. In Wearable Computers, 2008. ISWC 2008. 12th IEEE International Symposium on, pages 81–88. IEEE, 2008. 18. Olivier Chapelle, Bernhard Sch?lkopf, Alexander Zien, and others. Semisupervised learning. MIT press Cambridge, 2006. 19. Nicholas D. Lane, Ye Xu, Hong Lu, Shaohan Hu, Tanzeem Choudhury, Andrew T. Campbell, and Feng Zhao. Enabling Large-scale Human Activity Inference on Smartphones Using Community Similarity Networks (Csn). In Proceedings of the 13th International Conference on Ubiquitous Computing, UbiComp ’11, pages 355–364, New York, NY, USA, 2011. ACM. 20. Jussi Parviainen, Jayaprasad Bojja, Jussi Collin, Jussi Lepp¨anen, and Antti Eronen. Adaptive Activity and Environment Recognition for Mobile Phones. Sensors, 14(11):20753–20778, 2014.
12
21. Hong Lu, Denise Frauendorfer, Mashfiqui Rabbi, Marianne Schmid Mast, Gokul T. Chittaranjan, Andrew T. Campbell, Daniel Gatica-Perez, and Tanzeem Choudhury. StressSense: Detecting Stress in Unconstrained Acoustic Environments Using Smartphones. In Proceedings of the 2012 ACM Conference on Ubiquitous Computing, UbiComp ’12, pages 351–360, New York, NY, USA, 2012. ACM. 22. Z.S. Abdallah, M.M. Gaber, B. Srinivasan, and S. Krishnaswamy. StreamAR: Incremental and Active Learning with Evolving Sensory Data for Activity Recognition. In Tools with Artificial Intelligence (ICTAI), 2012 IEEE 24th International Conference on, volume 1, pages 1163–1170, November 2012. 23. Quang Viet Vo, Minh Thang Hoang, and Deokjai Choi. Personalization in mobile activity recognition system using-medoids clustering algorithm. International Journal of Distributed Sensor Networks, 2013, 2013. 24. Peter J Rousseeuw. Silhouettes: a graphical aid to the interpretation and validation of cluster analysis. Journal of computational and applied mathematics, 20:53–65, 1987. 25. Olatz Arbelaitz, Ibai Gurrutxaga, Javier Muguerza, Jes´ us M. P´erez, and I??igo Perona. An extensive comparative study of cluster validity indices. Pattern Recognition, 46(1):243 – 256, 2013. 26. Terry M Therneau and Elizabeth J Atkinson. An introduction to recursive partitioning using the rpart routines. Technical report, Technical Report 61., 1997. 27. Pierluigi Casale, Oriol Pujol, and Petia Radeva. Personalization and user verification in wearable systems using biometric walking patterns. Personal and Ubiquitous Computing, 16(5):563–580, 2012. 28. Activity recognition from single chest-mounted accelerometer data set. https://archive.ics.uci.edu/ml/datasets/Activity+Recognition+from +Single+Chest-Mounted+Accelerometer, 2012. Accessed: February 18 2015. 29. B. Bruno, F. Mastrogiovanni, and A. Sgorbissa. A public domain dataset for adl recognition using wrist-placed accelerometers. In Robot and Human Interactive Communication, 2014 RO-MAN: The 23rd IEEE International Symposium on, pages 738–743, Aug 2014. 30. Dataset for adl recognition with wrist-worn accelerometer data set. https://archive.ics.uci.edu/ml/datasets/Dataset+for+ADL+Recognition+ with+Wrist-worn+Accelerometer, 2014. Accessed: February 18 2015. 31. Jennifer R. Kwapisz, Gary M. Weiss, and Samuel A. Moore. Activity recognition using cell phone accelerometers. SIGKDD Explor. Newsl., 12(2):74–82, March 2011. 32. Activity prediction dataset. http://www.cis.fordham.edu/wisdm/dataset.php, 2012. Accessed: February 18 2015. 33. Human activity recognition using smartphones data set. http://archive.ics.uci.edu/ml/datasets/Human+Activity+Recognition+ Using+Smartphones, 2012. Accessed: February 18 2015.