Mobile Information Systems 9 (2013) 99–122 DOI 10.3233/MIS-130155 IOS Press
99
Personalized behavior pattern recognition and unusual event detection for mobile users Junho Ahn∗ and Richard Han Department of Computer Science, University of Colorado, Boulder, CO, USA Abstract. Mobile phones have become widely used for obtaining help in emergencies, such as accidents, crimes, or health emergencies. The smartphone is an essential device that can record emergency situations, which can be used for clues or evidence, or as an alert system in such situations. In this paper, we focus on mobile-based identification of potentially unusual, or abnormal events, occurring in a mobile user’s daily behavior patterns. For purposes of this research, we have classified events as “unusual” for a mobile user when an event is an infrequently occurring one from the user’s normal behavior patterns – all of which are collected and recorded on a user’s mobile phone. We build a general unusual event classification model to be automated on the smartphone for use by any mobile phone users. To classify both normal and unusual events, we analyzed the activity, location, and audio sensor data collected from 20 mobile phone users to identify these users’ personalized normal daily behavior patterns and any unusual events occurring in their daily activity. We used binary fusion classification algorithms on the subjects’ recorded experimental data and ultimately identified the most accurately performing fusion algorithm for unusual event detection. Keywords: Unusual event, mobile, pattern, classification, fusion, personal
1. Introduction According to statistics [19] from a 1999 national survey reported on the Keep Schools Safe website, more than one in three high school students had been in a physical fight within the previous year. In the midst of such situations, students involved in physical fights may be seriously wounded and hurt, without being able to get help. People who find themselves in dangerous or emergency situations–such as victims of crimes, health emergency situations or accidents, such as a car accident, will usually attempt to call 911 using their smartphone to get help in these situations. The NENA (National Emergency Number Association) [26] has estimated that there are 240 million emergency calls made to 911 in the U.S. every year and 70 percent of these calls reported by the FCC (Federal Communications Commission) [11] were placed from smartphones. The smartphone is thus an essential device that can help people be rescued quickly in emergency situations. However, in an emergency situation, people are often too injured, or incapable, of calling 911 or a relative to get help. For example, they might be involved in a fight, violent attack, health emergency, or trapped in a vehicle or structure. In these cases, people will often yell, cry, or scream out loud to obtain help [2]. If people in the vicinity hear these unusual human voice sounds, or cries for help, they can seek ∗ Corresponding author: Junho Ahn, Department of Computer Science, University of Colorado, Boulder, CO 80309, USA. Tel.: +1 303 492 0914; Fax: +1 303 492 2844; E-mail:
[email protected].
c 2013 – IOS Press and the authors. All rights reserved 1574-017X/13/$27.50
100
J. Ahn and R. Han / Personalized behavior pattern recognition and unusual event detection for mobile users
Collection of mobile sensor data
Behavior classification
Pattern recognition
Location Sensor
Visited location
Frequent, Infrequent, New location
Activity Sensor
Stationary, Walking, Running
Activity pattern
Audio Sensor
Low level noise, Talking, Music, Emotional voice
Fusion Algorithm
Fusion
Unusual event detection model
Unusual event detected or not
Audio pattern
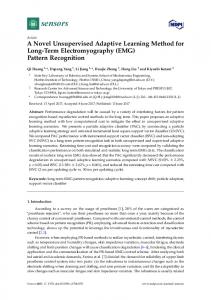
Fig. 1. Process for building an unusual event detection model using mobile sensor data.
help for the victims by calling 911 for them. However, if nobody can come to the victims’ rescue or call 911 for them, they may be seriously wounded or continuously victimized or endangered and never receive help. The existing unusual sound detection algorithms [27,29] have been shown to detect human voice sounds of screaming or yelling, but only within laboratory settings. These algorithms primarily focus on simple loud sound detection in controlled environments, where there is no background noise. In real-life environments, however, background noise sounds, such as traffic, music or movie/television sounds, are sometimes very similar to unusual danger-alerting human voice sounds–such as the screaming or yelling of a person involved in an actual emergency situation. First attempts to use these algorithms in such reallife settings, often incorrectly detected an unusual danger-alerting human voice sound, when there was none. In this paper, we develop an unusual event classification model for real world mobile users, that is automated on the smartphone, and analyze various binary fusion classification algorithms to find the best one for use with our system. To classify normal and abnormal events, we analyzed the activity, location, and audio sensor data collected from 20 mobile phone users to identify these users’ personalized regular daily behavior patterns and any unusual events occurring in their daily behavior patterns. We define “unusual/abnormal events” to be infrequently generated behaviors of mobile phone users, such as extreme increased or decreased activity, infrequently visited locations, or unusual audio identified. For example, the majority of the 20 subjects in our experiment confirmed that the places they visited less than 2% of their one week’s time period were places visited that constituted “unusual events” in their normal weekly schedule. Figure 1 shows the process used to identify unusual events, using mobile sensor data (location, activity, and audio data). We built behavior classifiers to identify each mobile user’s daily activity patterns (e.g., walking, stationary, running), audio patterns (e.g., low level sound, music, talking, loud emotional voice), and location data that was collected from the mobile sensors of the 20 mobile users. We analyzed the behavior data collected using the normal distribution algorithm to identify the users’ normal daily patterns and any unusual events occurring in their daily activity. We built our unusual event classification model using the most accurately performing classification algorithm identified from among four popular binary fusion classification algorithms that we tested with our data. Our general event classification model can be used to automatically determine mobile users’ unusual events, without
J. Ahn and R. Han / Personalized behavior pattern recognition and unusual event detection for mobile users
101
requiring manual user feedback. For instance with our system, for a mobile user living alone, the audio data automatically recorded would normally show as low level background noise, but if loud emotional voice sounds, like screaming or loud crying, were suddenly recorded on the mobile phone, this would automatically be identified as an unusual event. In the Section 2, we begin by describing related works in this field. Section 3 then, describes how we surveyed the 20 mobile phone users participating in our experiment, and then in Section 4 we provide a description of the individual and fusion classifiers we used for detecting the users’ daily behavior patterns. The fusion classification algorithms are explained in Section 5. Lastly in Section 6, we evaluate the performance of four different binary fusion classification algorithms to find the best one to use in building our model. The final Section 7 is the conclusion. 2. Related work There are mobile-based applications, or systems [4,7,8,13,15,16,18,20,21,25,28,30] which are able to predict users’ behaviors using mobile phone sensors. These applications use adaptive algorithms that save the mobile’s battery power and are sometimes used to infer or predict mobile users’ future behavior or behavior patterns. The mobile users’ behaviors (activity, movement, location, audio pattern, etc.) are measured by the mobile’s sensors (accelerometer, GPS, Wi-Fi, audio, etc.). The accelerometer sensor on the mobile phone can be used for identifying users’ activity and movement patterns. The GPS and Wi-Fi sensors are used for locating users in outdoor or indoor areas. The audio sensor is used for classifying sounds in a user’s immediate environment (e.g., talking, music, background noise, etc.) to help identify a user’s location or behavior. Each sensor’s functionality in these applications is used to build optimal or efficient algorithms that can predict mobile user’s behavior or save battery power on the mobile phone. For our research presented here, we have further investigated how to design and implement a similar mobile-based application in which multi-sensor data can be used to identify when unusual events occur in a mobile user’s daily behavior patterns. We classified audio data using existing audio classification algorithms that can measure combined audio patterns (i.e., low level noise, talking voice, music, and loud emotional sounds). Some sound detection applications [25,27–29] are capable of classifying sounds into general sound types, such as a gunshot, a screaming voice sound, speaking voice sounds, etc. The popular algorithms used in these applications to classify audio data are the MFCC(Mel-Frequency Cepstral Coefficients) [1,24] and GMM (Gaussian Mixture Models) [14] algorithms. Our system also used the MFCC algorithm to extract sound features and the GMM algorithm to find matches in the mobile users’ data to the trained features–for identify the mobile users’ audio patterns. We describe in detail in this paper how we have used these algorithms in our system. In addition to individual classifiers used to identify user patterns for location, activity and audio data, collected from users mobile phones, we also looked at other research that addresses pattern recognition combining individual classifiers. We reviewed the research that has been done in this area, and found a number of papers that make use of pattern recognition algorithms to predict human behavior. Some research [5,6,22] develops association rules to analyze human behavior data to determine human activity patterns. Individual human activity data collected is associated with other individual human activity data to determine if there is a high correlation between the data measured. From these correlations a pattern recognition algorithm to predict human activity behavior is built. Additionally, David Taniar et al. [5] has found that negative and positive association rules among data can be used for essential decision making to determine unusual versus usual (expected) human activities or events. In our research, we found that
102
J. Ahn and R. Han / Personalized behavior pattern recognition and unusual event detection for mobile users
using association rules to predict unusual versus usual events was sometimes useful, but not always. Therefore, we sought to find other algorithms that would be more suitable for handling our analysis of combined audio, location and activity data for predicting unusual and usual events. We investigated tree-based binary fusion classification algorithms that could be used to identify when mobile users encounter an unusual situation or are involved in an unusual event (different from their daily patterns). We compared four popular fusion classification algorithms: Bagging [23], Adaboost [31], SVM(Support Vector Machine) [3], and CI (Confidence Interval) to find the best fusion algorithm for use in our system. Bagging is a bootstrap aggregating algorithm that uses a machine learning ensemble method to build an improved classification model, using average predictions or majority voting from multiple models. The Adaboost algorithm is another algorithm that uses the ensemble method to build a strong classification model with weak classifiers to improve the performance accuracy. SVM is a supervised learning algorithm, which is used to build an optimal linear classification model. CI is an algorithmic method, used to determine the optimal interval range in which the probability of a given hypothesis can be said to be true or not. We built a classification model according to each of these tree-based binary fusion algorithms and compared them to find the best fusion algorithm to use in our system. The existing unusual event detection applications [9,10] provides family members’ current location or historical location to detect unusual location events. Family Locator Monitor [10] and Family Locator PRO [9] applications are able to share users’ locations among family members using the GPS on the mobile phone. However, they require family members who use this application to monitor another member, and to manually check that member’s location frequently. These mobile applications also only use one dimension of the mobile’s sensor data. 3. Data collection from subjects The goal of this data collection was to design a more efficient and practical unusual sound detection algorithm that could be used in a real-life environment and to determine which other sensors could best be used in conjunction with the audio sensor to build our adaptive algorithm. We collected mobile phone sensor data from 20 subjects. The sensor data for each subject was collected automatically on the mobile phone from its sensors, as each user carried the phone for one week during the data collection period. We collected the data to see what the mobile’s sensor readings would look like, and to determine how best to save mobile battery power, while increasing the accuracy of unusual sound detection. For the data collection from the 20 different subjects, we used four mobile phones: two HTC Nexus Ones and two HTC Inspires, with our application installed on them, that we lent to the participants to carry with them for one week. We paid $10 for participation in this study and required the subjects to carry the phone with them at all times in their pocket or purse, keeping it in the same place as their mobile phone, during the data collection period. During the time when subjects were carrying the phone, sensors installed on the mobile phone were also periodically recording external sounds and the users’ activity and locations. The data was collected and stored on the phone during the time they were actively participating in the study, carrying the phone. This research is approved by Institutional Review Board (IRB) [17]. We focused on detecting subjects’ locations and activities using the mobile phone during a normal week in their daily life. We collected the user’s location, using GPS and WiFi on the phone, and also recorded the user’s daily activities and behaviors, by using the phone’s sensors: accelerometer, orientation, proximity, audio, and light sensor as shown in Fig. 2. We tried to run the mobile sensors at all times
J. Ahn and R. Han / Personalized behavior pattern recognition and unusual event detection for mobile users
(a)
103
(b)
Accelerometer
Proximity Orientation GPS Wi-Fi Audio
Fig. 2. Phone survey: Displaying sensor data.
and save the data in the mobile database to detect users’ behavior in detail. However, the sensors were power hungry and the storage space is limited on the mobile phone, so we adjusted their time length of use. The program measured the average type of accelerometer-based activity (e.g., walking, jumping, shaking phone, etc.) every three seconds and obtained and recorded subjects’ locations using GPS and WiFi every 3 minutes. We also recorded all audio sounds in the user’s immediate area on the mobile phone for 15 seconds, every 5 minutes, and stored the orientation, proximity, and light sensor data along with these recorded sounds, to determine the user’s behavior related to the audio sounds. The battery power of the mobile phone, when running this entire application, lasted for about 12 hours. This time was enough to measure the user’s daily behavior patterns and activities, because the users were normally back at home in the evenings and able to recharge the phone at the end of each day.
4. User behavior classifiers We begin by developing individual classifiers to identify user behaviors in each of the three sensing dimensions of audio, activity, and location. In the next section we investigate four different algorithms to determine the best algorithm for classifying unusual behavior events, using these three sensing dimensions. 4.1. Daily location-based unusual events The location data is adaptively stored on the phone whenever the user moves from one location to another, and this information is used to build a historical location-based map. The historical map is then used to estimate whether or not the mobile user is in a new location, a place never visited before, in a habitually visited place, or in an infrequently visited place. AvgPercentage (rank) = Avg(TotalTime(location(userx )) /TotalTime(all locations(userx )), rank)
(1)
104
J. Ahn and R. Han / Personalized behavior pattern recognition and unusual event detection for mobile users
3%
1% 1% 2% 1%
0% Location 1 Location 2
5%
Location 3
8%
Location 4
Location 5 Location 6
14%
Location 7
65%
Location 8 Location 9 Location 10
Fig. 3. Location history collected from 20 subjects.
We analyzed location data collected individually from each of the 20 subjects, using GPS or Wi-Fi sensors, to determine the average proportion of total time each subject visited and stayed within each different location within a one week period as shown in in Eq. (2). We individually measured a percentage of staying time in each of 10 locations for each of the 20 users, and ranked them in descending order of length of staying time in each location. We calculated the average percentage of staying time for each location in the same ranked position, 1 through 10, across all 20 subjects. We investigated the various locations the survey subjects visited within a one-week period in order to log a record of locations users visited. We defined “visited locations” to be any place in which the mobile users stayed within a 100 meter radius for more than 30 minutes. The most infrequently visited places, which were usually visited for the shortest amount of time – either brand new locations or rarely visited locations – were likely to be unusual events in the subjects’ lives. Figure 3 shows the average percentage of staying, or visiting, time subjects spent in each of 10 different locations. We found that the subjects spent 92% of their one week’s time period in four main repeatedly visited places. The 20 subjects spent two thirds (65%) of their total week’s time in the first ranked location, 14% of their time in a second ranked location, and 8% and 5%, respectively in the third and fourth ranked top locations visited. To determine the percentage cutoff for what constituted an unusual event in the subjects lives, we hypothesized that 2% was a reasonable, general threshold for identifying an unusual event for a subject (i.e., a place very infrequently visited or a brand new location visited in a one week period). Then we queried each of the subjects about their assessment of these identified least frequently visited locations, to determine the ground truth about the locations that were visited for less than 2% of the time. We defined an infrequently visited location for purposes of our analysis, and for querying the subjects, as a place that was visited less than once a week for a short period of time or a place the subjects had never visited before. The majority of the 20 subjects confirmed that the places they visited less than 2% of the time, as shown in the graph, were actual places visited that constituted “unusual events” in their normal week schedule. 4.2. Audio classifiers We sought to develop audio classifiers that could identify common, every-day sounds encountered by users of mobile phones. We classified four types of sounds (low level noise, normal speaking voice,
J. Ahn and R. Han / Personalized behavior pattern recognition and unusual event detection for mobile users
105
music, loud emotional voice (yelling, crying, screaming and loud angry voice sounds)) to detect and analyze mobile users’ audio patterns generated or encountered in their daily lives. We used the audio data collected from a mobile phone and paper survey of 20 subjects, described in the above section. We classified the four types of sounds using existing audio classification algorithms. Sound detection algorithms [25,27–29] are capable of classifying sounds into general sound types, such as a gunshot, a screaming voice sound, speaking voice sounds, etc. These algorithms cannot detect specific meanings of certain sounds in human speech, but they can detect and classify low level noise sounds such as explosions, gunshots, screaming, and the human speaking voice. Recently, some of the algorithms have been implemented on the mobile phone [25,28]. These algorithms have been shown to successfully identify unusual human voice sounds, but have only primarily been tested and implemented in laboratory-type settings. Our proposed model uses a combination of existing algorithms to develop a practical real-life situation application. Our proposed audio-detection algorithm is designed to be more robust and to apply to outdoor as well as indoor settings – including the ability to identify mixed low level noise sounds that include such sounds as building construction noise, traffic noise, car horn sounds, etc. We decided on four main classifications for our sound detection algorithm: low level noise, normal talking speech, music–anything from rock to classical, and loud emotional voice sounds. We used two algorithms, the MFCC(Mel-Frequency Cepstral Coefficients) [1,24] and GMM (Gaussian Mixture Models) [14]. The sound features extracted with the MFCC algorithm are compared with the existing models of sound classifications based on the GMM algorithm, and if a match is found, one of the four classification types is identified. The MFCC and the GMM algorithms were implemented to run on each recorded audio file with a 22050 sampling rate and stereo sound on the Android-based mobile phone. Every half second, the GMM algorithm collected 12 data points of sound, using a 22050 sampling rate, and analyzed the 12 data points to classify the sound as one of the four types. Each data point consisted of 13 frequencies extracted by the MFCC algorithm. We used the GMM algorithm to build the audio training models, using the audio data collected from our 20 survey subjects as well as music audio and Youtube audio data collected on the internet. To create the low level noise and talking voice models, we used the recorded sounds collected from the 20 phone survey subjects and trained the models using the GMM algorithm with three probability states. We used 50 low level noise sound samples, collected from each of the 20 mobile users phones, recorded in different places such as home, school, sidewalks, markets, restaurants, etc. We also used 50 talking voice sound samples, collected from the 20 survey subjects during periods when they were conversing with friends, family, etc. For training the music model, we used 60 music sound samples that were created by combining 10 samples from the recorded music sounds of the survey subjects and 50 music audio samples downloaded from websites. It was necessary to supplement the subjects’ phone survey data with web data, because the number of recorded background music sounds from the survey subjects was not large enough to use for classifying a variety of music types for the music model. The total combined phone and web music samples consisted of rock, rap, popular and classical music. For the loud emotional voice model, we collected samples of audio data from 50 Youtube videos of people involved in actual accidents, fighting scenarios, etc., who were screaming, crying, or shouting loudly. We used the GMM algorithm to train these audio recordings to create the loud emotional voice model. Figure 4 shows the frequencies extracted by the MFCC algorithm (Mel-Frequency Cepstral Coefficients) [1,24] from sounds collected during our experiment: low level noise, talking voice, music sound, and loud (angry) emotional voice. The MFCC algorithm provides fine details on the frequency bands that are used to define sound features extracted from the sounds. The figure illustrates that these four
106
J. Ahn and R. Han / Personalized behavior pattern recognition and unusual event detection for mobile users 15 10
15
(a)
sound 01
10
sound 02
(b)
sound 02
sound 04
sound 05
0
sound 06
1 2 3 4 5 6 7 8 9 10 11 12 13 -5
sound 07 sound 08
sound 03
Frequency
Frequency
sound 03
5
5
sound 04
sound 05
0
sound 06
1 2 3 4 5 6 7 8 9 10 11 12 13 -5
sound 09
-10
sound 10
sound 10
sound 11
-15
Background Noise Frequency Pattern
sound 11
-15
sound 12
15
10
Talking Voice Frequency Pattern
(c)
sound 01
10
sound 02
5
sound 04
(d)
sound 05
0
sound 06
1 2 3 4 5 6 7 8 9 10 11 12 13
sound 07 sound 08
-5
sound 02
5
sound 04 sound 05
0
sound 06
1 2 3 4 5 6 7 8 9 10 11 12 13
-10
sound 09 sound 10
-10
sound 11 sound 12
Background Music Frequency Pattern
sound 07 sound 08
-5
sound 09 sound 10
sound 01
sound 03
Frequency
Frequency
sound 12
15
sound 03
-15
sound 07 sound 08
sound 09
-10
sound 01
sound 11
-15
sound 12
Angry Voice Frequency Pattern
Fig. 4. Sound patterns detected by the MFCC algorithm (a) for low level noise, (b) talking voice, (c) music sound, (d) and angry sound pattern frequencies.
sounds have their own unique frequencies. These unique frequencies can be used to detect the mobile users’ self-generated or environmental sound patterns (their own or others’ speaking or angry voice, music, low level noise, etc.). Initially, we tried to identify and define loud emotional voice sounds as unusual events encountered in the mobile phone user’s life. The emotional voice sounds, expressed by people involved in unusual situations – such as yelling, crying, screaming and loud angry voice sounds [2] can be used as an unusual event indicator. People frequently vocalize such sounds when they are involved in accidents or crime situations, either as victims or perpetrators. We watched 50 Youtube videos related to actual dangerous situations that included fighting, car accidents, angry threatening situations, etc. The people in these videos were using vocal sounds and words that involved yelling or screaming at each other, loud crying, or loud angry voices – shouting at each other. If the audio-detection algorithm on the mobile phone could be designed to correctly classify these loud emotional voice sounds as distinct from other sounds (such as speaking voice, low level noise), then we could identify uncommon, sometimes dangerous situations encountered by mobile phone users. However, although the GMM algorithm classified each recorded sound into four classifications, the algorithm did not always correctly classify all of the sounds in our experiments. For example, the first experiment of Table 1 shows results of the classification algorithm obtained from sounds recorded in a
J. Ahn and R. Han / Personalized behavior pattern recognition and unusual event detection for mobile users
Audio Percentage (%)
Visiting 1st 2nd 3rd 4th
107
Table 1 Audio classifier’s mixed sound results Loud voice Normal voice Music Low level noise 4.34% 23.47% 6.95% 65.21% 2.38% 17.85% 14.28% 65.47% 3.12% 7.81% 20.31% 68.75% 1.51% 7.57% 15.15% 75.75%
120 100 80 Quiet
60
Talking
40
Music
20
Loud
0 1
2
3
4
5
6
7
8
9
10
Visiting Sequence of one subject at same location Fig. 5. An example showing a similar percentage pattern of the four audio classifications for one subject’s repeated visits in one location.
food court –“mixed sounds”– measured while the researcher walked around the food court area. This recording of mixed sounds from the food court included loud emotional voice sounds 4.34 percent of the time, voice sounds 23.47 percent, music 6.95 percent, and low level noise 65.21 percent of the time. However, in actuality there were only talking voice sounds and low level noise being generated in this environment. The 6.95 percent of music sounds and the 4.34% of loud voice sounds were incorrectly identified by the algorithm, likely because of some of the high-pitched, loud kitchen equipment sounds encountered in this food court. None of these high pitch sounds identified as loud emotional voice sounds were actual human voice sounds. To overcome the limitation of this audio classification algorithm, we used pattern recognition to improve our classification model. We repeated the measurements of the noise in this same food court multiple times and found that a similar percentage of mix of sounds occurred across all of the experiments Table 1. We also analyzed the percentage pattern of the four audio classifications for each of the 20 phone survey subjects when they repeatedly visited the same place. Figure 5 shows the results of one subject’s recorded audio sounds when repeatedly visiting the same location. For each of the 10 times that the subject visited the same place, the mixed percentage of quiet, talking, music, and loud emotional sounds was very similar. We also analyzed audio data collected from 20 survey subjects who frequented one location repeatedly to see how much the percentage of audio sound classifications would vary across all visits. Figure 6(a) shows, in two charts, the standard deviations for the four audio classifications measured for each of the 20 subjects’ audio data collected, calculated as shown in Fig. 6(b), when they frequented two different locations. When the subjects frequented the first place (chart 1), the standard deviations across each of the four audio types were quite small for all of the 20 subjects, less than 10 standard deviation points for any one audio type, based on a maximum of 100 points for the combined four audio classifications. Additionally, when the 20 subjects frequented the second place (chart 2), a similar small standard deviation, less than 12 points, and a similar stable pattern mix of the four audio types was found across each of their visits. Also in comparing the two charts, the standard
108
12
10
10
8
Quiet
6
Talking
4
Music
2
Deviation
12
1
4
Quiet
6
Music Loud
0
7 10 13 16 19
2nd Visit
Talking
4
2
Loud
0
1st Visit
8
… … … …
Deviation
J. Ahn and R. Han / Personalized behavior pattern recognition and unusual event detection for mobile users
1 4 7 10 13 16 19
Subjects Location 1
Subjects Location 2 (a)
n Visit
σ1 , σ2 , σ3 , σ4 Standard Deviation (b)
Fig. 6. (a) Standard deviations of four audio classifications measured for 20 subjects’ in two different locations: 1 and 2, (b) An example for measuring standard deviations for each audio type over 10 visits for one subject.
deviation pattern mix of audio classifications within subjects varied for each subject according to the locations visited. On average across all subjects, it appears that in location 2, there were more talking audio classifications than in location 1. This could indicate that location 2 was their workplace for most subjects and location 1 was their home. By investigating the above mixed percentage patterns of audio classifications, we found that when the mobile survey subjects repeatedly visited the same place, the percentage pattern mix of audio types across all subjects were very similar. To determine how similar these patterns were, we used the Gaussian (Normal) distribution to find the probability of how close each subject’s audio type was to the normal audio classification probability. For this approach we assume that mixed percentage patterns of audio classifications follow the normal distribution. In the section 6 we discuss how we analyzed these recorded audio data and patterns of the subjects to determine which audio type within these personalized patterns constituted an unusual event. 4.3. Activity classifier People’s daily activity can also be used to predict the occurrence of an unusual event or situation. Research related to human defensive behavior [2] provides information about how people act when they are in a threatening situation. Human beings, when threatened, usually do one of the following: attack, run, or freeze. These behaviors involve high impact activities or long stationary activity. Such dramatic, abrupt, and high impact activity can be measured easily by the mobile phone’s sensors – the GPS, Wi-Fi, and accelerometer sensors. We used these sensors on the mobile phone to survey a wide range of user activities: from normal, every-day activities to uncommon, unusual events or activities. We measured the user’s activities using the acceleromter. The acceleromter consists of sub-sensors of three-axes: x-axis, y-axis, and z-axis. The impact strength is calculated by measuring the amplitude between the positive peak point and the negative peak point on an accelerometer. We calculated the average impact of the user’s activities from the data from the three axes, regardless of the orientation of the phone, by using the following Eq. (3). Strength(t) = Avg(Length(HighPeak ,LowPeakx ,t) , x Length(HighPeak ,LowPeaky ,t) , y
Length(HighPeak ,LowPeakz ,t) ) z
(2)
J. Ahn and R. Han / Personalized behavior pattern recognition and unusual event detection for mobile users
109
25
Activity
20 15 10 5 0
Getting Fighting hit by with someone someone
Being pushed
Falling
Normal Walking
Fig. 7. Unusual high impact activities measured on the mobile phone. 30
Activity
25
20 15 10
5 0 Lying down Sitting down Bike Shaking Turning Normal on bed quickly breaking phone phone walking Jumping Car Running Dancing Pressing Dropping breaking screen phone
Fig. 8. High impact-based normal activity detected from the mobile phone survey subjects’ data.
In order to detect an individual’s activity, we first calculate the individual’s average normal walking impact using the acceleromter (shown above) on the mobile phone. We measured the average of the mobile phone user’s daily movement activities, using the GPS sensor when the user was walking in outdoor areas. The above Eq. (3), running on the mobile phone, calculated various walking impact activities over time and stored the average impact of the user’s daily walking impact activities. Initially, we tried to identify and classify an event as an unusual event for the user whenever the mobile phone detected a high impact activity with the phone’s accelerometer sensor. To then identify what some types of high impact activities might look like when recorded by the accelerometer, we artificially generated unusual types of activities with two people acting them out. Figure 7 shows the varying amplitudes recorded by the phone’s accelerometer for the events of hitting, fighting, pushing and falling, as compared to the accelerometer reading of a person’s normal walking. The amplitude measurements for all of these activities are higher than that of normal walking activity. However, this simple approach was not always suitable for detecting and classifying unusual events. Figure 8 shows data collected from the 20 subjects of the mobile phone survey, in which the accelerometer measured various normal human activities – i.e., jumping, lying down on a bed, running, sitting down quickly, pressing a car brake pedal, pressing a bike’s hand brake, dancing, walking, shaking the phone, dropping the phone, turning the phone over, and strongly pressing the phone’s screen. We compared
J. Ahn and R. Han / Personalized behavior pattern recognition and unusual event detection for mobile users
Activity Percentage (%)
110
100 80 60 Stationary
40
Walking
20
Running
0 1
2
3
4
5
6
7
8
9 10 11 12
Visiting Sequence of one subject at same location
12
10
10
8
6
Stationary
4
Walking
2
Running
0
Deviation
12
1st Visit
8
6
Stationary
4
Walking
2
Running n Visit
0
1 4 7 10 13 16 19
1 4 7 10 13 16 19
Subjects Location 1
Subjects Location 2
(a)
2nd Visit
… … …
Deviation
Fig. 9. An example showing a similar percentage pattern for three types of normal impact activity for one subject’s repeated visits in one location.
σ1 , σ2 , σ3 Standard Deviation (b)
Fig. 10. (a) Standard deviations of three impact activities measured for 20 subjects’ in two different locations: 1 and 2; (b) An example for measuring standard deviations for each impact activity over 12 visits for one subject.
the accelerometer’s amplitude measurements for each of these activities to the amplitude of a person’s normal walking activity. In reviewing the results from both these investigations, illustrated in the two figures, we found that this simple approach for measuring and identifying a high impact activity as an unusual event often yielded many false positives. Many normal activities generated impact amplitude measurements higher than the average normal walking activity measurement. To overcome the limitation of the impact activity classification algorithm, we also used pattern recognition to help identify and classify unusual events. By further analyzing the collected activity data from 20 people, we found that the percentage breakdown of types of mobile users’ impact activities (stationary, walking, running) were often the same and often repeated in the same general areas. We also analyzed the percentage pattern mix of the three most frequently observed normal impact activities when each phone survey subject repeatedly visited the same location. Figure 9 shows an example of when one subject frequented the same place 12 times. For each time the subject visited this one location, the percentage mix of stationary, walking and running across these 12 times was similar. In addition, we also analyzed this same normal activity data for all 20 survey subjects when they frequented two different locations. Figure 10(a) shows, in two charts, the standard deviations for the three impact
J. Ahn and R. Han / Personalized behavior pattern recognition and unusual event detection for mobile users
111
activities measured for each of the 20 subjects, calculated as shown in Fig. 10(b), when they frequented two different locations. When the subjects frequented the first place (chart 1), the standard deviations across each of the three impact activities were quite small for all of the 20 subjects, less than 5 standard deviation points for any one impact activity type, based on a maximum of 100 points for the combined three types. Additionally, when the 20 subjects frequented the second place (chart 2), a similar small standard deviation of less than 10 points was observed. Also in comparing the two charts, the standard deviation pattern mix of the three activity classifications within subjects varied for each subject according to the locations visited. On average across all subjects, it appears that in location 2, there were more movement activity classifications (i.e., running and walking) than in location 1. This might also indicate that location 2 was their workplace for most subjects and location 1 was their home. By investigating the above mixed percentage patterns of activity types, we found that when the mobile survey subjects repeatedly visited the same place, the percentage pattern mix of activity types across all subjects were very similar. To determine how similar these patterns were, we used the Gaussian (Normal) distribution to find the probability of how close each subject’s activity type was to the normal activity probability. For this approach we assume that mixed percentage patterns of activity types follow the normal distribution. In the next section we discuss how we analyzed these recorded activities and patterns of the subjects to determine which activity within these personalized patterns constituted an unusual event.
5. Fusion algorithms Thus far, we have described how we use the mobile sensors – the accelerometer, GPS, and the audio sensor, to detect the mobile users’ daily patterns. We investigate binary classification algorithms to find the best one that can be used to identify unusual events occurring within the seven different patterns of audio and activity data collected from the subjects. We evaluated four different fusion algorithms and compared their accuracy for unusual event detection among the mobile users’ daily activity, audio, and location data we had collected on the mobile sensors (accelerometer, audio, GPS, and Wi-Fi sensors). We limited our algorithmic evaluation to investigating only that data which the location sensor data indicated included repeatedly visited locations of the mobile users. The users’ audio data we analyzed with these algorithms was comprised of four audio patterns: low level noise, talking voice, music, and loud emotional voice. The accelerometer data was comprised of three different impact patterns: stationary, walking, and running. These seven patterns were evaluated with the algorithms to determine whether a mobile user might be experiencing an unusual event – i.e., demonstrating unusual behavior or involved in an unusual situation. We investigated these classification algorithms to find the best one to use in our system for determining unusual behavior events when analyzing these seven patterns. We evaluated four popular fusion classification algorithms: Bagging [23], Adaboost [31], SVM(Support Vector Machine) [3], and CI (Confidence Interval). – Bagging: Bagging is a bootstrap aggregating algorithm that uses a machine learning ensemble method that creates classifications for its ensemble by training each classifier individually (e.g., audio-talking voice, accelerometer-walking impact, etc.) with a random redistribution of the training set to improve machine learning of the statistical classification. It creates different models obtained from bootstrap samples of training data. The bagging algorithm builds an improved classification model by using average predictions and majority voting from multiple models.
112
J. Ahn and R. Han / Personalized behavior pattern recognition and unusual event detection for mobile users Table 2 Audio classifier’s test sample results and classifications Sounds (%) Loud Voice Normal Voice Music Low level
Loud voice 65.84 1.88 5.66 0.00
Normal voice 27.55 90.42 37.59 3.19
Music 4.59 3.93 50.08 0.00
Low level 2.03 3.77 6.68 96.81
– Adaboost: Adaboost is a boosting algorithm that uses a machine learning ensemble method that is used to improve the performance of individual weak classifiers (e.g., audio-talking voice, accelerometer-walking impact, etc.). It is a widely used boosting algorithm that weights a set of weak classifiers according to a function of the classification error. Each weak classifier will have a different performance accuracy and the Adaboost algorithm weights each of these classifiers accordingly to achieve a stronger classification. It constructs a stronger classifier as a linear combination of the weaker classifiers h(x) as shown in Eq. (3). T X αt ∗ ht (x) (3) f (x) = t=1
In the equation above, AdaBoost generates a new classifier for each of a series of rounds t = 1, 2, . . . , T. A distribution α of weights is updated in the data set for the new classification. On each round, the algorithm applies weights according to each of the individual weak classifiers and creates a stronger classification. – SVM (Support Vector Machine): SVM (support vector machines) is another supervised learning algorithm, that uses associated classification and regression. SVM is a binary classification algorithm [3] which is a margin classifier. Given data in multidimensional feature space (i.e., the seven different patterns of audio and accelerometer classifiers), it draws an optimal linear hyper-plane that defines a boundary line as a proposed threshold to classify normal versus unusual event data. The algorithm finds a maximum margin within which the hyper-plane is optimal. – CI (Confidence Interval): The confidence interval method uses a normal distribution to determine a given probability that data evaluated is either above or below a specific threshold. It is used to indicate the reliability of an estimate, such as whether the data falls above the normal expected result (e.g., above a 95% confidence interval, etc.). The CI is a range of values, above and below a hypothesized finding. The method can be used as a binary classification algorithm whether or not an input value is in the range. We compared the performances of these four binary fusion classification algorithms to find the best fusion algorithm to use in evaluating our training data and testing data. Figure 11 shows a classification design using the four binary fusion algorithms. We used a period of four days of training audio and activity data collected from the 20 phone survey subjects to build each algorithm’s unusual event classification model. We analyzed the performance of each algorithm’s classification model using the remaining three days of data collected from the survey subjects as the testing data. Comparing four algorithms performance accuracy, we then found the best algorithm of the four to use as the optimal classification model for our system. We describe the results in the Section . 6. Evaluation We evaluate the audio classifier to show our audio training performance first before analyzing the fusion algorithm.
J. Ahn and R. Han / Personalized behavior pattern recognition and unusual event detection for mobile users
Training data
Training data
113
Training data
Training data
Adaboost Bagging SVM
20 subjects
CI
Testing data
Testing data
Testing data
Testing data
Prediction
Prediction
Prediction
Prediction
Fig. 11. Classification design using the four binary algorithms.
6.1. Results of the audio classifiers We begin by considering the effectiveness of our audio classification subsystem. As described earlier, we used training data to develop the GMM models for low level noise, talking voice, music, and loud emotional voice. These four models of sound patterns were developed using the collected frequencies from the MFCC algorithm, which were then classified by the GMM algorithm. We then used 40 test sound samples that are separate from our training data for analyzing each of the four classification groups. Each sound sample lasted from 30 sec to 1 min and was segmented into half-second snippets. We measured the accuracy of our model that includes the four sound pattern classifications: low level noise, talking voice, music, and loud emotional voice sound patterns. Table 2 shows the accuracy of our model for classifying unusual voice sound, talking voice, music, and background sound patterns. The accuracy of loud emotional voice sound pattern detection was 65.84 percent, with the error in detection consisting of 27.55 percent talking voice, 4.59 percent music, and 2.03 percent background sound patterns. The accuracy of normal voice sound pattern detection was 90.42 percent and the algorithm only incorrectly detected other sound patterns 9.58 percent of the time. The accuracy of music sound pattern detection was 50.08 percent and the algorithm incorrectly detected other sound patterns 49.92 percent of the time. The misclassification of loud emotional voice sounds occurred from the music samples, which produced 5.66 percent unusual voice sound patterns. This was because some of the singers’ voices in the music having high-pitched, screaming voices – e.g., within loud rock music sound samples. The accuracy of the background noise sound pattern detection was 96.81 percent. Carrying position-based accuracy: The mobile phone’s carrying location can affect the accuracy of our loud emotional voice classification algorithm because a sound will sometimes only partially reach the mobile audio sensor. We measured the accuracy of our audio classification algorithm according to the user’s mobile carrying location on the body. According to a survey [12] about the mobile phone’s carrying location, the mobile phone is usually carried in a trouser pocket, upper-body pocket, shoulder bag, a backpack, or a belt enhancement. We located the mobile phone in a user’s hand, pocket, purse, and
114
J. Ahn and R. Han / Personalized behavior pattern recognition and unusual event detection for mobile users Table 3 Audio classification results according to the mobile’s carrying location Location A B C D E
Name Hand Purse Trouser pocket upper-body pocket Backpack
Loud voice classification 835 639 723 752 730
A
Percentage 100% 76% 86% 91% 87%
E D
C B
Fig. 12. Accuracy variation of unusual voice classification depending on mobile placement on human body.
backpack as shown in Fig. 12. We generated 20 actual emotional human voice sounds (i.e., screaming, yelling, loud angry voice) downloaded from YouTube and the mobile phone recorded these sounds. The mobile phone application classified the recorded sounds and the accuracy of these classifications for different mobile carrying positions were compared. The accuracy of the emotional sound classification measurements varied according to the carrying location of the phone: 100% for hand-carrying, and varying levels of accuracy for the other positions. Table 3 shows the accuracy of loud emotional voice classification according to the mobile phone’s location. We located the mobile phone in 5 places – (A: hand, B: purse, C: trouser pocket, D: upperbody pocket, E: backpack). All of the loud emotional voice events were accurately detected for 835 of the sound events when the user carried the mobile phone by hand. The hand-based events was compared with other positions. The number of events detected varied according to the different phone carrying locations. Other than hand-carrying, the highest classification accuracy was 91 percent when the phone was carried in a upper-body pocket and the lowest accuracy was 76 percent, when carried in a purse. The purse consisted of leather, so the experiment-generated sounds had difficulty penetrating though the leather. Although the accuracy of the classification was reduced to 76 percent in the case of the leather purse, the mobile phone still accurately classified three quarters of the sound snippets as the emotional human voice sounds. According to a survey [12] about the mobile phone’s carrying location, the mobile users usually carry the phone in the same location with 93%. The mobile carrying position affected the accuracy of audio classification, but the classified patterns are not much changed because the mobile phone is usually carried in the same position. 6.2. Results for the fusion algorithms We investigated the seven behavior patterns of our mobile users (low level noise, talking voice, music, loud emotional voice, stationary status, walking activity and running activity), measured by the audio
J. Ahn and R. Han / Personalized behavior pattern recognition and unusual event detection for mobile users
115
1 0.8 0.6 recall
0.4
precision
0.2
accuracy
0 Adaboost Bagging
SVM
CI
Classification algorithms Fig. 13. Precision, recall, and accuracy of four classification algorithms for detecting normal events.
and activity classifiers, with our four fusion algorithms to determine the best algorithm for identifying whether a mobile user is involved in an unusual situation. We used a four-day period of training data and a three-day period of testing data to analyze a 30-minute segment of the seven days’ pooled data for the 20 mobile user subjects. The 20 subjects’ training data were used to train four classification models designed to detect unusual events. We used four algorithms (Bagging, Adaboost, CI 95 percent, SVM) for our unusual event classification model development. For Each algorithm in our model, we first used the training data (comprised of ground truth data and the four days of the 20 subject’s collected behavior patterns) to build our four classification models. We used these models as the baseline from which to analyze the testing data to see which of the four algorithms predicted the best overall combined performance for recall, precision and accuracy measurements of the audio and activity data. For the Bagging and Adaboost algorithms, which required some input parameters for their iteration cycles, we found that the fourth stage iteration of these algorithms yielded the best results, so we used this stage to obtain the performance measurements with these two algorithms. The confidence interval of 95 percent yielded the best results in our previous investigation, so we used this cutoff for the CI algorithm. We analyzed recall, precision, and accuracy measurements of the four classification models: Bagging, Adaboost, CI and SVM, to find the best performing one for identifying both normal and abnormal events. Figure 13 shows the performance measurements of the four classification algorithms when using them to detect normal events. We found the best algorithm for detecting normal events was the Bagging algorithm, with combined performance measurements highest of any of the other three algorithms – with 0.97 recall, 0.98 precision, and 0.96 accuracy measurements. The least proficient performing algorithm of the four was the Adaboost algorithm, with a 0.98 recall, a 0.93 precision, and a 0.92 accuracy measurement. Figure 14 shows the performance measurements of the four classification algorithms when using them to detect abnormal/unusual events. Once again, the Bagging algorithm was found to be the best performing of the four algorithms for detecting unusual events with the highest accuracy of 0.87 recall, 0.84 precision, and 0.96 accuracy measurements. The least proficient performing algorithm of the four was the Adaboost algorithm, with a 0.81 recall, a 0.56 precision, and a 0.92 accuracy measurement. One of the reasons we believe the Bagging algorithm performed the best, compared to the other three algorithms, was its iterative process of finding the best average cutoff for the variance in the pool of the subjects’ performance measurements. The ground truth data, collected from the 20 subjects, about which events they considered to be unusual events, contained a lot of variance, since the subjects often defined unusual and usual events differently. The training data included this data and was also based upon this data, thus our training data model’s performance measurements also contained this variance.
116
J. Ahn and R. Han / Personalized behavior pattern recognition and unusual event detection for mobile users
1 0.8 0.6 recall
0.4
precision
0.2
0
accuracy Adaboost Bagging
SVM
CI
Classification algorithms Fig. 14. Precision, recall, and accuracy of four classification algorithms for detecting unusual events. 1 0.95 0.9 adaboost
0.85
bagging
0.8
CI SVM
0.75 0.7 1
2
3
4
5
6
7
8
9
10 11 12 13 14 15 16 17 18 19 20
Survey Subject Fig. 15. The accuracy of four classification algorithms according to individual survey subject for identifying unusual events.
The Bagging algorithm is the least sensitive algorithm to high variance or deviation in the data. The Adaboost algorithm, however, is one of the worst algorithms when dealing with high variance in the data, since it is very sensitive to high variance and uses an iterative weighting process that is based upon the variance across the data points in the data set. In this experiment, Adaboost was found to be the poorest performing one of the four algorithms. The CI algorithm, with a 95 percent CI, provided the second highest results for our model, but it was less optimal than the Bagging algorithm. The SVM algorithm classified unusual events with a line-based threshold. This approach was also less efficient than the Bagging algorithm, and less efficient than the CI algorithm. We also applied the four classification models to the testing data at the individual subject level for the 20 mobile user subjects, comparing each user’s accuracy measurement to the other. We evaluated each of these models across all 20 subjects’ data to identify which classification model, and which algorithm, was the most optimal one for predicting unusual events on average for individual subjects. Figure 15 shows the accuracy measurements obtained from each of the four classification models according for each subject. Once more, we found the best performing algorithm to be the Bagging algorithm, which accurately predicted the occurrence of unusual events for 38 percent of the users. The CI, SVM, and Adaboost algorithms’ were less efficient in predicting the occurrence of unusual events for the users: 32, 17, and 11 percent, respectively. The average accuracy measurements across all 20 users for the four algorithms – Bagging, Adaboost, CI, and SVM – were 0.97, 0.92, 0.95, and 0.93, respectively.
J. Ahn and R. Han / Personalized behavior pattern recognition and unusual event detection for mobile users 1
1
0.95
0.95
0.9
recall precision
0.85
accuracy
0.8
0.9
117
recall precision
0.85
accuracy
0.8
15m
30m
60m
90m
Minutes (a)
15m
30m
60m
90m
Minutes (b)
Fig. 16. Precision, recall, and accuracy according to a period for detecting normal events (a) activity data (b) audio data.
Considering these findings across individuals and the results from the pooled testing data of the 20 users, we found the Bagging algorithm to be the best algorithm overall for classifying unusual events. We thus chose the Bagging algorithm for our trained classification model for our system. 6.3. Determining fusion parameters We investigated the audio and activity pattern data collected from the 20 subjects (limited to the pool of repeatedly visited location data) to find an optimal measurement time period, an reasonable size for the training data, and an optimal confidence interval for the analysis for our system. We split the one week’s worth of data collected from the subjects into a period of four days for the training data and three days for the testing data. Previously we had collected ground-truth data on what constituted a true unusual event in the subjects’ seven day survey period, by querying them during that week as to which events they considered unusual. We used this ground truth data to build our training model and to measure the performance accuracy of each classification algorithm in accurately predicting unusual events in the data. 6.3.1. Results for an optimal classification period We sought to find an optimal time period in which we could identify and classify unusual events. We analyzed four different time periods of 15, 30, 60, and 90 minute intervals, using the default CI of 95 percent as the classifier for investigating these time intervals. We measured the accuracy, precision and recall in two cases: 1) for normal event detection, when the hypothesized normal event was defined as the true event; and 2) for abnormal event detection, when the hypothesized abnormal event was defined as the true event. Figure 16 shows the precision, recall, and accuracy for detecting normal events, measured during the four different time periods. We found that the 30 minute period had the best accuracy with the performance measurements of 0.98 for the activity data and 0.97 for the audio data when detecting normal events. The precision and recall measurements were also very high, with 0.99 and 0.98 for the activity data, and 0.98 and 0.99 for the audio data. All of the performance measurements – accuracy, precision and recall – were quite high, with a very small standard deviation, for every single time period, especially given that there were many normal events with true positive results. We then applied these same performance measurements to the process of detecting abnormal/unusual events that might occur within these time periods, to see which time period had the highest accuracy for detecting abnormal events. Figure 17 shows precision, recall, and accuracy measurements for detecting abnormal events observed across each of these time periods. The accuracy remained at the same high level as detected
118
J. Ahn and R. Han / Personalized behavior pattern recognition and unusual event detection for mobile users
1
1
0.9
0.9 0.8
0.8 recall
0.7
precision
0.6
accuracy
recall
0.7
precision
0.6
accuracy
0.5
0.5 15m
30m
60m
15m
90m
30m
60m
90m
Minutes (b)
Minutes (a)
Fig. 17. Precision, recall, and accuracy according to a period for detecting unusual events (a) activity data (b) audio data. 1
1
0.95
0.95
0.9
recall
precision
0.85
accuracy
0.9
recall precision
0.85
accuracy
0.8
0.8 90%
95%
99%
Confidence Interval (a)
90%
95%
99%
Confidence Interval (b)
Fig. 18. Precision, recall, and accuracy of the confidence interval in detecting normal events (a) activity data (b) audio data.
when measuring performance for detecting abnormal events as it was when detecting normal events. The combined performance pattern of accuracy, precision and recall, however, was highest for the 30 minute period, for abnormal event detection. For the activity data of the abnormal events, precision and recall measurements were 0.94 and 0.67, respectively, and for the audio data, 0.85 and 0.91, respectively. The 15 minute period method correctly detected abnormal events, but it more frequently falsely identified usual events as abnormal events. The 60 and 90 minute period methods more often failed to identify unusual events because the time period was long enough to normalize unusual events to normal events. 6.3.2. Results for an optimal CI We sought to find an optimal confidence interval for identifying each audio and activity classifier. We assembled a 30-minute period each of the activity and audio data collected from the 20 phone survey subjects into two separate files of seven days worth of data to be analyzed. We divided the one week period of data into a four- day period for the training data, which was used for determining the normal distribution of the subjects’ audio and activity data, and a three-day period, which was used for the testing data. We analyzed precision, recall, and accuracy of the testing data with a CI of 90 percent, 95 percent, and 99 percent. We measured the accuracy, precision and recall in two cases: 1) for normal event detection, when the hypothesized normal event was defined as the true event; and 2) for abnormal event detection, when the hypothesized abnormal event was defined as the true event. Figure 18 shows the confidence intervals of the precision, recall, and accuracy measurements when detecting normal
J. Ahn and R. Han / Personalized behavior pattern recognition and unusual event detection for mobile users 1
1
0.9
0.9
0.8
119
0.8
recall
0.7
precision
0.6
accuracy
0.5
recall
0.7
precision
0.6
accuracy
0.5
90%
95%
99%
90%
Confidence Interval (a)
95%
99%
Confidence Interval (b)
Fig. 19. Precision, recall, and accuracy of the confidence interval in detecting unusual events (a) activity data (b) audio data. 1
1
0.95
0.95
0.9
recall precision
0.85
accuracy
0.9
recall
precision
0.85
accuracy
0.8
0.8
One
Two
Three
Number of Days (a)
Four
One
Two
Three
Four
Number of Days (b)
Fig. 20. Precision, recall, and accuracy according to the number of training data for detecting normal events (a) activity data (b) audio data.
events. All three accuracy, precision and recall confidence intervals were quite high, more than 0.97 measurement for each for the activity data, and more than 0.96 measurement for each for the audio data. The CI of 95 percent yielded the best performance result, for detecting normal events with a 0.98 performance measurement for the activity data and a 0.97 measurement for the audio data. The 95 CI was best because the combined pattern of the accuracy, recall and precision measurements was the highest overall at that level. We then analyzed this same segment of data with the same method to find the optimal CI for detecting unusual events. Figure 19 shows the confidence intervals of the precision, recall, and accuracy measurements when detecting abnormal events. This analysis also showed that the CI of 95 percent was the best for abnormal event detection. Although we found at the 90 CI, that the precision was highest because the unusual event detection range was wider and true positive results were increased, the recall measurement was lower at this level because of increased false negatives. At the 99 percent CI the precision was decreased due to increased false positives. Therefore, the combined performance measurement totals of accuracy, precision and recall, yielded the most optimal result at the 95 percent CI. 6.3.3. Feasibility of training data We analyzed the audio and activity sensor data to find the most optimal number of days within which to evaluate the training data and build our model for event detection. We used the three-day pool of testing data, with the 30-minute segmentation from the 20 mobile phone subjects and analyzed the data with
120
J. Ahn and R. Han / Personalized behavior pattern recognition and unusual event detection for mobile users
1
1
0.9
0.9
0.8
0.8
recall
0.7
precision
0.6
accuracy
0.5
recall
0.7
precision
0.6
accuracy
0.5
One
Two
Three
Number of Days (a)
Four
One
Two
Three
Four
Number of Days (b)
Fig. 21. Precision, recall, and accuracy according to the number of training data for detecting unusual events (a) activity data (b) audio data.
the CI of 95 percent. Figure 20 shows the precision, recall, and accuracy for detecting normal events for up to four days of training data evaluated. We found that the performance measurements for the activity and audio training data were consistently high at day one, for each day up to day four, for normal event detection. Even at the lowest measurement performance (day one), the precision, recall, and accuracy measurements for the activity data were 0.99, 0.97, and 0.96, and for the audio data were 0.93, 0.96, and 0.91, respectively. However, day four measurements for the normal training data yields the highest performance level of any of the four days: the increased performance measurements taken at day four for the activity data were 0.99, 0.98, and 0.98 and were 0.98, 0.99, and 0.97 for the audio data, respectively. For unusual event detection, we analyzed the sensor data and obtained the following performance measurements for days one through four, as in shown in Fig. 21. The precision and recall measurements for day one’s training data were 0.76 and 0.50 for the activity data, and 0.52 and 0.69 for the audio data, respectively. These performance and recall results were quite low in contrast to those obtained at day one for normal event detection. However, by day four, the measurements for precision and recall for unusual event detection had increased substantially to readings of 0.94 and 0.67, respectively for the activity data, and 0.85 and 0.91 for the audio data. Noting these results, and that day four provided the highest performance readings of precision and recall across all four days for both normal and abnormal event detection, we felt confident in using a four-day pool of the subjects training data for our analysis, and retaining the remaining three days of the subjects’ mobile survey data for our testing data. 7. Conclusions We have demonstrated how we successfully developed an unusual event classification model to be generalized to users of mobile phones for detection of unusual events in their daily life behavior patterns. Our classification model was the result of testing various binary fusion classification algorithms (Bagging, Adaboost, SVM, and CI) to find the most optimal performing one for our model. The Bagging algorithm was shown to perform the best of all of these algorithms that fuse three-dimension modality mobile sensor data, and to accurately detect unusual events in the mobile users’ personalized daily behavior patterns. We built the behavior classifiers, using daily data collected from the accelerometer, GPS, Wi-Fi, and audio sensors, as well as mobile phone survey data that we collected separately from the users. We foresee that our unusual event classification model could be generalized and expanded for use on the smartphone to detect not only unusual events, but also potentially for automatic alert systems or applications.
J. Ahn and R. Han / Personalized behavior pattern recognition and unusual event detection for mobile users
121
Acknowldgment This work was supported by a grant from the National Science Foundation, CCF 1048298.
References [1] [2] [3] [4] [5] [6] [7] [8]
[9] [10] [11] [12] [13] [14] [15] [16] [17] [18] [19] [20] [21] [22] [23] [24] [25] [26]
B. Logan, Mel Frequency Cepstral Coefficients for Music Modeling, In In International Symposium on Music Information Retrieval, 2000. D.C. Blanchard, A.L. Hynd, K.A. Minke, T. Minemoto and R.J. Blanchard, Human defensive behaviors to threat scenarios show parallels to fear- and anxiety-related defense patterns on non-human mammals, Neurosci Biobehav Rev (2001), 761–770. C.J.C. Burges, A tutorial on support vector machines for pattern recognition, Knowledge discovery and Data Mining (1998), 121–167. D. Taniar and J. Goh, On Mining Movement Pattern from Mobile Users, International Journal of Distributed Sensor Networks 3(1) (2007), 69–86. D. Taniar, W. Rahayu, V.S. Lee and O. Daly, Exception rules in association rule mining, Applied Mathematics and Computation 205(2) (2008), 735–750. D. Taniar, W. Rahayu, O. Daly and H. Nguyen, Mining Hierarchical Negative Association Rules, International Journal of Computational Intelligence Systems 5(3) (2012), 434–451. E. Miluzzo, N.D. Lane, S.B. Eisenman and A.T. Campbell, Cenceme – injecting sensing presence into social networking applications, in: in EuroSSC, ser. Lecture Notes in Computer Science, 2007, pp. 1–28. Online. E. Miluzzo, N.D. Lane, K. Fodor, R. Peterson, H. Lu, M. Musolesi, S.B. Eisenman, X. Zheng and A.T. Campbell, Sensing meets mobile social networks: The design, implementation and evaluation of the cenceme application, in: Proceedings of the 6th ACM conference on Embedded network sensor systems, SenSys ’08, New York, NY, USA, ACM, 2008, pp. 337– 350. Family GPS Tracker Pro, https://play.google.com/store/apps. Family Locator Monitor, https://play.google.com/store/apps. Federal Communications Commission, http://www.fcc.gov/guides/wireless-911-services. F. Ichikawa, Where the phone? A study of mobile phone location in public spaces, in: In Proceedings of Mobility 2005 Conference on Mobile Technology, Applications, and Systems. Retrieved May 1, 2006, Igarashi, 2005, pp. 797–804. G. Schoier and G. Borruso, Spatial Data Mining for Highlighting Hotspots in Personal Navigation Routes, International Journal of Data Warehousing and Mining 8(3) (2012), 45–61. H. Permuter, J. Francos and I.H. Jermyn, Gaussian mixture models of texture and colour for image database retrieval, in: Proc. IEEE International Conference on Acoustics, Speech, and Signal Processing (ICASSP ’03). IEEE Press, 2003. I. Constandache et al., Enloc: Energy-efficient localization for mobile phones, in: Proc. INFOCOM’09. IEEE Press, 2009, pp. 2716–2720. J. Ahn and R. Han, RescueMe: An Indoor Mobile Augmented-Reality Evacuation System by Personalized Pedometry, in: In Proceedings of Services Computing Conference (APSCC), 2011 IEEE Asia-Pacific, 2011, pp. 70–77. J. Ahn and R. Han, Detecting human behavior and feelings to determine safety level status using the mobile phone in a user’s daily life, Protocol: 12-0260, The University of Colorado at Boulder, 2012, pp. 798–802. J. Paek, J. Kim and R. Govindan, Energy-efficient rate-adaptive gps-based positioning for smartphones, in: Proceedings of the 8th international conference on Mobile systems, applications, and services, MobiSys ’10, New York, NY, USA, ACM, 2010, pp. 299–314. Keep Schools Safe, http://www.keepschoolssafe.org/students/fighting.htm. K. Lin, A. Kansal, D. Lymberopoulos and F. Zha, Energy-accuracy aware localization for mobile devices, in: Proc. Eighth International ACM Conference on Mobile Systems, Applications, and Services (MobiSys ’10). ACM Press, 2010. K. Lin, A. Kansal, D. Lymberopoulos and F. Zhao, Energy accuracy trade-off for continuous mobile device location, in: Proc. Eighth International ACM Conference on Mobile Systems, Applications, and Services, ACM Press, 2010, pp. 285– 298. K. Uehara and M. Shimada, Extraction of Primitive Motion and Discovery of Association Rules from Human Motion Data, Lecture Notes in Computer Science, Springer 2281 (2002), 338–348. L. Breiman, Bagging predictors, Machine Learning (1996), 123–140. L.R. Rabiner and B.H. Juang, Fundamentals of speech recognition, Prentice hall, 1993. M. Azizyan, I. Constandache and R. Roy Choudhury, Surroundsense: Mobile phone localization via ambience fingerprinting, in: Proc. MobiCom 2009, ACM Press, 2009, pp. 261–272. National Emergency Number Association, http://www.nena.org/?page=911Statistics.
122 [27] [28] [29] [30] [31]
J. Ahn and R. Han / Personalized behavior pattern recognition and unusual event detection for mobile users S. Ntalampiras, I. Potamitis and N. Fakotakis, On Acoustic Surveillance of Hazardous Situations, in: Proc. ICASSP 2009, IEEE Press, 2009, pp. 165–168. X. Bao and R.R. Choudhury, MoVi: Mobile Phone based Video Highlights via Collaborative Sensing, in: Proc. MobiSys 2010, ACM Press, 2010, pp. 357–370. Y. Cai and K.D. Pados, Sound recognition, Springer 5897 (2011), 16–34. Y. Ma, R. Hankins and D. Racz, iloc: A framework for incremental location-state acquisition and prediction based on mobile sensors, in: Proc. CIKM’09, ACM Press, 2009, pp. 1367–1376. Y. Freund and R.E. Schapire, A decision-theoretic generalization of on-line learning and an application to boosting, Journal of computer and system sciences, 1997.
Junho Ahn received his Bachelor’s Degree in Computer Science in 2006 from Hongik University in South Korea and his Master’s Degree in Computer Engineering in 2008 from Yousei University in South Korea. He is currently working on his PhD Degree in Computer Science at the University of Colorado at Boulder. His areas of interest are wireless sensor networks, mobile computing, and artificial intelligence theory. Richard Han is an associate professor in the Department of Computer Science at the University of Colorado at Boulder. Prof. Han’s research interests span context-aware mobile social cloud systems, cyber-physical systems, cloud systems, wireless sensor networks, safe Web video systems, and peer-to-peer social networks. Prof. Han has received an NSF CAREER award, IBM Faculty awards, and a Best Paper award at ACM MobiSys. He has been general co-chair of ACM MobiSys 2008 and an associate editor of IEEE Transactions on Mobile Computing. Prof. Han graduated with a PhD in Electrical Engineering from the University of California at Berkeley in 1997, and a B.S. in Electrical Engineering, with Distinction, from Stanford University in 1989. Prior to joining CU, Prof. Han was a Research Staff Member at IBM’s T.J. Watson Research Center.
Journal of
Advances in
Industrial Engineering
Multimedia
Hindawi Publishing Corporation http://www.hindawi.com
The Scientific World Journal Volume 2014
Hindawi Publishing Corporation http://www.hindawi.com
Volume 2014
Applied Computational Intelligence and Soft Computing
International Journal of
Distributed Sensor Networks Hindawi Publishing Corporation http://www.hindawi.com
Volume 2014
Hindawi Publishing Corporation http://www.hindawi.com
Volume 2014
Hindawi Publishing Corporation http://www.hindawi.com
Volume 2014
Advances in
Fuzzy Systems Modelling & Simulation in Engineering Hindawi Publishing Corporation http://www.hindawi.com
Hindawi Publishing Corporation http://www.hindawi.com
Volume 2014
Volume 2014
Submit your manuscripts at http://www.hindawi.com
Journal of
Computer Networks and Communications
Advances in
Artificial Intelligence Hindawi Publishing Corporation http://www.hindawi.com
Hindawi Publishing Corporation http://www.hindawi.com
Volume 2014
International Journal of
Biomedical Imaging
Volume 2014
Advances in
Artificial Neural Systems
International Journal of
Computer Engineering
Computer Games Technology
Hindawi Publishing Corporation http://www.hindawi.com
Hindawi Publishing Corporation http://www.hindawi.com
Advances in
Volume 2014
Advances in
Software Engineering Volume 2014
Hindawi Publishing Corporation http://www.hindawi.com
Volume 2014
Hindawi Publishing Corporation http://www.hindawi.com
Volume 2014
Hindawi Publishing Corporation http://www.hindawi.com
Volume 2014
International Journal of
Reconfigurable Computing
Robotics Hindawi Publishing Corporation http://www.hindawi.com
Computational Intelligence and Neuroscience
Advances in
Human-Computer Interaction
Journal of
Volume 2014
Hindawi Publishing Corporation http://www.hindawi.com
Volume 2014
Hindawi Publishing Corporation http://www.hindawi.com
Journal of
Electrical and Computer Engineering Volume 2014
Hindawi Publishing Corporation http://www.hindawi.com
Volume 2014
Hindawi Publishing Corporation http://www.hindawi.com
Volume 2014