BUILDING RECONSTRUCTION FROM WORLDVIEW DEM USING IMAGE INFORMATION Hossein Arefi and Peter Reinartz Remote Sensing Technology Institute, German Aerospace Center – DLR, D-82234 Wessling, Germany E-Mail:
[email protected]
KEY WORDS: Digital Elevation Models(DEM), Worldview–2, orthophoto, ridge line, local maxima, projection, approximation, RANSAC
ABSTRACT: In this paper an algorithm is proposed for extraction of 3D models corresponding to the buildings from Digital elevation Models (DEM) produced from Worldview–2 stereo satellite images. The edge information extracted from orthorectified images are used as additional information for 3D reconstruction algorithm. Particularly the complex buildings containing several smaller building parts are discussed. For this purpose, a model driven approach based on the analysis of the 3D points of DEM in a 2D projection plane is proposed. Accordingly, a building region is divided into smaller parts according to the direction and the number of ridge lines for parametric building reconstruction. The 3D model is derived for each building part and finally, a complete parametric building model is formed by merging the 3D models of the building parts and adjusting the nodes after the merging process. For remaining areas which do not contain ridge lines, a prismatic model by approximation of the corresponding polygon is derived and merged to the parametric models to shape the final model of the building. 1
INTRODUCTION
Automatic building reconstruction from Digital Elevation Models (DEM) using or without using other data sources is still an active research area in Photogrammetry or GIS institutions around the world. In this context, providing a 3D CAD model which represents the overall shape of the building and containing the most significant parts has boosted many applications in the GIS area such as urban planning and mobile navigation systems. In the past few years, several algorithms have been proposed for automated 3D building reconstruction. The algorithms comprises methods that only employ elevation data such as high resolution airborne LIDAR for model generation while some methods use other additional sources of data. An additional data source plus DEM is usually employed when the quality or resolution of the elevation data is not appropriate for model generation. Segmentation based approaches for a 3D building model generation from grid data are proposed by Geibel and Stilla (2000) and Rottensteiner and Jansa (2002) to find planar regions which determine a polyhedral model. Gorte (2002) employed another segmentation approach using TIN structure for the data that the segments are generated by iteratively merging the triangles based on similarity measurements. Rottensteiner (2006) described a model for the consistent estimation of building parameters, which is part of the 3D building reconstruction. Geometric regularities were included as soft constraints in the adjustment of the model. Robust estimation can be then used to eliminate false hypotheses about geometric regularities. A comparison between data- and modeldriven approaches for building reconstruction have been made which states that the model-driven approach is faster and does not visually deform the building model. In contrast, the data-driven approach tends to model each building detail to obtain the nearest polyhedral model, but it usually visually deforms the real shape of the building (Tarsha Kurdi et al., 2007). A projection based approach for 3D model generation of the buildings from high resolution airborne LIDAR data has been proposed by Arefi et al. (2008). The building blocks have been divided to smaller parts according to the location and direction of the ridge lines. A projection based method was applied to generate CAD model of each building parts.
Kada and McKinley (2009) utilized a library of parameterized standard shapes of models to reconstruct building blocks. The buildings are partitioned into non-intersecting sections, for which roof shapes are then determined from the normal directions of the LIDAR points. In this paper we propose a method which aims at simplifying the 3D reconstruction of the building blocks by decomposing the overall model into several smaller ones corresponding to each building part. A similar method has been already reported by the author (Arefi, 2009) for reconstruction of high resolution LIDAR data. In this paper due to a lower quality of the DEM produced by stereo matching of satellite data (Worldview–2) comparing to the LIDAR data, an additional data source is employed. Accordingly, the Worldview orthorectified image is employed for a better extraction of the ridge lines. According to each ridge line a projection-based algorithm is employed to transfer the 3D points into 2D space by projecting the corresponding pixels of each building part onto a 2D plane that is defined based on the orientation of the ridge line. According to the type of the roof, a predefined 2D model is fitted to the data and in the next step, the 2D model in extended to 3D by analyzing the third dimension of the points. A final model regarding the parametric roof structures of the building block is defined by merging all the individual models and employing some post processing refinements regarding the coinciding nodes and corners to shape the appropriate model. Additionally prismatic models with flat roof are provided regarding to the remaining areas that are not containing ridge lines. Finally, all parametric and prismatic models are merged to form a final 3D model of the building. 2
PROPOSED ALGORITHM FOR BUILDING RECONSTRUCTION
In this section a new method is proposed for reconstruction of buildings by integrating Digital Elevation Models (DEM) produced from Worldview-2 stereo satellite images and orthorectified image information. Worldview–2 provides panchromatic images with 50cm ground sampling distance (GSD) as well as eight-band multispectral im-
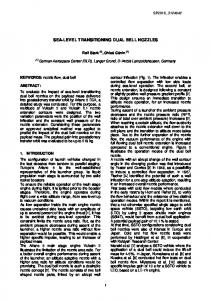
ages with 1.8m GSD. A DEM is produced from panchromatic Worldview–2 images with 50cm image resolution using a fully automated method (d’Angelo et al., 2009) based on semiglobal stereo matching algorithm using mutual information proposed by Hirschm¨uller (2008). The automatic 3D building reconstruction algorithm proposed in this paper comprises the following three major steps: 1. Ridge-based decomposition of building parts 2. Projection-based reconstruction of parametric roofs 3. Approximation of the polygons relating to flat roof segments 4. Merge parametric and prismatic models Figure 1 presents the proposed work flow for automatic generation of building models using a projection based algorithm. Detailed explanations are given in the following chapters.
Building Segment
Height Pixels
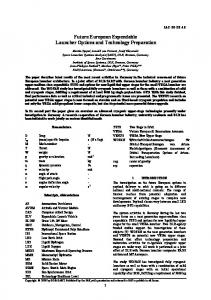
• Ridge lines are basis for decomposing the building block to smaller tiles. • Ridge lines are basis for projection based model generation of each part. Therefore, the first and the most important part of generating 3D models of building parts containing tilted roof structures is extracting ridge lines. Arefi (2009) proposed an algorithm to extract the ridge location from high resolution airborne LIDAR data using morphological geodesic reconstruction (Gonzalez and Woods, 2008). Due to a lower quality of DEM created from Worldview stereo images comparing to the LIDAR data, a method relying on only height data does not produce appropriate ridge pixels. In this paper, a method by integrating orthorectified image and DEM information is applied for a high quality ridge line extraction (cf. Figure 1). The procedure to extract all the ridge lines corresponding to a building with tilted roofs begins with feature extraction. For this purpose, three feature descriptors are extracted from DEM and ortho image as follows (cf. Figure 2):
Ortho Image (a) Worldview DEM
(b) Ortho photo
Surface Normal Regional Maxima Edge Information
Ridge Lines
Localization Projection to 2D 2D Model Extension to 3D
Merge Parametric Models Ground Plane
Approximation of Remaining Parts
RANSAC Based
MBR Based
Prismatic Model Merge to Final 3D Model
Figure 1: Work flow for projection based 3D building reconstruction 2.1
Ridge-based decomposition of building parts
The idea of 3D building reconstruction proposed in this paper is to simplify the modeling process by decomposing the overall building model into the smaller tiles based on the location of the ridge lines. Accordingly, location of the ridge lines in buildings with tilted roof structures should be carefully extracted. The quality of the final model has a direct relation to the quality of extracted ridge lines, i.e., a high quality ridge line leads to a higher quality 3D model. The location of ridge line has two major roles in this modeling approach:
(c) Surface normals
(d) Regional maxima
(e) Canny edges
Figure 2: Feature extraction from DEM and orthorectified images 1. Surface normals on DEM: The surface normal is a vector perpendicular to a surface which represents the orientation of a surface at a pixel. It can be estimated by determining the best fitting plane over a small neighborhood. A normal vector can also be computed by means of the cross product of any two non-collinear vectors that are tangent to the surface at the desired pixel (Jain and Dubes, 1988). Figure 2(c) shows the surface normals generated from the worldview DEM. This feature descriptor is employed to eliminate the pixels with a sharp height discontinuity, e.g., eaves, from the other edge pixels. 2. Regional maxima from DEM: Here, an algorithm based on image reconstruction using geodesic morphological dilation (Arefi and Hahn, 2005) is employed to extract the regional maxima regions. The geodesic dilation differs to basic dilation where an image and a structuring element are involved in the filtering process. In geodesic dilation additionally the dilated image is “masked” with a predefined “mask” image. Equation 1 shows the geodesic dilation of image J (marker) using mask I. In most applications, the marker image is defined by a height offset to the mask image, which generally represents the original DEM. Figure 3 illustrates the difference between geodesic and basic image dilation as well as
Figure 3: Applying geodesic reconstruction to extract the top pixels of a sample building reconstruction based on geodesic dilation in a profile view of a simple building with gable roof. The input image 3(a), called marker, is enlarged by dilation 3(b), and limited by the mask image (I) (cf. Figure 3(c)). The result of geodesic dilation is shown in Figure 3(d) and a dashed line around it depicts the mask image. If this process, i.e., dilation and limitation by mask, is iteratively continued, it stops after n iterations (here four) reaching stability. The result provided by this step is called reconstruction of marker (J) by mask (I) using geodesic dilation (cf. Figure 3(g)). The number of iteration, i.e., n in Equation 2, to create reconstructed image varies from one sample to another. In the example presented in Figure 3 the reconstruction procedure stops after four iteration. Accordingly, geodesic dilation (δI ) and image reconstruction are defined as (1)
δI (J) = (J (n)
(1)
M (1)
B)
^
I,
{z
ntimes
The above mentioned three feature descriptors are employed to classify edge pixels extracted from the orthorectified image into ridge and non-ridge classes. Figure 4(a) illustrates the pixels which are classified as ridge pixels plotted by red points. As shown, all the red pixels do not correspond to the ridges and therefore, an additional procedure is included to separate horizontal pixels from the other pixels. For this aim, the pixels located in almost same height are extracted (cf. Figure 4(b)). Next, RAndom Sample Consensus (RANSAC) algorithm (Fischler and Bolles, 1981) is employed to extract corresponding ridge lines from the classified pixels (cf. Figure 4(c)).
(1) (1)
δI (J) = δI (J) ◦ δI (J) ◦ .... ◦ δI (J)
|
Canny edge extraction method looks for local maxima of the gradient of the image.
(2)
}
Equation (2) defines the morphological reconstruction of the marker image (J) based on geodesic dilation (δI ) (cf. Equation 1). The basic dilation (δ) of marker and point wise minimum (∧) between dilated image and mask (I) is employed iteratively until stability. Looking at the reconstructed image of the example depicted in Figure 6 shows that the upper part of the object, i.e., the difference between marker and mask is suppressed during image reconstruction. Therefore, the result of gray scale reconstruction depends on the height offset between the marker and the mask images and accordingly, different height offset suppress different parts of the object. More information regarding the segmentation of the DEMs by gray scale reconstruction using geodesic dilation can be found in (Arefi, 2009) where similar algorithms are employed for extracting the 3D objects as well as the ridge lines from high resolution LIDAR DSM. In a segmentation algorithm based on geodesic reconstruction, selecting an appropriate “marker” image plays the main role and has a direct effect on the quality of the final reconstructed image. A “marker” image with a small offset, e.g., few meters, from the “mask” can suppress mainly local maxima regions similar to the artifacts above the ground. 3. Canny edges from orthorectified image: Figure 2(e) represents the result of applying Canny edge detector on orthorectified image relating to the selected building. As shown, the
(a) Potential ridge points
(b) Classification of heights
(c) RANSAC lines
Figure 4: Ridge extraction 2.2
Projection-based reconstruction of parametric roofs
In the proposed algorithm for 3D reconstruction of buildings containing tilted roofs it is assumed that an individual building part exists according to each ridge line. Therefore, for each ridge line and the pixels locating in its buffer zone, a 3D model is fitted. In order to extract the corresponding pixels to each ridge line, a buffer zone around each ridge line is considered and the localized pixels in that buffer zone are analyzed for model generation. In figure 5(a) the red points represent the localized points corresponding to the blue ridge line. Procedure continues by projecting the localized points onto a 2D plane perpendicular to the ridge direction (cf. Figure 5(b)). The overall aim in this step is to look from the front view of the building part defined by the ridge direction and extract the 2D model related to the front- and back-side of the building part that take maximum support of the pixels. Therefore, two vertical lines relating to the walls and two inclined lines relating to the roof faces are defined (cf. Figure 5(b)). The quality of the 2D model in this step depends on the existence of a sufficient number of height points relating to each side of the wall. It is common in complex buildings that the number of supporting height points at least for
one side of the building part is not sufficient to be able to extract the corresponding vertical line. To cope with this problem a vertical line which is located symmetrically to the side with more supported points is defined. Hence, the algorithm in this step only extracts the side walls having equal distances to the ridge position. In order to shape the final 3D model relating to the building part, the 2D model is converted back to 3D by extruding it orthogonally to the projection plane. The 3D model consists of four walls plus one to four roof planes: two inclined planes in addition to two vertical triangular planes for a gable roof, and four inclined planes for a hipped roof (cf. Figure 5(c)). After reconstructing 3D models for all building parts, they are merged to form the overall 3D model of the building. Figure 5(d) displays a building model produced by merging three building parts. The three ridge lines lead to three parametric building models with hipped roofs. The method contains some extra processes to refine the nodes which represent the same corner. If the nodes are close to each other an average location is determined. 590 588
(e) New regions produced by subtraction of (c) and (d)
586 584
(f) Superimposed final rectilinear polygons (red) on DEM
582
Figure 6: MBR based polygon approximation
580 578
90 100
80
95 90
70
(a) Localized pixels
(c) 3D model of building part
576 574 572 70
75
80
85
90
95
100
105
(b) Fitting 2D model
method is applied for approximation. In this algorithm the straight lines are repeatedly extracted using RANSAC algorithm and merged to form the final polygon. Figure 7 shows the RANSAC based approximation of the same building represented in Figure 6.
(d) Merge parametric models
Figure 5: Projection based model generation 2.3
Approximation of the remaining polygons and generating prismatic models
Two algorithms are proposed for approximation of the building polygons based on the main orientation of the buildings (Arefi et al., 2007). The algorithms are selected according to the number of main orientations of the buildings and implemented as follows: • If the building is formed by a rectilinear polygon, i.e., sides are perpendicular to each others from the top view, a method based on Minimum Bounding Rectangle (MBR) is applied for approximation. This method is a top-down, model-based approach that hierarchically optimizes the initial rectilinear model by fitting MBR to all details of the data set. Principles of MBR based polygon approximation is presented in Figure 6. • If the building is not rectilinear, i.e., at least one side is not perpendicular to the other sides, the RANSAC based
Figure 7: Approximation of polygon obtained using RANSAC
In order to include the other structures (here, with flat roof) into the merged parametric model generated in Section 2.2, the ground plan of the merged model is compared with approximated polygon. In figure 8(a) the corresponding area related to the parametric models plotted as blue lines and approximated polygon by MBR based method is illustrated using red lines. The overall area of the approximated polygon is subtracted from the corresponding area for the parametric models. The positive pixels belong to protrusions and the negative pixels are related to indentations. Corresponding areas to the protrusion and indentation are again approximated. The average of the heights of the internal points of protrusion area is used as height of the building part. Although, this does not mean that the protrusion parts have
(a) MBR based approximation (red) and parametric models (blue)
(b) Merged parametric and prismatic models
Figure 8: Generating final 3D model of a building containing parametric and prismatic roof structures always flat roof, but since their corresponding roof types cannot be distinguished by the proposed algorithm, a prismatic model is fitted to the points. 2.4
Merge parametric and prismatic models
A final model of the building block is provided by including the prismatic model corresponding to the protrusion area to the parametric models and excluding the indentation area from it. The corresponding polygon nodes of indentation and protrusion regions are included in the overall 3D model. Finally, the inclinations of the building roofs are adapted after including the indentation nodes. Figure 8(b) shows the final 3D reconstruction model of the building block after merging parametric and prismatic models. As shown, the building contains a dome shaped part which is not properly modeled. 3
(a) 3D models superimposed on ortho rectified image
RESULTS AND DISCUSSION
The proposed algorithm for 3D reconstruction of the buildings from Worldview-2 DEM by integrating image information has been tested in an area located at the city center of Munich – Germany. The area contains 7 buildings with different shapes that are all modeled using projection based approach. Figure 9 illustrates the vector polygons corresponding to the 3D models plotted on the orthorectified 9(a) image as well as the Digital Elevation Model 9(b). The visual interpretation of the models from the top view (2D), comparing to the orthorectified image and DEM shows that almost all the extracted eave and ridge lines of the buildings are located on their correct locations. As mentioned, the model still can be refined to generate coinciding corners. Additionally the comparison can be extended in 3D by superimposing the representation of the parametric models on a 3D surface generated from the DEM (cf. Figure 10). In this figure the roof and wall polygons are filled by green and red colors, respectively. Accordingly, the quality of the model can be evaluated by rate of visible colors against gray (height) pixels. In area where the green colors are visible, the produced roof model is higher than the height pixels in the DEM. In contrast the visible gray pixels on the roofs show that the roof model is located below the DEM in that points. A similar conclusion describes the quality of the walls against DEM pixels. Figure 11 shows a picture provided from “Google Earth” corresponding to the test area. It is captured from 3D view which also proves the quality of the produced 3D
(b) 3D models superimposed on DEM Figure 9: Automatically generated 3D building models superimposed on (a) orthorectified Worldview image and (b) DEM model. Comparison of the model represented in Figures 10 and 9 with this figure shows that there are still some small 3D structures such as dormers and cone shaped objects that are not modeled. This is due to not sufficient allocated pixels corresponding to that regions in DEM for model generation. 4
CONCLUSIONS
An algorithm for automatic 3D reconstruction of the buildings from Worldview-2 DEM is proposed which also uses edge information from orthorectified image. According to the ridge information the building block is decomposed into several parts de-
Arefi, H. and Hahn, M., 2005. A morphological reconstruction algorithm for separating off-terrain points from terrain points in laser scanning data. In: International Archives of Photogrammetry, Remote Sensing and Spatial Information Sciences, Vol. 36 (3/W19). Arefi, H., Engels, J., Hahn, M. and Mayer, H., 2007. Approximation of building boundaries. In: Urban Data Management Systems (UDMS) Workshop, Stuttgart, pp. 25 – 33.
Figure 10: 3D representation of parametric models superimposed on DEM
Arefi, H., Engels, J., Hahn, M. and Mayer, H., 2008. Levels of Detail in 3D Building Reconstruction from LIDAR Data. In: International Archives of the Photogrammetry, Remote Sensing and Spatial Information Sciences, Vol. 37 (B3b), pp. 485 – 490. d’Angelo, P., Schwind, P., Krau, T., Barner, F. and Reinartz, P., 2009. Automated dsm based georeferencing of cartosat-1 stereo scenes. In: HighRes09, pp. xx–yy. Fischler, M. and Bolles, R., 1981. RAndom Sample Consensus: A paradigm for model fitting with applications to image analysis and automated cartography. Communications of the ACM 24(6), pp. 381–395. Geibel, R. and Stilla, U., 2000. Segmentation of laser-altimeter data for building reconstruction: Comparison of different procedures. In: International Archives of Photogrammetry and Remote Sensing and Spatial Information Sciences, Vol. 33 (B3), pp. 326 – 334. Gonzalez and Woods, 2008. Digital Image Processing. Prentice Hall, Upper Saddle River, NJ. Gorte, B., 2002. Segmentation of TIN-structured surface models. In: International Archives of Photogrammetry and Remote Sensing and Spatial Information Sciences, Vol. 34 (4). Hirschm¨uller, H., 2008. Stereo processing by semiglobal matching and mutual information. IEEE Trans. Pattern Anal. Mach. Intell. 30(2), pp. 328–341. Jain, A. and Dubes, R. C., 1988. Algorithms for Clustering Data. Prentice Hall, Englewood Cliffs, NJ.
Figure 11: Google earth – Corresponding to the test area pending on the number of ridge lines. For each ridge, a projection plane is defined and all the points located on the buffer zone of the ridge line are projected onto that plane. Next, a 2D model which is supported by maximum number of projected points is modeled and then extended to 3D to shape a hipped- or gabled-roofs (parametric model). Integrating all 3D models corresponding to each ridge line produces the parametric model of the building block. Additionally prismatic models with flat roof are provided regarding the remaining areas that are not already modeled by the projection based method. Finally, all parametric and prismatic models are merged to form the final 3D model of the buildings. The example used in the previous section to illustrate the developed algorithms shows that the concept for building reconstruction works quite well. A strength of this projection based approach is its robustness and that it is quite fast because projection into 2D space reduce the algorithmic complexity significantly.
References Arefi, H., 2009. From LIDAR Point Clouds to 3D Building Models. PhD thesis, Bundeswehr University Munich.
Kada, M. and McKinley, L., 2009. 3D Building Reconstruction from Lidar Based on a Cell Decomposition Approach. pp. 47– 52. Rottensteiner, F., 2006. Consistent estimation of building parameters considering geometric regularities by soft constraints. In: International Archives of Photogrammetry, Remote Sensing and Spatial Information Sciences, Vol. 36 (3), pp. 13 – 18. Rottensteiner, F. and Jansa, J., 2002. Automatic extraction of buildings from LIDAR data and aerial images. In: International Archives of Photogrammetry, Remote Sensing and Spatial Information Sciences, Vol. 34number 4, pp. 569–574. Tarsha Kurdi, F., Landes, T., Grussenmeyer, P. and Koehl, M., 2007. Model-driven and data-driven approaches using LIDAR data: Analysis and comparison. In: International Archives of Photogrammetry, Remote Sensing and Spatial Information Sciences, Vol. 36 (3-W49A), pp. 87 – 92.