Building Spatial Decision Support Tools for Individuals and Groups Gennady Andrienko1, Natalia Andrienko1, and Piotr Jankowski2 1
Fraunhofer AiS –Autonomous Intelligent Systems Institute Schloss Birlinghoven, D-53754, Sankt-Augustin, Germany WWW: http://www.ais.fhg.de/and/ e-mail:
[email protected] 2 Institute for Geoinformatics, Westfälische Wilhelms-Universität Robert-Koch-Str. 26-28, D-48149, Münster, Germany WWW: http://ifgi.uni-muenster.de/ e-mail:
[email protected]
We conducted a series of experiments on collective multiple criteria decision making in a spatial context. The first experiment allowed us to understand the needs of participants and facilitator (mediator) of the decision making process. This gave us the design basis for developing a set of interactive software tools to support decision making by individuals and groups. The tools were tested and evaluated by users in the subsequent experiments. The results of the experiments demonstrated that a variety of computational and visual tools is needed to support different decision making styles. ABSTRACT:
KEY WORDS:
spatial decision support, cooperative decision support, visualization
1. Introduction Recent contributions to spatial multi-criteria decision support methods (see, for example, [Malczewski 1999, J-C. Thill 1999]) revealed the need to combine computational decision support tools with highly interactive map displays. We addressed this need by developing a prototype map-centered decision support system DECADE described in Jankowski, Andrienko and Andrienko [2001]. The prototype was intended for individual decision makers. We were also interested in extending the system to support collective decision making involving, in particular, decision option voting and the analysis of voting results by a facilitator or a mediator. In order to help us understand, which tools were needed and how they should be designed we decided to observe a process of cooperative spatial decision making. For this purpose in September of 2000 we conducted an experiment that allowed us to make such observations. It was called Wallis experiment since we used in it a data set with characteristics of the skiing resorts in the Swiss canton of Wallis. The experiment gave us not only the design ideas for the development of group decision support tools but also provided us with valuable observations concerning different styles of individual decision making. On the basis of the experiment we developed additional tools for individual decision makers. In order to test the tools, two additional “Wallis” experiments were organized in June and September of 2001. In the remainder of the paper we describe the results of the experiments. §2 reports on the first Wallis experiment and offers our evaluation of what transpired during the experiment. In §3 we describe tools we developed on the basis of the experiment. In §4 we report about the second and third Wallis experiments. §5 summarizes our findings and offers a conclusion resulting from the experimental work. 2. The first Wallis experiment: analysis of user needs The first experiment was organized in order to observe the process of collective decision making and to understand the needs of participants for decision support software tools. 2.1. The data In all the experiments we used a data set with characteristics of 40 skiing resorts situated in the Wallis (Valais) canton in Switzerland. The resorts were characterized in terms of the following attributes: 1) maximum elevation (above the mean sea level);
Building Spatial Decision Support Tools 3
2) relative altitude (the difference between the maximum and the minimum elevation); 3) duration of the skiing season in days; 4) number of ski lifts available; 5) price of the weekly skiing pass; 6) price discount for children (in %); 7) total length of available ski runs ; 8) beginner skiing runs (% of the skiing area); 9) intermediate skiing runs (% of the skiing area); 10) expert skiing runs (% of the skiing area). The DECADE software, used in the experiment, allowed to see the locations of the resorts on a map. Unfortunately, we did not have high-quality geographic data for a background map. The map we ended up using in the experiments did not provide any other thematic information besides the relative positions of the resorts. The thematic mapping facilities of DECADE, inherited from its ancestor Descartes [Andrienko and Andrienko 1999], allowed the users to display on a map the characteristics of resorts.
2.2. Organization of the experiment The experiment was conducted with a group of 13 persons, mostly the employees of the Institute for Autonomous Intelligent Systems in Sankt Augustin, Germany. One person participated in the experiment remotely, from the USA. The group was given a task: select a place for a collective retreat. The participants were asked first to analyse the available options individually and classify them into 3 categories: 1) places I want to go; 2) places I could agree to go; 3) places I do not want to go. The participants were asked to send the resulting classifications to the organizers who played the role of mediators of the cooperative decision making process. Their task was to analyse the individual votes and to develop strategies for achieving a consensus. A parallel task was to find out which tools a real mediator would need to foster a consensus-based solution. The participants were invited to use the tools of DECADE for exploring the decision space and deciding about their individual preferences. In particular, two methods were available for ranking the options: “ideal point” and “aspiration levels” [Jankowski, Andrienko and Andrienko 2001]. These two methods are suited to different styles of decision making. Since the DECADE prototype had no tools to support voting, the participants had to express their preferences by filling out a special voting table. This was, rather
inconvenient, and in the effect many participants did not fill the table completely but instead assigned the categories only to some selected skiing locations (decision options). As the result, the organizers had to deal with one more category, “not considered”. For the analysis of votes the organizers used the visualization facilities of DECADE combined with computations in Excel. The results of the analysis were published on a Web server and illustrated with maps and graphs produced in DECADE. On the basis of the analysis the “mediators” decided to focus the further decision process on a small subset of the most promising options, i.e. the options, which participants were most likely to agree upon. The participants were asked to re-consider the selected options and to vote on them. From this point on the participants had to deal with 7 options instead of initial 40. As the result, all votes were complete, that is, included all seven options. Again, the organizers analysed the votes and found that the opinions about 3 out of 7 options were close to a consensus. This led the organizers to a conclusion that further progress in the decision process required a discussion by the participants of three promising options and, possibly, collecting additional information. Since achieving the consensus among the participants was not the primary goal of the experiment the organizers decided to consider the experiment as completed.
2.3. Evaluation of the first Wallis Experiment The experiment resulted in valuable observations about individual decision making behaviour. It became clear that additional tools were needed to support different categories of users. First, some participants were reluctant to use the computational decision support tools such as the “ideal point” and “aspiration levels”. They preferred to get a table with the source data and to manually sort the options. Such a behaviour could not be explained by the lack of computer expertise, since the participants who used this approach to rank decision options were experienced programmers. One conclusion that can be drawn from this observation is that some people need decision support tools that give them a feeling of “full control” over the outcomes. Such a tool should only conveniently represent the source information allowing the user to rank or classify the options. Another conclusion is that computational tools must be designed to promote clearer understanding of how the results were obtained. Only then a full-control-minded user can accept the results as the basis for her/his decision. Although in DECADE we combined the “ideal point” method with the parallel coordinate plot thus allowing the user to compare the initial characteristics and the final evaluation scores of decision options, we found that further improvements were needed.
Building Spatial Decision Support Tools 5
Second, among the participants there were non-skiers for whom most of the available data about the resorts turned out to be irrelevant. They looked for additional information about the resorts on the Web and expressed their wish to add to the data set some additional attributes such as “presence of thermal pools”, etc. For the tool developers it became clear that the decision support system must allow the users to define new attributes and to use them in the process of decision making. It would be also convenient for the users to be able to open URLs with additional information about the options by selecting the options in a map display. Third, the participants often had implicit preferences. Thus, one person liked Zermatt for its “scenic beauty”, another participant preferred Crans Montana because he used to go there, and so on. In some decision problems such preferences might be inadmissible, but for problems like selection of a house to buy or a place to go on vacation they are quite natural. We noticed that some participants tried to adjust the weights of the criteria in the “ideal point” method in order to move their “favourites” to higher positions in the resulting ranking. Instead the system should offer the users alternative ways of expressing their implicit preferences, for example, a tool to edit the ranking coming from a computational procedure. The implicit preferences may include place-based qualitative perceptions not captured in the database. Another observation concerning the support of participants in cooperative decision making was that the system must enable the submission of participants’ votes to a central server where all the votes are collected. By playing the roles of mediators of the cooperative decision making process we compiled the following wish list of tools needed for the analysis of votes and for planning further actions: 1) A tool for bringing all votes into a common table. 2) Transformation of classification into a numeric attribute (number of points). In our experiment we did this by assigning 3 points to class A, 2 to class B, 0 to class C, and 1 to “not considered”. 3) Calculation of the average vote (number of points) and the variance of votes for each option. 4) A tool for the visualization of cumulative voting results and the vote variances on a map. At the same time we found that many analytical activities were well supported by the tools available in DECADE and in a new version of Descartes called CommonGIS, being under development at the moment of conducting the experiment. In particular, the participants used the following techniques: 1) bar charts for representation of individual votes on the map; 2) scatter plot for the analysis of vote averages and variances; 3) “dynamic query” for the selection of most promising options [Ahlberg, Williamson, and Shneiderman 1992];
4)
parallel coordinate plot for the analysis of individual votes and to reveal “outsiders” [Inselberg 1998].
In the next section we describe tools and techniques we developed in the CommonGIS system using the results of the first Wallis experiment.
3. Decision support tools for individuals and groups
3.1. “Visual” decision making with “utility symbols” To support visual evaluation of spatially distributed options and to search for suitable options on a map, we developed a method for cartographic representation of characteristics of options called “utility symbols”. We designed the “utility symbols” technique as an alternative to the computation-based decision support methods we had earlier in our system. It was devised to give the user a feeling of better control over the process of option evaluation and stronger involvement in the process. Like the “ideal point” tool, the “utility symbols” visualization technique allows the users to express the relative importance of decision criteria through the weights of the criteria. The interface for the specification of criterion weights is the same as in the “ideal point” tool. It is illustrated in Figure 1. The arrows indicate the types of the criteria: benefit (to be maximized) or cost (to be minimized). A detailed description of the controls can be found in Jankowski, Andrienko and Andrienko [2001].
Building Spatial Decision Support Tools 7
Figure 1. The user interface for specification of types of criteria and manipulation of their weights.
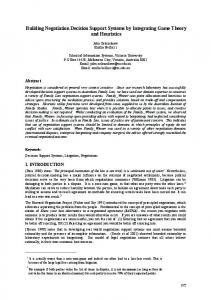
In our system we implemented two variants of utility symbols: utility bar charts (or, simply, utility bars) and utility wheels. A utility sign consists of several graphical elements (Figure 2): bars in utility bar charts and circle segments in utility wheels. Each element corresponds to one of the attributes under consideration (decision criterion). One dimension of an element (height of a bar and radius of a circle wedge ) represents a value of the attribute. When the attribute is a benefit criterion (for example – number of ski lifts) the size is proportional to the value, for a cost criterion (for example – cost of skiing pass) the size is inversely proportional to the value. Hence, better values, that is values maximizing benefit criteria or minimizing cost criteria, are always represented by bigger sizes. The other dimension (width of a bar and angle of a circle wedge ) represents the importance of a criterion. When the user interactively changes the weights of the criteria, the symbols on the map are immediately redrawn.
Figure 2. Utility bar charts and utility wheels. The total area of bars or wheel wedges represents the “goodness”, or utility, of a decision option the given symbol (bar chart or wheel) stands for. Hence, a decision maker needs to look on the map for symbols with the largest areas. To simplify the estimation of utility symbol areas and, thereby, the visual evaluation of options, the signs can be supplemented by frames showing the maximum area (see Figure 2 on the right). The frame area corresponds to the best possible values of all the attributes. Hence, the larger the filled part of the frame, the better the option is. To facilitate visual search for the best options on the map, we have implemented an interactive control that allows the user to remove from the view symbols with areas smaller than a specified threshold (in percentage to the maximum possible area). We called this operation “focusing” because it allows the user to focus the analysis on a subset of the most promising options. Thus, the map in Figure 3 includes only symbols with areas no less than 50% of the maximum possible area. Note that manipulation of weights of the criteria may change the areas of the symbols and therefore can result in some of the currently visible symbols disappearing and some of the previously hidden symbols becoming visible.
Figure 3. The operation of focusing: only the symbols with no less than 50% of the maximal area filled are shown on the map.
To support the comparison of option characteristics, we designed and implemented an interactive operation of visual comparison applied to utility bars. The user may select any option as a reference object, and the symbols for other options will change so that upward oriented bars represent more preferable values than the reference option and downward oriented bars – less preferable values. The heights of the bars are proportional to the differences in the values. Figure 4 illustrates the effect of the visual comparison operation.
Option A Initial appearance of the symbols (no comparison) Comparison to option A
Comparison to option B
Figure 4. “Visual comparison” using utility bars.
3.2. Transformations of parallel coordinates
Option B
Building Spatial Decision Support Tools 9
In Jankowski, Andrienko and Andrienko [2001] we described the combination of the “ideal point” decision support method with the visualization of option characteristics on an interactive parallel coordinate plot. In the course of the first Wallis experiment we found that there was a need to improve user’s understanding of how r the final evaluation scores were arrived at. In the new version of the parallel coordinate plot the axes for benefit and cost criteria have different orientation: left to right vs. right to left. The orientation is indicated by arrows. This arranges automatically the best values of each attribute on the right, and the worst on the left. Accordingly, it is easy to estimate visually how good any specific option is: the user only needs to look how close a line representing the given option is to the right edge of the plot. Differences in relative weights of criteria are represented by axis’ length : longer axes correspond to more important criteria (see the upper part of Figure 5). Due to this transformation the lines of options surpassing others on important (higher weighted) criteria shift visually more to the right (“desirable”) edge of the plot. Results of computation by the “ideal point” method are represented on the parallel coordinate plot together with the source data. Thus, in the plot shown in Figure 5 the computed scores are represented on the axis second from the bottom, and the bottom axis reflects ranking of the options with respect to the scores achieved (note a different orientation of these two axes). Such a display significantly helps in understanding the outcome of multicriteria evaluation: the user can see the connection between the integrated scores and the proximity of the lines to the right edge of the plot. The plot allows the interactive analysis of the sensitivity of aggregated scores to changes in weights. When the user alters any of the weights, the scores are immediately re-computed, and the results are reflected in the plot. At the same time the axes of the plot extend or shrink. The parallel coordinate plot is linked to a map showing locations of the options (Figure 5, bottom). The map may represent the aggregated scores or the ranking of the options (for example, by the saturation of colour) and change dynamically in parallel with changes in the plot.
Figure 5. The axes in the parallel coordinate plot are transformed to reflect the directionality and weights of the criteria. The plot is dynamically linked to the map by means of simultaneous highlighting of the same options.
3.3. Other tools for individual decision making In the particular case of the Wallis decision problem there is much information about the options on the Web. This information can be taken into account in making a decision about the choice of a location. To enable a convenient user access to the relevant URLs, we have implemented a tool that opens the URLs when a user double-clicks at the locations of options on the map. A tool for defining new attributes was also added to the system. The user needs to specify the name and the type of a new attribute (the type may be string, numeric, or logical) and to assign attribute values to the decision option. The user may specify a default value that will be automatically attached to those options that were not assigned values explicitly. For example, a non-skier who wished to take into account
Building Spatial Decision Support Tools 11
the presence of thermal pools in the resorts would define an attribute with values 1 for “yes”, -1 for “no”, and 0 for “unknown”. The value 0 would be declared as the default. Then the user would assign values 1 and –1 to these resorts for which reliable information about the presence or absence of thermal pools was available. Note that the decision support methods we deal with require values of criteria to be expressed by numbers. In the course of the first Wallis experiment we saw that it was important to allow the users to modify the ranking or classification of options resulting from computational decision support methods before the ranking or classification would be submitted as a vote. Such direct possibility of changing the ranking/classification results could accommodate users’ implicit preferences. Therefore we designed and implemented a tool for manual reordering and (re)classification of decision options. The tool appears when the user presses the button “Make decision” in the dialog for the “ideal point” evaluation or in the control panel for the “utility symbols” visualization. The user gets a list of the options ordered according to the scores received in the “ideal point” method or to the areas of the symbols, respectively. The tool allows the user to move any option to any place on the list and to divide the options into classes according to their estimated utility. While the number of classes must correspond to the adopted voting rules, the user may decide how many options to include in each class. When the user finishes ordering or classification of the options, the result is added as a new attribute to table containing the data about the options.
3.4. Tools to support voting and analysis of votes To support cooperative decision making, we implemented the system as a Web applet capable of storing individual decisions of the participants (i.e. their votes) on a Web server. Each participant can start the system on his or her Internet-connected computer by just loading the page with the applet. When the decision is made, the applet sends it to a special script on the server. The input of the script consists of a sequence of lines containing the identifiers of the options and the rankings or a classification of options. The script creates a file on the server with the name composed of the IP address of the computer from which the vote came and the current date and time. The data received from the applet are written into the file. We also developed a tool that automatically integrates in a table the individual votes sent to the server,. The table contains one column per each participant. When a participant changes his or her opinion and sends another vote, the tool automatically replaces the old entry in the table with the new entry. The resulting table with the votes has the comma-separated value format (supported by Excel) and can be loaded into the CommonGIS system for analysis. The leader or mediator of the decision making process may use the facilities of the system to compute the average vote for each option and the variance of the votes. If
the voting was done in the form of classification, the system can count the occurrences of the classes for each option (for example, option X was ascribed 5 times to class “A”, 7 times to class “B”, and one participant classified it as “C”). CommonGIS allows the mediator to store the results of calculations in a separate table that can be made available to the decision makers. The mediator may choose whether to allow the access by the participants to the individual voting data as well. We have designed a special visualization technique to represent cumulative voting results on a map, specifically, average votes and variances. Triangle-shaped signs are used for this purpose with the heights of the triangles representing the average votes and the widths - the variances (Figure 6). With such a representation tall narrow triangles mark the most promising options, from the perspective of arriving to a consensus.
Figure 6. Average votes are shown by the heights of the triangles and variances by widths. Another useful analysis tool for a mediator of a decision process is the interactive scatter plot. The analyst can easily find on the scatter plot the dots corresponding to options with high average scores and low variances. Selection of the dots with the mouse highlights these options on the map. For excluding unpromising options, i.e. those with low scores or high variances, the mediator can apply the “dynamic query” tool. It allows the user to interactively set and dynamically change constraints on values of attributes and immediately see on a graphical display (in particulars, on a map) what objects satisfy the constraints. Objects that do not satisfy the constraints are removed from the view.
4. The second and third Wallis experiment: testing of the tools
Building Spatial Decision Support Tools 13
The second Wallis experiment was conducted in June 2001 with the participation of 10 persons. Only one member of the group that participated earlier in the first Wallis experiment did not participate in the second experiment. One of the purposes of the experiment was to test the decision support tool suite available in the system CommonGIS, in particular, those developed after the first experiment. The experiment also involved the system Zeno (http://zeno.gmd.de/MS/) supporting mediated discussions over the Web. To make the decision problem more “serious”, the participants were asked to take on the roles of constructors of skiing robots who had to select a good place for a competition between different models of the robots. Unlike the first Wallis experiment, the second one was more focused on exploring the process of discussion and consensus building. The decision tool developers observed the discussion and guided the participants in the selection and use of appropriate tools for the task at hand. They also collected the votes and helped the mediator and participants to analyse them. The following tools and techniques of CommonGIS were used in the experiment: 1) 2) 3) 4) 5) 6) 7) 8)
Access through the map to URLs with information about the resorts; Definition of additional attributes; “Dynamic query” for removal of inappropriate options; “Ideal point” and “Utility bars” for individual exploration of the decision space and ranking the options; Manual re-classification of the options for taking into account implicit preferences; Automated submission of votes and integration of them in a common table; Calculation of the average votes and variances and their visualization using triangles; Representation of individual votes by bar charts.
After the experiment the participants were given exit questionnaires to evaluate the tools used and to check participants’ understanding of the tools. The general evaluation of the tools by the participants was rather positive while some suggestions for improvement of the user interface were given. The subjective estimation of the participant understanding of the functions and the user interface varied from 3 to 6 points on a 7-point scale with the mean of 4.9. The average estimation of the ease of use was 5.8 and the effectiveness of the system was estimated as 6.0. It should be pointed out that the subjects did not get previous training in the use of the system. For the evaluation of the understanding of the tools the participants were given 10 tasks requiring the use of different tools. In each task the participants were asked to interpret a screenshot demonstrating the work of some tool and answer a question concerning the meaning of the picture.
The answers to the questions showed us that all the subjects understood well the representation of criteria directionality (benefit or cost) and weights. They correctly interpreted and used the parallel coordinate plot with transformed axes. At the same time there were problems with “utility symbols” and the representation of ranking of the options. With respect to the “utility symbols”, two persons did not understand the operation of focusing, one person failed to relate the widths of the bars to the weights of the criteria, and one person had problems with interpreting results of the visual comparison operation. Much worse was the situation with the representation of option ranking on the map. Ranking is the output of the “ideal point” method. It is expressed as an attribute with integer values from 1 up to the number of options, where 1 means the top, i.e. best rank. CommonGIS treats it as an ordinary integer attribute and visualizes its values using techniques usually applied for numeric attributes, for example, proportional degrees of darkness or standalone bars. As a result, darker (more intensive) shades or higher bars correspond to lower rankings (bigger attribute values). This representation of rankings turned out to be ineffective: 6 of 10 participants were confused by such representations. This means that the developers must take a closer look at ranking and develop more effective representation techniques for them. The participants were also asked about their preferences concerning the computation-based “ideal point” method and the visual technique of “utility bars”. It is interesting that each technique received exactly the same number of proponents, i.e. the ratio was 5 to 5. The arguments of those who preferred the “ideal point” method were the following: − − − −
it gives more information or organizes the information in a better way (remember that the “ideal point” method was combined with the visualization on parallel coordinates); it is more precise; it combines a lot of information in a single value; it is easier to understand. For comparison, here are the arguments of the proponents of the “utility bars”:
− − −
they are more intuitive while the “ideal point” is difficult to understand; they are better for the comparison of attribute values; they give more detailed visualization of the information.
It is notable that both groups stressed “better information” and “better understanding” in their evaluations. Our conclusion from this is that a good decision support system must have a range of tools to accommodate different user profiles and styles of decision making. Seven of ten participants utilized a tool for manual reordering of the options. A comment of one of the participants was: “It is great that the tools only make
Building Spatial Decision Support Tools 15
suggestions that can then be easily modified!” The participants who used the tool found it quite convenient : the average evaluation was 5.85 points out of 7. Among those who did not use the tool one person commented that in this particular case there was no need to modify the ranking suggested by the system, although such an opportunity was in general useful. However, one of the participants admitted that he was unaware of this opportunity. Possibly, there is a need to make this feature more prominent in the user interface. A notable difference between the second experiment and the first one was the necessity to take into account constraints, or “hard criteria”, as the participants called them. This seemed to be an implication of the more “serious” character of the decision problem. The participants were so focused on their roles of robot constructors that everybody had a clear vision of the technical characteristics of his or her creation. Some of these characteristics required special conditions that were not present at all sites. The absence of such conditions could not be compensated by good characteristics of the sites in other respects, therefore the participants referred to such strict requirements as “hard criteria”. In the discussion about the criteria the participants decided that the group should consider only the sites with suitable conditions for all the robots. The “dynamic query” tool allowed the participants to remove the unsuitable sites from consideration. As a result, only 4 feasible options remained available for voting. With such a small number of options some of the methods of analysis of votes we applied in the first experiment (e.g. calculation and representation of average votes and variances) were superfluous. All the important information was well visible from a “simple” map with a bar chart for each of the 4 options representing individual votes. A subsequent use of the software and the experimental scenario was conducted with a group of 20 students at the University of Idaho, USA. This follow-up exercise resulted in an interesting suggestion for additional software functionality. Students ranged from advanced undergraduates to graduates and represented a variety of majors including geography, engineering and environmental science. They almost uniformly suggested a need for a tool that would help them elicit a value-objectivecriteria hierarchy. Such a hierarchy, if determined by the group, would allow proceeding with ‘important’ criteria, meaning the criteria that truly reflected the fundamental values (e.g. environmental preservation, economic welfare, etc.) of the group members, the value-resulting objectives, and criteria measuring the achievement of objectives.
5. Conclusions In order to support spatial decision making by individuals and groups with appropriate software tools, we have conducted a series of experiments. In these experiments the participants were engaged in a role-playing on asked to collectively
select suitable locations. Observations made in the first experiment guided the design of the tools. The subsequent experiments allowed the tool developers to test and evaluate the tools. The tests confirmed the soundness of the tools. At the same time the developers received many useful suggestions for further improvement and advancement of the tools. From our viewpoint, the most important observation concerns the existence of different styles of decision making that require distinct support tools. The necessity to meet the needs of users who feel uncomfortable with computation-based techniques prompted us to design a technique based on visualization (“utility symbols”). The new technique was effectively used in the tests and was positively evaluated by the participants. We consider the availability of different alternative decision support tools in our system as a significant advantage. In the future we plan to continue the development of decision support tools, e.g. the inclusion of value-objective-criteria hierarchies. We shall also move in the direction of closer integration with groupware systems such as Zeno that support discussions and consensus building.
Acknowledgements We are grateful to Ms. Sabine Mull and Mr. Felix Kollbach for collecting and compiling the data about skiing resorts in Wallis that were used in our experiments. Participants of the experiment are acknowledged for donating their time and their efforts in providing valuable comments and suggestions. The work was partly funded by BMBF in project KogiPlan (reference number VFG0003B, 1.10.2000-31.3.2003)
Bibliography/References AHLBERG C., WILLIAMSON C., SHNEIDERMAN B. “Dynamic queries for information exploration: an implementation and evaluation”, Proceedings ACM CHI’92, ACM Press, 1992, p. 619-626. ANDRIENKO G., ANDRIENKO N., “Interactive Maps for Visual Data Exploration”, International Journal of Geographical Information Science, vol. 13 no. 4, 1999, p.355374. INSELBERG A., “Visual Data Mining with Parallel Coordinates”, Computational Statistics, vol. 13 no. 1, 1998, p.47-63. JANKOWSKI P., ANDRIENKO N., and ANDRIENKO G., “Map-Centered Exploratory Approach to Multiple Criteria Spatial Decision Making”, International Journal Geographical Information Science, vol. 15 no. 2, 2001, p.101-127.
Building Spatial Decision Support Tools 17 MALCZEWSKI J., GIS and Multicriteria Decision Analysis. New York, John Wiley & Sons,1999 Thill, J-C (Ed.), “GIS and Multiple Criteria Decision Making: A Geographic Information Science Perspective, London: Ashgate, 1999 ZENO: Groupware for Discourses on the Internet, http://zeno.gmd.de/MS/