Yafei Yang, Yan Lindsay Sun, Jin Ren, and Qing Yang. Department of Electrical and Computer Engineering. University of Rhode Island, Kingston, RI 02881.
1
Building Trust in Online Rating Systems Through Signal Modeling Yafei Yang, Yan Lindsay Sun, Jin Ren, and Qing Yang Department of Electrical and Computer Engineering University of Rhode Island, Kingston, RI 02881 Emails: {yafei,yansun, rjin, qyang}@ele.uri.edu Abstract— Online feedback-based rating systems are gaining popularity. Dealing with unfair ratings in such systems has been recognized as an important but difficult problem. This problem is challenging especially when the number of regular ratings is relatively small and the unfair ratings contribute to a significant portion of the overall ratings. In this paper, we propose a novel algorithm to detect the unfair ratings that cannot be effectively prevented by existing state-of-the-art techniques. Our algorithm is particularly effective to detect malicious raters that collaboratively manipulate ratings of one or several products. The main idea of our algorithm is to use an autoregressive signal modeling technique combined with trust-enhanced rating aggregation. We are able to detect and filter out unfair ratings very accurately. Extensive experiments through simulations and real-world data have been performed to validate the proposed algorithm. The experimental results show significant improvements on detecting collaborative unfair raters over existing techniques. Index Terms— Ratings aggregation, Trust and reputation management, Signal modeling
I. Introduction The Internet, the revolutionary mass communication media, has enabled individuals to make their personal opinions accessible to the global community at almost no cost [1]. This results in various on-line opinion forums and rating systems, such as Epinions and Amazon product rating, which allow users to submit their opinions regarding products, services or other users. The submitted opinions are analyzed, aggregated, and made publicly available. Today’s consumers’ purchasing decisions are more and more relying on the rich, valuable and timely information from on-line forums and rating systems. Ensuring the reliability of these systems is an important and challenging task [2]. The existence of unfair ratings, which can be generated either intentionally or unintentionally, is a key factor that undermines the reliability of online rating systems. There have been many approaches proposed to deal with unfair ratings. Examples include clustering techniques [3], statistical analysis [4], endorsementbased quality estimation [2], trust establishment [2], [5], and entropy-based detection [6]. The details of these approaches will be reviewed in Section II. The existing systems share one common property: majority rule. That is, the number of unfair ratings should be much less than the number of good ratings. This rule usually holds when a large number of users rate a limited number of products or services. However, in practice, there are many scenarios where the number of ratings is limited. This occurs when the products or services are new or not as popular. This also occurs when rating aggregation is performed over the ratings in a small time window, in order to catch the dynamic behavior of the object being rated. At Amazon and Epinion, it is very common that a product only has a few reviews/ratings and even fewer recent reviews/ratings. In these scenarios, dealing with unfair ratings is very difficult due
to three reasons. First, there is not a sufficient number of ratings to draw statistical conclusions. Most existing methods do not work well when the number of ratings is small. Second, the number of unfair ratings may overweight the number of fair ratings during a time interval or for an unpopular object. This could undermine the foundation of most existing algorithms. Third and more importantly, owners of objects to be rated may influence raters for commercial purpose, which results in collaborative unfair raters jointly manipulate ratings for one or several objects. Collaborative unfair ratings can cause severe damage to the trustworthiness of the rating system. Existing systems are not effective to handle a large number of collaborative unfair ratings. Our study on existing methods indicates that temporal information, the time when the ratings are provided, is not investigated in depth. Most existing methods treat the ratings as samples of a random variable. In fact, the ratings, which are naturally provided at different time points, are samples of a random process [7]. This provides another dimension for detecting unfair ratings. We treat fair ratings as noise and unfair ratings as signal. We model the overall ratings using an autoregressive (AR) signal modeling technique and examine the model errors. The model error can be a good indicator of whether the ‘signal’ (unfair ratings) is present. Additionaly, trust models can assist in producing reliable ratings. There are many trust models reported in the literature applied to authorization, access control, ad hoc sensor networks, and so forth. Directly applying a trust model to rating aggregation may not produce desirable results. For example, the trust model reported in [8] outperforms other trust models in the application of securing ad hoc routing protocols. However, it is the worst for rating aggregation among the trust models that we look at. Through experiments, we are able to come up with a modified trust model that performs very well in handling rating aggregation. In this paper, we make the following contributions: • developing a framework that integrates trust establishment and rating aggregation; • identifying different types of unfair ratings in online rating systems; • designing an algorithm to detect suspicious ratings in the scenarios that the majority rule does not always hold; • developing trust-based rating aggregation algorithms that improve reliability. The proposed algorithms and systems are applied to both simulated data and real data. Extensive simulations are performed to validate the proposed methods. The rest of the paper is organized as follows. Background and related work are discussed in Section II. The proposed algorithms and systems are presented in Section III. Section IV presents system implementation and simulation results, followed by the conclusions in Section V.
2
II. Background and Related Work A. Related Research The proposed system in this paper contains two key elements: unfair rating filtering and trust or reputation establishment. Unfair rating filtering examines the ratings that are far away from the majority’s opinion and are identified as abnormal to be removed. Abnormal ratings can be determined by examining different rating properties, such as statistical distribution, entropy, and endorsement from other raters. The study in [3] is carried out from both technology and business management points of view. Four unfair rating scenarios in online trading communities, such as eBay, are identified. The proposed solution consists of two parts. The first part is concealing the identities of the buyers and sellers. The second part is a clustering technique used to divide ratings, which are from the users with similar taste, into two clusters. One cluster contains fair ratings and the other contains unfair ratings. In [2], a defense mechanism against unfair ratings is proposed. The basic idea is to evaluate the quality of individual ratings and/or reviews. This is achieved by an endorsement method. In particular, a rater gives the highest endorsement to other raters who provide similar ratings and lower endorsement to the raters who provide different ratings. The quality of a rating is the summation of the endorsements from all other raters. The unfair ratings are expected to have low quality values, and the raters who give unfair ratings are expected to have low reputation. In [4], Whitby et al. presented a statistical filtering technique in Beta-function based rating systems. The ratings that are outside the q quantile and (1 − q) quantile of the majority opinion are identified as unfair ratings, where q is a parameter describing the sensitivity of the algorithm. Recently, in [5] Weng et al. proposed an entropy-based method to measure the quality of ratings. If a new rating leads to a significant change in the uncertainty in the distribution of the rating, this rating is considered to be an unfair rating. The uncertainty is measured by entropy. The second key element is trust establishment, through which a reputation or trust value is developed to describe the quality of a rater. When the system knows how trustworthy a rater is, the system can assign low weight to the ratings from the raters with low trust, and large weight to the ratings from the ones with high trust. This would reduce the influence of the untrustworthy raters upon the system. In addition, the raters with very low trust values can be declared as dishonest and removed from the system. In the design of trust establishment system for rating aggregation, at least two basic questions need to be considered: (1) how to determine the trustworthiness of the raters and (2) how to aggregate ratings from the raters with different trust values. There has been a rich literature on trust establishment and reputation systems. There are systems designed especially for rating systems [2], [9], [10], and systems designed for authorization and access control [11]–[15], electronics commerce [16], peer-to-peer networks [17]–[19], ad hoc and sensor networks [20]–[23], and pervasive computing [24], [25]. In this work, we compare several existing trust establishment methods, and modify an existing method to make it suitable for rating aggregation. B. Classification of Unfair Raters In [3], Dellarocas summarized four types of unfair ratings in the on-line trading environments where sellers and buyers rate each
other. Inspired by their models, we classify the unfair ratings in on-line rating environment, where raters provide an opinion about certain object such as a book, a product, or a restaurant, into following categories. • Individual unfair ratings: an individual rater provides unfairly high or low ratings without collaborating with other raters. This type of rating may result from raters’ personality/habit (i.e. dispositional trust [26]), careless, or randomness in rating behavior. • Collaborative unfair ratings: a group of raters providing unfairly high or low ratings to boost or downgrade the overall rating of an object. This type of rating may result from the strategic manipulation from the owner of the object [27]. The owner of the object, such as the publisher of a book or the manager of a restaurant, can hire or influent raters in order to praise their products or criticize the competitors’ products. Compared with collaborative unfair ratings, individual unfair ratings usually cause much less damage. First, individual high ratings and individual low ratings can cancel each other. Second, the number of individual unfair ratings should statistically be much less than the number of normal ratings. Therefore, our focus is to address collaborative unfair ratings. The collaborative unfair raters can have two strategies: (1) providing ratings with a large bias; (2) providing rating with a moderate bias. Consider the following example. Assume that the rating has 5 levels: 1, 2, 3, 4, and 5. The rating aggregation algorithm is assumed to be simple averaging. Suppose the true quality of a particular object is 3 and there are N honest raters. Suppose we have M collaborative raters whose goal is to boost the aggregate rating to 3.5. To achieve this goal, the following condition should be satisfied: 3N + rM > 3.5 (1) M +N 0.5 From (1), one can see that M > r−3.5 N . In the first strategy, collaborative raters should provide the highest rating, i.e. 5. Then, as long as M > N/3, they achieve their goal. In the second strategy, collaborative raters should provide rating 4. In this case, their goal can be achieved when M > N . From the detection points of view, many existing schemes, such as the ones in [2]–[4], can be used to defend against the first strategy, when M is not too large. The challenge is to detect the collaborative attackers using the second strategy and the cases where M is comparable or larger than N .
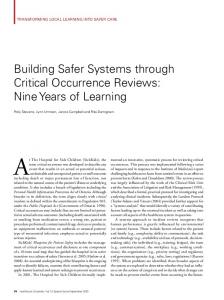
III. Trust-enhanced Rating Aggregation System Our trust-enhanced rating system consists of two main parts: rating aggregator and trust manager, as shown in Figure 1. The rating aggregator employs our novel signal modeling technique and the trust manager uses a modified trust establishment framework [8]. A. Rating Aggregator The rating aggregator takes raw ratings as well as trust in raters as inputs, produces aggregated rating, and provides information to the observation buffer in the trust manager. • The first feature extraction module examines the raw ratings and works with the rating filter to filter normal ratings from abnormal ratings. The fact that a certain rating is discarded
3 Raters’ Option on other raters
Raw Rating
Feature Extraction I
Observation Buffer
Recom. Buffer
Trust Establishment
Rating Filter
Abnormal Rating
normal Rating
Feature Extraction II
Direct Trust Establishment
Indirect Trust Establishment
Trust Record Direct
Indirect
Rater 1
Rating Aggregation Rating Aggregator Aggregated Rating
Fig. 1.
•
•
Rater 2 ………
Malicious Rater Detection
Trust Manager
Record Maintenance Initialization Update according to time
Block diagram of the trust-enhanced rating aggregation system.
is stored in the observation buffer. This information will be used to calculate trust in raters by the trust manager. The second feature extraction module examines normal ratings and extract information that can be used to determine trust in raters. We use our signal modeling technique to determine suspicious ratings, which will be fed into the trust manager. The aggregated rating is generated by the rating aggregation module, which aggregates ratings based on normal ratings as well as the trust in raters.
A.1. Detecting suspicious ratings through AR signal modeling The first major innovation of our design is to use signal modeling technique in feature extraction module II . The underlying philosophy is as follows. • A single rating is often looked at as a sample of a random variable. When we examine multiple ratings that are naturally given at different time points, these ratings are in fact samples of a discrete random process x(t). In particular, the system receives the ratings R = {r1 (t1 ), r2 (t2 ), · · · .rm (tm )}, where ri (ti ) denotes the rating received at time ti with rating value ri . These ratings, R, is one sample of a random process x(t). • When there is no collaborative raters, ratings received at different time should be independent. Thus, (x(t)−E(x(t))) should approximately be white noise. • When there are collaborative raters, (x(t) − E(x(t))) is not white noise any more. Instead, the ratings from collaborative raters can be looked at as the signal embedded in the white noise. Based upon above observations, we developed the core idea for detecting collaborative ratings as follows. • We try to model the ratings, R, using an autoaggregation (AR) signal model and examine the model error. If the model error is high, x(t) is close to a white noise and the probability that there are collaborative raters is small. If the model error is low, there are ’signal’ presented in x(t) and the probability that there are collaborative raters is high. To implement this idea, the overall time during which ratings are provided is divided into windows. The windows either cover
equal length time intervals or contain the same number of ratings. These windows can overlap. Then, the ratings in each window are modeled using the covariance method [7], and the model error is calculated. (The covariance method is a standard method for spectrum estimation. The details of this method can be found in the Matlab function covm). If the model error is smaller than a threshold, this window is marked as suspicious. The suspicious value of the raters who provide ratings in the suspicious window are updated. Let C(i) denote the suspicious value of rater i. The suspicious values will be used to calculate trust in raters. The detailed algorithm is described in Procedure 1 for W windows. In this procedure, only the ratings from one object is examined. It is straightforward to extend it to handle multiple objects by initializing the suspicious value C(i) as 0 at the beginning and running procedure 1 for each object. Procedure 1 Detecting suspicious interval and updating raters’ suspicious values 1: For each rater i, initialize Llatest =0 i 2: for k = 1 : W do 3: let R denote the ratings for a certain object in the kth window. 4: find the all-pole model of the signal R using the covariance
5: 6: 7:
8: 9: 10: 11: 12: 13: 14: 15: 16: 17: 18: 19:
method [7]. In particular, given the model order p, calculate the model coefficients a = [1, a(1), ...a(p)] and normalized model error e(k) (0 < e(k) < 1). if e(k) < threshold then The kth window is marked as the suspicious ˙ − A suspicious level is calculated as L(k) = scale(1 e(k))/threshold, where scale is scaling factor between 0 and 1. for each rating in the kth window. do assume this rating is from rater j if Llatest = 0 then j Ci = Ci + L(k); Llatest = L(k); j else if Llatest > L(k) then j Ci = Ci + L(k) − Llatest , Llatest = L(k); j j end if end if end for end if end for
A.2. An illustrative example A simple experiment can show how the AR signal modeling works effectively. In this experiment, we examine the ratings for one object. The honest ratings are generated based on the following parameters. simu time = 60 arrival rate = 3 R level = 11 quality start = 0.7 quality end = 0.8 goodV ar = 0.2
simulation time is 60 days rating arrival is a Poisson process with arrival rate 3 ratings which have 11 levels can be 0, 0.1, 0.2, · · ·, or 1 The quality of the object is 0.7 at the beginning and linearly increases to 0.8 at the end of the experiment. The ratings from honest raters follow a Gaussian distribution with mean being the quality of the object and variance being 0.2.
Assume that the collaborative raters are recruited by the owner of the object. The owner has two ways to do it. First, he/she can influence the raters who are supposed to provide ratings. In particular, rater i originally wants to give rating value ri at time ti . If rater i is affected by the owner of the object, rater i will
4
Ratings without collaborative raters
Histgram of ratings(without collaobrative rater) # of such rating
0.8 0.6 0.4 0.2 0
Rating scores
60
0
10
20
40
20
0
30
40 50 60 70 80 time (day) Ratings with collaborative raters(red: type 1, green: type 2)
1
100
0.8
80
# of such rating
rating scores
1
0.6 0.4 0.2 0
0
10
20
30
40 50 time (day)
60
70
0
0.2
0.4 0.6 0.8 rating score Histgram of ratings (with collaobrative rater)
0
0.2
1
60 40 20 0
80
Fig. 2. Raw ratings before filtering (Yafei, change the figure, only keep the lower plot. Using symbols as described !!!!
0.4 0.6 rating score
Fig. 3.
0.8
1
Histogram of ratings
Mean of ratings (20 ratings in each window)
A start = 30 A end = 44 biasshif t1 = 0.2 recruitpower1 = 0.3 biasshif t2 = 0.15 badV ar = 0.02 recruitpower2 = 1
The unfair ratings arrive between day 30 and day 44 during the attack interval, 30% raters increase their original ratings by 0.2 type 2 collaborative ratings, whose arrival rate is 3, follow a Gaussian distribution with variance 0.02, and mean = object quality + 0.15.
Figure 2 shows one example of raw ratings generated using above parameters. The plot contains ratings from honest raters (black dots), type 1 collaborative raters (red ∗), and type 2 collaborative raters (blue +). Figure 3 shows the histogram of the ratings. One can see that the information presented in the histogram is not sufficient to differentiate honest and collaborative ratings. There are two reasons. First, the number of ratings is not sufficiently large, which occurs in most practical applications. Second, the collaborative raters use a smart strategy that their ratings are not very far away from the majority. Figure 4 shows the effects of rating filtering and the detection of suspicious intervals. In this figure, the upper plot shows the moving average performed upon (1) honest ratings, (2) all ratings from both honest and collaborative raters; and (3) ratings passing through the rating filter. Each window for calculating the moving average contains 20 ratings. The step size for windows is 10 ratings. From this figure, two observations are made. First, the collaborative raters can greatly raise the aggregated rating, if the
0.8 0.7 without CR with CR with CR & beta filter
0.6 0.5
0
10
20
30
40 50 60 70 time (day) AR model error (50 ratings in each window
80
90
80
90
0.04 AR model error
provide rating ri + biasshif t1 at time ti . We assume that the owner of the object can make recruitpower1 percent of regular raters to be this type of collaborative raters, referred to as the type 1. Thus, two parameters: biasshif t1 and recruitpower1, can describe type 1 collaborative raters. The second way is to ask the raters who originally would not provide ratings to provide biased ratings to the object. These raters are referred to as type 2 collaborative raters. It is assumed that type 2 collaborative raters will provide ratings that follow a Gaussian distribution with mean badM ean and variance badV ar. Here, badM ean equals to the quality of the object plus biasshif t2 . Type 2 collaborative raters arrive following a Poisson process with the average arrival rate being (arrival rate· recruitpower2). Thus, three parameters: biasshif t2 , badV ar, and recruitpower2, can describe type 2 collaborative raters. We generate unfair ratings using the following parameters.
mean of ratings
0.9
without CR with CR 0.03
0.02
0.01
0
10
Fig. 4.
20
30
40 50 time (day)
60
70
Average of the ratings and the model error
aggregation method is simple averaging. (2) the beta-function based filtering technique is not very effective because most collaborative ratings are not far away from the majority opinion. The lower plot in Figure 4 shows the model error calculated using Procedure 1. The black curve is the model error when there are only honest ratings, the magenta curve is the model error when collaborative ratings are present. It can be seen that the model error drops significantly when there are collaborative ratings. The proposed method with a proper threshold detects the suspicious intervals. To investigate the detection rate and false alarm rate, we perform the experiment for 500 times and obtain Detection Ratio = 0.782; False Alarm Ratio = 0.06. Besides working on simulated data, we applied the proposed methods to real movie rating data provided by Netflix [28]. The first movie in the dataset, Dinosaur Planet, is selected. We inserted collaborative unfair ratings using the following parameters: A start = 212, A end = 272, biasshif t1 = 0.2, recruitpower1 = 0.5, biasshif t2 = 0.25, recruitpower2 =1, and badV ar = 0.25 · goodV ar, where goodV ar is the variance of the original ratings. Figure 5 shows the model error generated by the proposed algorithm when applying it to the original data and the original data with simulated collaborative ratings, respectively. It can be seen that the model error drops significantly during the time when the collaborative unfair ratings are present. This experiment validates again the effectiveness of our algorithm.
5
Applying Signal Modeling Techniquest to Real Movie Rating data 0.1
raw movie rating data from Netflix raw data + simulated collaborative ratings
0.09 AR model error
0.08 0.07 0.06 0.05 0.04 0.03 0.02
0
100
200
300 400 time (day)
500
600
700
Fig. 5. Model errors for original data and data with collaborative ratings. (Dinosaur Planet, 2003.)
B. Trust Manager Trust establishment can be a complicated process. Before discussing the detailed design of the trust manager, we briefly introduce some fundamental concepts in trust establishment. A trust relationship is always established between two parties for a specific action. That is, one party trusts the other party to perform an action. The first party is referred to as the subject and the second party as the agent. A notation {subject : agent, action} is used to represent the trust relationship [29]. For each trust relationship, one or multiple numerical values, referred to as trust values, describe the level of trustworthiness. There are two common ways to establish trust in computer networks. First, when the subject can directly observe the agent’s behavior, direct trust can be established. Second, when the subject receives recommendations from other entities about the agent, indirect trust can be established. A very special type of direct trust is recommendation trust. It is for trust relationship {subject : agent, making correct recommendations}. Recommendation trust is important for establishing indirect trust. Trust can transit through third parties. For example, if A and B have established a recommendation trust relationship and B and C have established a direct trust relationship, then A can trust C to a certain degree if B tells A its trust opinion (i.e. recommendation) about C. This phenomenon is called trust propagation. Indirect trust is established through trust propagations. The rules that govern trust propagation are often called trust models. Next, we map these basic concepts to the problem of rating aggregation. In the context of rating aggregation, we care about three types of trust relationships: • {rater : object, having a certain quality}. The trust value of this trust relationship is just the rater’s rating. It is often assumed that a rater’s rating is based on his/her direct experiences. Thus, this is a direct trust. • {system : rater, providing fair rating}. The trust value of this trust relationship is just the trust in rater, defined earlier in the paper. This is a recommendation trust. • {system : object, having a certain quality}. The trust value of this relationship is the aggregated rating. This is an indirect trust because the system does not have direct experience of the object. Indirect trust can be calculated from the direct trust and recommendation trust using trust models. Thus, aggregated rating can be calculated from raters’ ratings and trust in raters using similar trust models. The most important observation is that the calculation in rating aggregation can be determined or inspired by existing trust models. Based on this observation, we design the trust manager by simplifying the generic framework for trust establishment proposed
in [29]. This trust manager contains several building blocks, as illustrated in Figure 1. • Observation Buffer collects observations on whether the ratings from specific raters are filtered out or have certain features. The observations are used to calculate direct trust values associated with {system : rater, providing fair rating} by the Direct Trust Establishment module. • Some practical online rating and review systems allow a rater to comment on whether others’ ratings/reviews are useful. When this type of information is available, it is stored in the Recommendation Buffer and can be used to calculate indirect trust values associated with {system : rater, providing fair rating}, by the Indirect Trust Establishment module. • Trust Record stores information about trust in raters. • Malicious Rater Detection module determines how to handle the raters with low trust values. • An honest rater may become compromised or an incapable rater may become capable after gaining some experiences. Thus, the observation collected long time ago should not carry the same weight as the observation collected recently. This problem is addressed by some forgetting schemes [8]. The Record Maintenance module handles the forgetting scheme as well as the initialization of rater’s trust. B.1. Design challenges In the beta-function-based trust establishment method proposed S+1 in [30], trust value is calculated as S+F +2 , where S denotes the number of previous successful actions and F denotes the number of previous failed actions. This method has been used in various application scenarios [8], [29], [31]. For rating aggregation, however, it is difficult to determine S and F values. Assume that we are examining the trust in rater i. In this case, S should be the number of honest ratings provided by i, and F should be the number of dishonest ratings provided by i. If a rating from i is filtered out by the rating filter, this rating can be classified as a dishonest rating. However, a rating that passed the rating filter is not necessarily an honest rating. A smart and biased rater can provide ratings that are not too far away from the majority. This type of ratings cannot be filtered out unless the system can tolerate a very high false alarm ratio. This type of ratings is difficult to identify. That is, the system cannot perfectly monitoring rater i’s past behavior, and must estimate S and F values through, for example, the second feature extraction module. The first challenge is to design the feature extraction module II. This module analyzes the ratings that have passed the rating filter, and generates features that can be used to estimate S and F values for specific raters. In the design of this module, one must consider the fact that the ratings often have a few levels and the number of ratings can be limit. Our signal modeling method solves this problem effectively. The second challenge is to determine the algorithm for rating aggregation. As discussed previously, the rating aggregation module can use trust models to calculate the aggregated rating. However, there are many trust models available. It is important to choose or design a trust model that is suitable for rating aggregation. This is our next task to be discussed below. B.2. Comparison of different rating aggregations In order to find a good trust model for the rating aggregation, we present the algorithms for calculating trust in raters and then compare several existing trust models through a case study.
6
Trust in raters can be established using the beta-function model. The calculation is described in Procedure 2. In this procedure, trust in raters is updated at time t(1), t(2), · · · , t(K). A parameter b(0 < b < 1) is used to control the relative badness between a rating that is filtered out and a rating that is in the suspicious interval. Procedure 2 Computing Trust in Raters 1: For each rater i, initialize Si = 0, and Fi = 0 2: for k = 1 : K do 3: for each rater i do 4: Set si = ni = fi = Ci = 0, 5: During the time t(k − 1) and
t(k), determine: the number of ratings that is provided by rater i the number of ratings from rater i which are filtered out by the rating filter si : the number of ratings from rater i which lies in at least one suspicious interval. Ci : the suspicious value of i (see procedure 1) calculate Fi = Fi + fi + b · Ci and Si = Si + ni − fi − si . calculate trust in rater i at time t(k) as: (S + 1)/(S + F + 2). end for end for ni : fi :
6: 7: 8: 9:
Let R denote the raters whose ratings are the input to the rating aggregation module. If rater i belongs to R, let ri denote the rating from rater i, Ti denote the trust in raters. Rag denotes the aggregated rating, and |R| denotes the number of ratings. Here, each rater provides only one rating. Four rating aggregation algorithms are compared. P 1 1. simple average: Rag = |R| i:i∈R ri . 2. beta function aggregation proposed in [30]: S0 + 1 , S0 + F 0 + 2 P P where S 0 = i:i∈R ri and F 0 = i:i∈R (1 − ri ). 3. modified weighted average : X 1 Rag = P max(Ti − 0.5, 0) · ri i:i∈R max(Ti − 0.5, 0) Rag =
i:i∈R
4. beta-function trust model proposed in [8]. The detailed equations can be found in equation (14) (22) and (23) in [8]. Method 3 differs from traditional weighted average. First, if a trust value of a rater is lower than 0.5, the rating from this rater is not considered. Second, the weight is calculated based (Ti −0.5), not the absolute trust value. The trust value 0.5 represents the neutral opinion, i,e, no trust and no distrust. The above algorithms are compared in the following simulation setup. The trust values of honest raters are generated using a Gaussian distribution with mean 0.95 and variance 0.05. The trust values of collaborative raters are generated using a Gaussian distribution with mean 0.6 and variance 0.1. The number of ratings provided previously by each rater is uniformly distributed in [1, 20]. The ratings from honest raters follow a Gaussian distribution with mean 0.8 and variance 0.05. The ratings from the collaborative ratings follow a Gaussian distribution with mean 0.4 and variance 0.02. Here, the goal of the collaborative raters is to reduce the aggregated rating. The ratio between honest and collaborative raters is 1:1; and there are 10 honest raters. No filtering technique is used. We run the experiment for 500 times and obtain the average aggregated ratings as:
Rag
Method 1 0.6365
Method 2 0.6138
Method 3 0.7445
Method 4 0.5985
The desired Rag is the mean of honest ratings, i.e 0.8. When using method 1 and method 2, the aggregated rating is significantly reduced. However, considering trust in raters does not necessarily leads to a good result. Trust model in [8] over perform other trust models in the context of securing ad hoc routing protocols. Among all four models that we studied in this paper, the modified weighted average (Method 3) has the best performance. With 50% of collaborative raters, Rag in Method 3 only dropped 7%. Method 3 is used in the remaining simulations in this paper. IV. System Implementation and Simulation We implemented a simulator in C++, Matlab and MySQL based on the approaches presented in Section III. This tool includes two parts: (1) rating generation and (2) trust-enhanced rating aggregation. As mentioned in Section III, the collaborative raters can have two strategies. Since large bias shift can be detected easily by some existing schemes, we focus on detecting attacks using their second and smart strategy, which is hard to detect in general. A. Simulation Setup The parameters used for generating ratings are as follows. The rating scores, which have 10 levels, can be 0.1, 0.2, · · ·, 1. There are total 800 raters. Among them, 400 are reliable raters, 200 are careless raters and 200 are potential collaborative unfair raters. Both reliable raters and careless raters are honest, and their ratings follow a Gaussian distribution with mean being the quality of the product. The variance of the ratings from reliable raters and that from the careless raters are denoted by goodV ar and carelessV ar, respectively. We choose goodV ar = 0.2, carelessV ar = 0.3 in our simulation. The potential collaborative (PC) raters can be recruited by the owner of dishonest objects. If a PC rater is not recruited, it behaves as a reliable rater. If it is recruited, it behaves as a type 2 collaborative rater, whose behavior is described by biasshif t2 and badV ar defined in the previous section. All raters participate in rating 60 products during 360 days (a year) with each product being just one object. The term object is used in the previous sections to represent the general concept. In this section, the term product is used to reflect more piratical application scenario. In each month (30 days), 4 honest products and 1 dishonest product receive ratings. The products rated in different months are different. The quality of the products is assumed to be uniformly distributed between 0.4 and 0.6. A dishonest product recruits collaborative raters in 10 days each month and it can recruit a total recruitpower3 percent of PC raters. In each day, the probability that a reliable or careless rater rates the products is Prate . One rater cannot rate more than once on each product. For a PC rater, if it is recruited, it will rate the products with probability (a1 · Prate ). If it is not recruited, it will rate the products with probability (a2 · Prate ), where, a1 (> 1) and a2 (< 1) are two scaling factors chosen in such a way that (a1 · Prate ) and (a2 · Prate ) are less than 1. For rating aggregation, the following parameters are used. Rating filtering technique in [4] is used with sensitivity parameter 0.1 in the feature extraction I module. The window for applying the filter is 30 days and the windows do not overlap. The window
7
Mean of Raters’ Trust
Raters’ Trust in the 12th Month
0.9
1
0.85
0.9
0.8
0.8
0.75
Trust value
Trust Value
0.7 0.7 Dishonest rater Reliable rater Careless rater
0.65 0.6
0.6 0.5
For honest raters, false alarm rate is 0
0.4
For careless raters, false alarm rate is 0
0.55 0.3
0.5
0.4
For collabrative raters, detection rate is 87%
0.2
0.45
0
2
4
6
8
10
0.1
12
0
100
200
300
Time (month)
Fig. 6.
400
500
600
700
800
Rater id
Mean of rater’s trust in 12 months.
Fig. 8.
Raters’ Trust in the 6th Month
Raters’ trust in the 12th month
Unfair Rating Detecting Capability of the New Algorithm
1
0.9
0.9
0.8
0.8
0.7
Detection ratio
Trust value
0.7 0.6 0.5 0.4
For honest raters, false alarm rate is 1%
0.3
For careless raters, false alram rate is 3%
0.2 0.1 0
0
100
200
300
400
500
0.6 0.5 Unfair rating detection Fair rating false alarm
0.4
0.3 0.2
For Collabrative raters, detecetion rate is 72% 600
700
0.1
0
800
0
2
4
Rater id
Fig. 7.
Raters’ trust in the 6th month
6
8
10
12
Time (month)
Fig. 9.
Unfair rating detection capability of the new algorithm
for applying AR model analysis in the feature extraction II module is 10 days, and adjacent windows overlap by 5 days. The threshold of model error in the detection of suspicious interval is 0.02. The b parameter used in Procedure 2 is set to 1.
existing algorithms are able to detect collaborative unfair raters that use their second strategy (with biased ratings not too far away from majority). As a result, the detection ratios are all 0 which can not be shown in this figure.
B. Collaborative Unfair Rater Detection
C. Rating Aggregation
In the first experiment, we set scaling factor a1 = 6 and a2 = 0.5. Hence, the potential collaborative raters are 6 times more likely to rate a dishonest product. In Figure 6, we compare the average trust values of reliable, careless and PC raters when using the proposed scheme. The initial trust value of each rater is 0.5. As time increases, the average trust value of PC raters is reduced quickly to 0.4 and the average trust values of careless and reliable raters rise continuously. Some ratings from careless raters are removed by the rating filter. Thus, the trust in careless raters is slightly smaller than that in reliable raters. We use threshold sus = 0.5 to detect the PC raters. Figures 7 and 8 show trust values of all raters at the end of the 6th month and the 12th month, respectively. In the sixth month, shown in Figure 7, only 1% reliable raters and 3% careless raters are falsely detected and 72% of PC raters are detected. As time increases, the honest raters’ trust goes up and PC raters’ trust descends even more. In the last month, shown in Figure 8, the false alarm for honest raters is zero and 87% of PC raters are detected. In order to quantitatively evaluate the capability of detecting unfair ratings of our new algorithm, we have carried out experiments to observe the percentages of detected unfair ratings as shown in Figure 9. In this figure, we draw two curves for detection ratio and false alarm ratio, respectively. It is shown in this figure that the detection ratio increases while the false alarm ratio decreases as time increases indicating clearly the superb effectiveness of our new algorithm. The detection ratio goes as high as 87% and the false alarm rate goes as low as negligible. Our original intention of this experiment was to compare our algorithm with existing algorithms. Surprisingly, no
In the second experiment, several rating aggregation algorithms: simple average, beta function based aggregation and the proposed scheme, are compared. The scaling factors are set to a1 = 8 and a2 = 0.5. Figure 10 shows the aggregated ratings for 48 honest products (id number is from 1 to 48), when biasshif t2 = 0.15. Since there are no collaborative unfair ratings for these products, the aggregated ratings generated by all three schemes are very close to the product quality. With the same simulation setup, Figure 11 shows the aggregated ratings of the 12 dishonest products (id number is from 49 to 60). One can see that the proposed scheme works very well. The collaborative unfair raters did not affect the aggregated rating much. In other two schemes, the aggregated ratings are higher than the actual product quality. In Figure 12, the PC raters choose biasshif t2 = 0.2. That is, the PC raters increase the bias in their ratings, compared with the case in Figure 11. Here, the proposed scheme generate very reliable aggregated ratings. The largest difference between the aggregated ratings and the product quality is only 0.02. On the other hand, this difference in the other two schemes is about 0.1, an order of magnitude higher! V. Conclusions In this paper, we have addressed the problem of detecting and handling unfair ratings in on-line rating systems. In particular, we designed a framework for integrating trust into rating aggregation process, developed an AR signal modeling based detecting algorithm, and found a good rating aggregation algorithm through
8
Rating Aggregation of Honest Products
Rating Aggregation of Dishonest Products (Bias = 0.2) 0.9
0.7 Simple average Beta function aggregation
Simple average Beta function aggregation Modified weighed average Quality of product
Modified weighed average Quality of product
Rating aggregation score
Rating aggregation score
0.65
0.85
0.6
0.55
0.5
0.45
0.8 0.75 0.7 0.65 0.6 0.55
0.4 0.5
0.35
0
5
10
15
20
25
30
35
40
45
0.45 48
50
Honest product id
Fig. 10.
50
52
54
56
58
60
Dishonest product id
Rating aggregation for honest products (BiasShif t = 0.15)
Fig. 12.
Rating aggregation for dishonest products(BiasShif t = 0.2)
Rating Aggregation of Dishonest Products (Bias = 0.15) 0.8 Simple average Beta function aggregation Modified weighed average Quality of product
Rating aggregation score
0.75
0.7
0.65
0.6
0.55
0.5 0.45
0.4
0.35 48
50
52
54
56
58
60
Dishonest product id
Fig. 11.
Rating aggregation for dishonest products(BiasShif t = 0.15)
comparison among existing trust models. The proposed solution can detect dishonest raters who collaboratively manipulate rating systems and carefully control their risk of being detected by providing biased ratings that are not far away from majority’s opinion. This type of unfair raters is difficult to catch by the existing approaches. In addition, even before these dishonest raters are detected, their influence to the system is limited through trust establishment mechanisms. The future work will be along several directions. First, we will perform more experiments on real-world data. Second, we will study the possible attacks to the proposed solutions and systems. R EFERENCES [1] C. Dellarocas, “The digitization of word-of-mouth: Promise and challenges of online reputation systems,” Management Science, vol. 49, no. 10, pp. 1407–1424, October 2003. [2] M. Chen and J.P. Singh, “Computing and using reputations for internet ratings,” in Proceedings of the 3rd ACM conference on Electronic Commerce, 2001. [3] C. Dellarocas, “Immunizing online reputation reporting systems against unfair ratings and discriminatory behavior,” in Proceedings of the 2nd ACM conference on Electronic commerce, 2000. [4] A. Whitby, A. Jsang, and J. Indulska, “Filtering out unfair ratings in Bayesian reputation systems,” in Proc. 7th Int. Workshop on Trust in Agent Societies, 2004. [5] J. Weng, C. Miao, and A. Goh, “An entropy-based approach to protecting rating systems from unfair testimonies,” IEICE TRANSACTIONS on Information and Systems, vol. E89-D, no. 9, pp. 2502–2511, September 2006. [6] J. Zhang and R. Cohen, “Trusting advice from other buyers in emarketplaces: the problem of unfair ratings,” in Proceedings of the 8th international conference on Electronic commerce, 2006. [7] M.H. Hayes, Statistical Digital Signal Processing and Modeling, John Wiley and Sons, 1996. [8] Y. Sun, Z. Han, W. Yu, and K. J. Ray Liu, “A trust evaluation framework in distributed networks: Vulnerability analysis and defense against attacks,” in Proc. IEEE INFOCOM’06, April 2006. [9] L. Xiong and L. Liu, “Peertrust: Supporting reputation-based trust for peerto-peer electronic communities,” IEEE Transactions on Knowledge and Data Engineering, vol. 16, no. 7, pp. 843–857, July 2004. [10] K. Fujimura and T. Nishihara, “Reputation rating system based on past behavior of evaluators,” in Proceedings of the 4th ACM conference on Electronic commerce, 2003.
[11] M. Blaze, J. Feigenbaum, and J. Lacy, “Decentralized trust management,” in Proceedings of the 1996 IEEE Symposium on Security and Privacy, pp. 164-173, May 1996. [12] M. Blaze, J. Feigenbaum, and A. D. Keromytis, “KeyNote: Trust management for public-key infrastructures,” Lecture Notes in Computer Science, vol. 1550, pp. 59–63, 1999. [13] U. Maurer, “Modelling a public-key infrastructure,” in Proceedings 1996 European Symposium on Research in Computer Security(ESORICS’ 96), volume 1146 of Lecture Notes in Computer Science, pp. 325-350, 1996. [14] M. K. Reiter and S. G. Stubblebine, “Toward acceptable metrics of authentication,” in Proceedings of the 1997 IEEE Symposium on Security and Privacy, 1997. [15] A. Jsang, “An algebra for assessing trust in certification chains,” in Proceedings of the Network and Distributed Systems Security (NDSS’99) Symposium, 1999. [16] A. Jsang, R. Ismail, and C. Boyd, “A survey of trust and reputation systems for online service provision,” in Decision Support Systems, 2005. [17] S. D. Kamvar, M. T. Schlosser, and H. Garcia-Molina, “The eigentrust algorithm for reputation management in p2p networks,” in Proceedings of 12th International World Wide Web Conferences, May 2003. [18] R. Guha, R. Kumar, P. Raghavan, and A.T. Propagation, “Propagation of trust and distrust,” in Proceedings of International World Wide Web Conference, 2004. [19] K. Aberer and Z. Despotovic, “Managing trust in a peer-2-peer information system,” in CIKM ’01: Proceedings of the tenth international conference on Information and knowledge management, New York, NY, USA, 2001, pp. 310–317, ACM Press. [20] S. Buchegger and J. L. Boudec, “Performance analysis of the CONFIDANT protocol,” in Proceedings of ACM Mobihoc, 2002. [21] Y. Sun, W. Yu, Z. Han, and K. J. Ray Liu, “Information theoretic framework of trust modeling and evaluation for ad hoc networks,” IEEE JSAC special issue on security in wireless ad hoc networks, April 2006. [22] L. Eschenauer, V. Gligor, and J. S. Baras, “On trust establishment in mobile ad-hoc networks,” in Security Protocols, Proc. of 10th International Workshop, Springer Lecture Notes in Computer Science (LNCS), April 2002. [23] S. Ganeriwal and M. B. Srivastava, “Reputation-based framework for high integrity sensor networks,” in Proceedings of ACM Security for Ad-hoc and Sensor Networks (SASN), 2004. [24] N. Shankar and W. Arbaugh, “On trust for ubiquitous computing,” in Proceedings of Workshop on Security in Ubiquitous Computing, UBICOMP’02, 2002. [25] M. Langheinrich, “When trust does not compute - the role of trust in ubiquitous computing,” in Proceedings of UBICOMP’03, 2003. [26] D. H. McKnight and N. L. Chervany, “The meanings of trust,” MISRC Working Paper Series, Technical Report 94-04, arlson School of Management, University of Minnesota, 1996. [27] C. Dellarocas, “Strategic manipulation of internet opinion forums: Implications for consumers and firms,” Management Science, October 2006. [28] “Netflix prize dataset,” www.netflixprize.com/download. [29] Y. Sun and Y. Yang, “Trust establishment in distributed networks: Analysis and modeling,” submitted to IEEE ICC’07. [30] A. Jsang and R. Ismail, “The beta reputation system,” in Proceedings of the 15th Bled Electronic Commerce Conference, June 2002. [31] S. Buchegger and J-Y Le Boudec, “The effect of rumor spreading in reputation systems in mobile ad-hoc networks,” in Proceedings of Wiopt’03, 2003.