A THESIS PRESENTED TO THE GRADUATE SCHOOL. OF THE UNIVERSITY OF FLORIDA IN PARTIAL FULFILLMENT. OF THE ..... intelligence technology has been successfully used to solve the ED problem. ..... pseudo-code 3.1 C-GRASP (n,l,u,f (·),MaxIters, MaxNumIterNoImprov, ...... Journal of Harbin Institute of.
C-GRASP APPLICATION TO THE ECONOMIC DISPATCH PROBLEM
By INGRIDA RADZIUKYNIENE
A THESIS PRESENTED TO THE GRADUATE SCHOOL OF THE UNIVERSITY OF FLORIDA IN PARTIAL FULFILLMENT OF THE REQUIREMENTS FOR THE DEGREE OF MASTER OF SCIENCE UNIVERSITY OF FLORIDA 2010
c 2010 Ingrida Radziukyniene ⃝
2
I dedicate this to my wonderful son, Matas
3
ACKNOWLEDGMENTS I am grateful to many people for supporting me throughout my graduate study in United States. First of all, I would like to express my earnest gratitude to my advisor, Dr. Panos M. Pardalos, for directing this study and reading previous drafts of this work. Without his guidance, inspiration, and support throughout the course of my research, this work would not be complete. Many thanks to Arturas who has been there for me, listening to me and supporting me. I am also thankful to my friends at the Center for Applied Optimization who mentally supported and made my student life more colorful.
4
TABLE OF CONTENTS page ACKNOWLEDGMENTS . . . . . . . . . . . . . . . . . . . . . . . . . . . . . . . . . .
4
LIST OF TABLES . . . . . . . . . . . . . . . . . . . . . . . . . . . . . . . . . . . . . .
7
LIST OF FIGURES . . . . . . . . . . . . . . . . . . . . . . . . . . . . . . . . . . . . .
8
ABSTRACT . . . . . . . . . . . . . . . . . . . . . . . . . . . . . . . . . . . . . . . . .
9
CHAPTER 1
INTRODUCTION . . . . . . . . . . . . . . . . . . . . . . . . . . . . . . . . . . . 10 1.1 Motivation . . . . . . . . . . . . . . . . . . . . . . . . . . . . . . . . . . . . 10 1.2 Literature Overview . . . . . . . . . . . . . . . . . . . . . . . . . . . . . . 11
2
ECONOMIC DISPATCH (ED) PROBLEM . . . . . . . . . . . . . . . . . . . . . 14 2.1 ED Constraints . . . . . . . . . . . . . . . . . . . . . . . . . . . . . . . . 2.1.1 Load-Generation Balance . . . . . . . . . . . . . . . . . . . . . . 2.1.2 Generation Capacity Constraint . . . . . . . . . . . . . . . . . . . 2.1.3 Generating Unit Ramp Rate Limits . . . . . . . . . . . . . . . . . 2.1.4 Reserve Contribution . . . . . . . . . . . . . . . . . . . . . . . . . 2.1.5 System Spinning Reserve Requirement . . . . . . . . . . . . . . 2.1.6 Tie-line Limits . . . . . . . . . . . . . . . . . . . . . . . . . . . . . 2.1.7 Prohibited Zone . . . . . . . . . . . . . . . . . . . . . . . . . . . . 2.2 Objective Functions . . . . . . . . . . . . . . . . . . . . . . . . . . . . . 2.2.1 Smooth Cost Function . . . . . . . . . . . . . . . . . . . . . . . . 2.2.2 Non-smooth Cost Functions with Valve-point Effects . . . . . . . 2.2.3 Non-smooth Cost Functions with Multiple Fuels . . . . . . . . . . 2.2.4 Non-smooth Cost Functions with Valve-Point Effects and Multiple Fuels . . . . . . . . . . . . . . . . . . . . . . . . . . . . . . . . . . 2.2.5 Emission Function . . . . . . . . . . . . . . . . . . . . . . . . . .
3
15 16 16 17 17 18 18 19 19 20 20 21
. 22 . 23
SOLUTION METHODS . . . . . . . . . . . . . . . . . . . . . . . . . . . . . . . 24 3.1 3.2 3.3 3.4
4
. . . . . . . . . . . .
Continuous Greedy Randomized Adaptive Search Procedure (C-GRASP) Genetic Algorithms (GA) . . . . . . . . . . . . . . . . . . . . . . . . . . . . Simulated Annealing (SA) . . . . . . . . . . . . . . . . . . . . . . . . . . . Constraints Handling . . . . . . . . . . . . . . . . . . . . . . . . . . . . . . 3.4.1 Penalty-Based Approach . . . . . . . . . . . . . . . . . . . . . . . . 3.4.2 Heuristic Strategy . . . . . . . . . . . . . . . . . . . . . . . . . . . .
24 26 27 29 29 30
EXPERIMENTS AND RESULTS . . . . . . . . . . . . . . . . . . . . . . . . . . 33 4.1 Experiments . . . . . . . . . . . . . . . . . . . . . . . . . . . . . . . . . . 33 4.1.1 System 1 . . . . . . . . . . . . . . . . . . . . . . . . . . . . . . . . 33
5
4.1.2 System 2 4.1.3 System 3 4.1.4 System 4 4.1.5 System 5 4.2 Results . . . . . 4.2.1 Case 1 . . 4.2.2 Case 2 . . 4.2.3 Case 3 . . 4.2.4 Case 4 . . 5
. . . . . . . . .
. . . . . . . . .
. . . . . . . . .
. . . . . . . . .
. . . . . . . . .
. . . . . . . . .
. . . . . . . . .
. . . . . . . . .
. . . . . . . . .
. . . . . . . . .
. . . . . . . . .
. . . . . . . . .
. . . . . . . . .
. . . . . . . . .
. . . . . . . . .
. . . . . . . . .
. . . . . . . . .
. . . . . . . . .
. . . . . . . . .
. . . . . . . . .
. . . . . . . . .
. . . . . . . . .
. . . . . . . . .
. . . . . . . . .
. . . . . . . . .
. . . . . . . . .
. . . . . . . . .
. . . . . . . . .
. . . . . . . . .
. . . . . . . . .
. . . . . . . . .
. . . . . . . . .
33 35 35 37 37 38 38 40 41
CONCLUSION . . . . . . . . . . . . . . . . . . . . . . . . . . . . . . . . . . . . 43
REFERENCES . . . . . . . . . . . . . . . . . . . . . . . . . . . . . . . . . . . . . . . 44 BIOGRAPHICAL SKETCH . . . . . . . . . . . . . . . . . . . . . . . . . . . . . . . . 50
6
LIST OF TABLES Table
page
4-1 Generating units characteristics of five-unit system . . . . . . . . . . . . . . . . 33 4-2 Load demand . . . . . . . . . . . . . . . . . . . . . . . . . . . . . . . . . . . . . 34 4-3 Generating units characteristics of six-unit system . . . . . . . . . . . . . . . . 34 4-4 Rump-up limits and prohibited zones of six-unit system . . . . . . . . . . . . . 35 4-5 Generating units characteristics of 13-unit system . . . . . . . . . . . . . . . . 35 4-6 Generating units characteristics of 40-unit system . . . . . . . . . . . . . . . . 36 4-7 Generating units characteristics of 10-unit system . . . . . . . . . . . . . . . . 37 4-8 Load demand for 24 hours . . . . . . . . . . . . . . . . . . . . . . . . . . . . . . 37 4-9 Generation costs for case 1 . . . . . . . . . . . . . . . . . . . . . . . . . . . . . 38 4-10 Best solution for case 1 . . . . . . . . . . . . . . . . . . . . . . . . . . . . . . . 38 4-11 Best solutions for case 2 . . . . . . . . . . . . . . . . . . . . . . . . . . . . . . . 39 4-12 Best results, when demand is1263 MW . . . . . . . . . . . . . . . . . . . . . . 39 4-13 Generation costs for 13-unit system with demand 1800 MW . . . . . . . . . . . 40 4-14 Generation costs for 40-unit system with demand 10500 MW . . . . . . . . . . 40 4-15 Best solution for case 4 . . . . . . . . . . . . . . . . . . . . . . . . . . . . . . . 41
7
LIST OF FIGURES Figure
page
2-1 Example of cost function with two prohibited operating zones . . . . . . . . . . 19 2-2 Cost function with valve-point effects . . . . . . . . . . . . . . . . . . . . . . . . 21 2-3 Cost function with multiple fuels . . . . . . . . . . . . . . . . . . . . . . . . . . . 22
8
Abstract of Thesis Presented to the Graduate School of the University of Florida in Partial Fulfillment of the Requirements for the Degree of Master of Science C-GRASP APPLICATION TO THE ECONOMIC DISPATCH PROBLEM By Ingrida Radziukyniene August 2010 Chair: Panos M. Pardalos Major: Industrial and Systems Engineering Economic dispatch plays an important role in power system operations, which is a complicated nonlinear constrained optimization problem. It has non-smooth and non-convex characteristic when generation unit valve-point effects are taken into account. This work adopts the C-GRASP algorithm to solve differently formulated economic dispatch problems. The comparison of the feasibility and effectiveness of the C-GRASP, SA and GA is given as well.
9
CHAPTER 1 INTRODUCTION 1.1 Motivation The economic dispatch (ED) optimization problem is one of the fundamental issues in power systems to obtain optimal benefits with the stability, reliability and security [52]. Essentially, the ED problem is a constrained optimization problem in power systems that have the objective of dividing the total power demand among the on-line participating generators economically while satisfying the various constraints. ED problem have complex and nonlinear nonconvex characteristics with equality and inequality constraints. Therefore, good solutions of the ED problem would result in great economical benefits. Over the years, many efforts have been made to solve this problem, incorporating different kinds of constraints or multiple objectives, through various mathematical programming and optimization techniques [42]. In the conventional methods such as the lambda-iteration method, the base point and participation factors, and the gradient methods, an essential assumption is that the incremental cost curves of the units are monotonically increasing piece wise linear functions, but the practical systems are nonlinear [52]. Hence, global optimization techniques, such as the genetic algorithms (GAs), simulated annealing (SA), and particle swarm optimization (PSO) have been studied in the past decade and have been successfully used to solve the ED. However, the references with continuous greedy randomized adaptive search procedure (C-GRASP) application to such type of problems hadn’t appear yet. The aim of this work is to apply the C-GRASP to the ED problem and compare its effectiveness and produced solution feasibility with ones of other heuristic methods like the GAs and SA.
10
1.2
Literature Overview
Since Carpentier introduced a network constrained economic dispatch problem in 1962 [9] and the first paper in the area of dynamic dispatching was published by Bechert and Kwatny in 1972 [6], a lot of researches have employed various mathematical programming optimization methods for solving ED problems [30]. These optimization techniques can be classified into three main categories. The first category contains deterministic methods that include the linear programming algorithm [26, 57, 69], quadratic programming algorithm [18, 37], non-linear programming algorithm [39], etc. The LP method application to the power-system rescheduling problem with security-constrained economic dispatch/control for multiple-valved-turbine units was given by Stott and Marinho [57]. Rosehart et al. [48] discovered that for the economic dispatch problem, SLP appears to be a better tool than SQP. An approach based on efficient SLP techniques to solve the multi-objective environmental/economic load dispatch problem was presented by Zehar and Sayah [69]. Granelli et al. [18] solved a security constrained economic dispatch problem using modified SQP techniques. A dual feasible starting point is found by relaxing transmission limits and then constraint violations are enforced applying the dual quadratic algorithm. In [59] and [35], a security constrained economic dispatch problem was solved by SLP and the interior point dual-affine scaling algorithm. Momoh et al. [37] proposed an IPM for ED problem formulated as linear and convex QP. However each of traditional methods has some defects: it would generate large errors to use the linear programming algorithm to linearize the ED model; for the quadratic programming and nonlinear programming algorithms, the objective function should be continuous and differentiable [30]. The second category contains the methods based on artificial intelligence. Artificial intelligence technology has been successfully used to solve the ED problem. A chaos optimization algorithm (CAO) has been proposed by Jiang et al. [29] to deal with the economic dispatch problem of a hydro power plant. Zhijiang et al. [71] also applied a
11
COA and the simulation results verified that the proposed approach is effective and precise. A mutative scale COA was applied by Xu et al. [65] to the economic operation of power plants. However, the results showed that the method is time-consuming. An improved mutative scale COA hes been developed by Han and Lu [19]. According to the authors, their algorithm is highly efficient and can be applied not only to ED but to many power system problems, such as economic operation, OPF, system identification and optimal contro, as welll. In [36], Mahdad et al. proposed an efficient decomposed parallel GA to solve the multi-objective environmental/economic dispatch problem. In the first stage, the original network is decomposed into multi sub-systems and the problem is transformed to optimize the active power demand associated with each partitioned network. In the second stage, an active power dispatch strategy is proposed to enhance the final solution of the optimal power flow of the original network. The proposed approach was tested on the Algerian 59-bus test system. The computational results showed the convergence at the near solution and obtain a competitive solution at a reduced time. GAs with fuzzy logic controllers to adjust its crossover and mutation probabilities was applied by Song et al. [56] to solve a combined environmental economic dispatch problem. SA techniques were used by Roa-Sepulveda and Pavez-Lazo [47], however, long computational time to obtain an optimal solution was reported. Tabu search was applied by Altun and Yalcinoz [2]. Simulation results on power systems consisting of 6 and 20 generating units exhibited good performance. In [38], an application of TS for solving security constrained ED problem was given by Muthuselvan and Somasundaram. Base case and contingency case line flow constraints were considered. Tests on 66-bus and 191-bus Indian utility systems revealed the reliability, efficiency and suitability of the proposed algorithm for practical applications. The third category consists the hybrid methods, which combine two or more techniques in order to get best features in each algorithm. Typically, signifficant improvement with hybrid methods can be achieved over each of the individual methods.
12
Hybrid methods gained increasing popularity in the last 10 years. For the ED problem, Wong and Wong [63] combined an incremental GA with SA techniques. Coelho and Mariani [12] proposed a method combining a DE algorithm with self-adaptive mutation factor in the global search stage and chaotic local search techniques in the local search to solve an ED problem associated with the valve-point effect. The same authors report another successful application of chaotic PSO in combination with an implicit filtering local search method to solve economic dispatch problems [13]. The chaotic PSO approach is used to produce good potential solutions, while the implicit filtering is used to fine-tune the final solution of the PSO. The hybrid methodology is validated for a test system consisting of 13 thermal units whose incremental fuel cost function takes into account the valve-point loading effects. In [11], Coelho and Lee improved PSO approaches for solving an ED problem taking into account non-linear generator features such as ramp-rate limits. Prohibited operating zones in the power system operation are developed as well. Their algorithm combines the PSO, Gaussian probability distribution functions and/or chaotic sequences. The PSO and its variants are validated for two test systems consisting of 15 and 20 thermal generation units, respectively. A combination of chaotic and self-organization behavior of ants in the foraging process was presented by Cai et al. [8]. This algorithm was applied to ED problems with thermal generators. The thesis is organized as follows: In Section 2, we briefly discuss a general ED problem formulation. The methods applied to solve ED are shortly discussed in Section 3. Section 4 describes experimental cases and presents calculation results. We conclude with Section 5.
13
CHAPTER 2 ECONOMIC DISPATCH (ED) PROBLEM ED is one of the important optimization problems in power system operations, which is used to determine the optimal combination of power outputs of all generating units to minimize the total fuel cost while satisfying various constraints over the entire dispatch periods [67]. The traditional or static ED problem assumes constant power to be supplied by a given set of units for a given time interval and attempts to minimize the cost of supplying this energy subject to constraints on the static behavior of the generating units like system load demand. Shortly, static ED determines the loads of generators in a system that will meet a power demand during a single scheduling period for the least cost. Therefore, it might fail to capture large variations of the load demand due to the ramp rate limits of the generators. Due to large variation of the customers load demand and the dynamic nature of the power systems, it became necessary to schedule the load beforehand so that the system can anticipate sudden changes in demand in the near future. Dynamic ED is an extension of static ED to determine the generation schedule of the committed units so that to meet the predicted load demand over the entire dispatch periods at minimum operating cost under ramp rate and other constraints [64]. The ramp rate constraint is a dynamic constraint which used to maintain the life of the generators, i.e. plant operators, to avoid shortening the life of the generator, try to keep thermal stress within the turbines safe limits [20]. Since the violations of the ramp rate constraints are assessed by examining the generators output over a given time interval, this problem cannot be solved for a single value of MW generation [20]. The objective function of dynamic ED is formulated as follows minC (P ) =
T ∑ N ∑ t =1 i =1
14
Ci (Pit )
(2–1)
where N is the set of committed units; Pi is the generation of unit i ; Ci (Pi ) is the cost of producing Pi from unit i ; T is the number of intervals in the study period. The fuel cost functions Ci (·) is derived from the fuel consumption function that can be measured and are discussed in Section 2.2. The dynamic ED is not only the most accurate formulation of the economic dispatch problem but also the most difficult to solve because of its large dimensionality [3]. The DED problem is normally solved by discretization of the entire dispatch period into a number of small time intervals, over which the load demand is assumed to be constant and the system is considered to be in a temporal steady state. Over each time interval a static ED problem is solved under static constraints and the ramp rate constraints are enforced between the consecutive intervals [34]. In the DED problem the optimization is done with respect to the dispatchable powers of the units. Some researchers have considered the ramp rate constraints by solving SED problem interval by interval and enforcing the ramp rate constraints from one interval to the next. However, this approach can lead to suboptimal solutions [23]; moreover, it does not have the look-ahead capability. Since dynamic ED was introduced, variuos methods have been used to solve this problem. However, all of those methods may not be able to provide an optimal solution and usually getting stuck at a local optimal. 2.1 ED Constraints The constrained ED problem is subjected to a variety of constraints depending upon assumptions and practical implications. Usually, formulation of ED problem includes such constraints as load generation balance, minimum and maximum capacity constraints. To maintain system reliability and security, spinning reserve constraints and security constraints can be added to the dynamic ED problem. The inclusion of the prohibited zones, ramp-rate limits and other practical constraints results in nonconvex ED of generating units. All these constraints are discussed bellow.
15
2.1.1 Load-Generation Balance The generated power from all the running units must satisfy the load demand and the system losses given by (2–2)
N ∑ i =1
Pit = D t + Loss t , t = 1, 2, ... , T
(2–2)
where D t is the demand and Loss t is the system transmission loss. Their sum represents the effective load to be satisfied at the t th interval. The transmission line losses can be expressed in terms of the unit outputs: Losst
=
N ∑ N ∑ i =1 j =1
Pit Bij Pjt
+
N ∑ i =1
Bi 0 Pit + B00
where Bij is the ij th element of the loss coefficient square matrix, Bi 0 is the i th element of the loss coefficient, and B00 is the constant loss coefficient. Sometimes the last two terms are omitted. In a competitive environment, the load-generation balance constraint is relaxed and each generating company schedules its production to maximize its profits given a forecast of electricity prices for the scheduling period. As a first approximation, each generating unit could be optimized separately in this problem because of the decoupling made possible by the availability of prices at each period. Dynamic constraints (such as ramp rates and minimum up and down time constraints) complicate the problem because a generating company that owns a portfolio of units must then decide whether to buy “flexibility” on the market or meet the dynamic constraints with its own resources [21]. 2.1.2 Generation Capacity Constraint For normal system operations, real power output of each generator is restricted by lower and upper bounds as follows:
Pit + Sit ≤ Pimax i = 1, 2, ... , N , t = 1, 2, ... , T
16
(2–3)
Pimin ≤ Pit i = 1, 2, ... , N , t = 1, 2, ... , T
(2–4)
where Pimin and Pimax are the minimum and maximum power produced by generator i , Sit is the reserve contribution of unit during time interval t . 2.1.3 Generating Unit Ramp Rate Limits One of unpractical assumption that prevailed for simplifying the problem in many of the earlier research is that the adjustments of the power output are instantaneous [43]. Therefore, the power output of a practical generator cannot be adjusted instantaneously without limits. The operating range of all online units is restricted by their ramp-rate limits during each dispatch period. So, the subsequent dispatch output of a generator should be limited between the constraints of up and down ramp-rates [66] as follows
Pit +1 − Pit ≤ URi · �t
(2–5)
Pit − Pit +1 ≤ DRi · �t i = 1, 2, ... , N , t = 1, 2, ... , T − 1
(2–6)
where URi and DRi are the maximum ramp up/down rates for unit i and �t is the duration of the time intervals into which the study period is divided. The inclusion of ramp rate limits modifies the generator operation constraints (2–3, 2–4) as follows max(Pimin , Pit −1 − DRi ) ≤ Pi ≤ min(Pimax , Pit −1 + URi )
(2–7)
2.1.4 Reserve Contribution The maximum reserve contribution has to satisfy following constraints:
0 ≤ Sit ≤ Simax i = 1, 2, ... , N , t = 1, 2, ... , T
(2–8)
where Simax is the maximum contribution of unit i to the reserve capacity. Maximum-ramp spinning reserve contribution is defined as in (2–9)
0 ≤ Sit ≤ URi · �t i = 1, 2, ... , N , t = 1, 2, ... , T where Sit is the spinning reserve of unit i . 17
(2–9)
2.1.5 System Spinning Reserve Requirement Sufficient spinning reserve is required from all running units to maximize and maintain system reliability [14]. There are many ways to determine the system spinning reserve requirement. It can be calculated as the size of the largest unit in operation or as a percentage of forecast load demand or even as a function of the probability of not having sufficient generation to meet the load [64]. The spinning rezerve can be defined by (2–10)
N ∑
Sit ≥ SR t t = 1, 2, ... , T
i =1 where SRt is the system spinning reserve requirement for time interval t . Also, the
(2–10)
system spinning reserve requirement for interval t can sometimes be given by the following equation [20]:
SR t = αd D t + αg · max(Pimax
scheduled at time t ,
i = 1, 2, ... N )
(2–11)
where αd and αg are constants which depend on the system required reliability level [55]. Besides the determination of the system spinning reserve requirement, the issue of allocation the spinning reserve among the committed units is very important; however, it has received very little attention in the dynamic ED literature. 2.1.6 Tie-line Limits The economic dispatch problem can be extended by importing additional constraint like transmission line capacity limit given by (2–12)
PT
jk ,min
≤ PTjk
+ Sjk ≤ PT
jk ,max
(2–12)
where PTjk min and PTjk max specify the tie-line trasnmission capability, i.e. the transfer ,
,
from area j to area k should not exceed the tie-line transfer capacities for security consideration [28]. Each area has own special load and its spinning reserve [68].
18
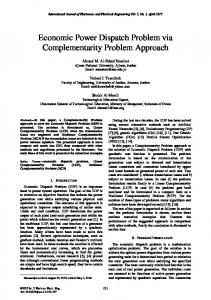
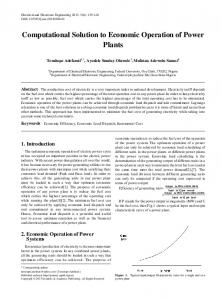
2.1.7 Prohibited Zone The generating units may have certain ranges where operation is restricted on the grounds of physical limitations of machine components or instability, e.g. due to steam valve or vibration in shaft bearings. So, there is a quest to avoid operation in these zones in order to economize the production [43]. These ranges are prohibited from operation and a generator with prohibited regions (zones) has discontinuous fuel-cost characteristics (Fig. 2.1.7) [53]. The acceptable operating zones of a generating unit can be formulated as follows
Pimin ≤ Pit ≤ Pil,1
(2–13)
Piu,j −1 ≤ Pit ≤ Pil,j , i ∈ θ, j = 2, 3, ... , ni , t = 1, 2, ... , T Piu,n
i
≤ Pit ≤ Pimax
(2–14) (2–15)
where ni is the number of the prohibited zones in unit i , θ is the set of units that have prohibited zones, Pil,j , Piu,j are the lower and upper bounds of the j th prohibited zone.
Figure 2-1. Example of cost function with two prohibited operating zones 2.2
Objective Functions
The dynamic ED problem has been solved with many different forms of the cost function, such as the smooth quadratic cost function (2–16) or the nonsmooth cost
19
function due to the valve-point effects (2–17). Also, a linear cost function [20] and piecewise linear cost function [27, 41] have been employed. For smooth cost function it is usually assumed that its incremental cost function. In some power systems combined cycle units are used to supply the base load. For these units the cost function can be given as linear, piecewise or quadratic with decreasing incremental cost function [41]. For units with prohibited zones, the fuel cost function is discontinuous and nonconvex. An interesting departure from this standard formulation is the approach proposed by Wang and Shahidehpour [61] who include in the objective function a term representing the reduction in the life of the turbine caused by excessive ramping rates. This flexible technique makes possible a tradeoff between the system operating cost and the life cycle cost of the generating units [21]. 2.2.1 Smooth Cost Function The most simplified cost function of each generator can be represented as a quadratic function as given in (2–16) whose solution can be obtained by the conventional mathematical methods
Ci (Pit ) = ai + bi Pit + ci (Pit )2
(2–16)
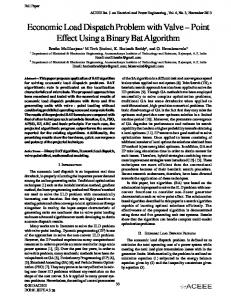
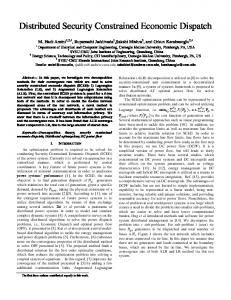
where ai , bi ,ci are cost coefficients of generator i . 2.2.2 Non-smooth Cost Functions with Valve-point Effects The generating units with multi-valve steam turbines exhibit a greater variation in the fuel cost functions because in order to meet the increased demand a generator with multi-valve steam turbines increase its output and various steam valves are to be opened [67]. This valve-opening process produces ripple like effect in the heat-rate curve of the generator. The inclusion of valve-point loading effects makes the modeling of the incremental fuel cost function of the generators more practical [60]. Therefore, in reality, the objective function of ED problem has non-differentiable property. Consequently, the objective function should be composed of a set of non-smooth cost functions. Considering non-smooth cost functions of generation units with valve-point
20
Figure 2-2. Cost function with valve-point effects effects, the objective function is generally described as the superposition of sinusoidal functions and quadratic functions [52]
Ci (Pit ) = ai + bi Pit + ci (Pit )2 + |ei sin(hi (Pimin − Pit ))|
(2–17)
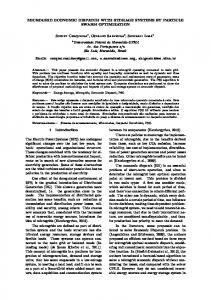
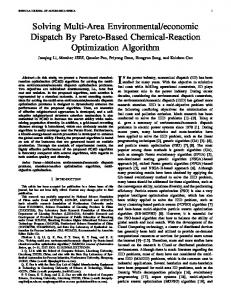
where ei and hi are the coefficients of generator i reflecting valvepoint effects. As shown in Fig. 2.2.2, this increases the non-linearity of curve as well as number of local optima in the solution space [60] compared with the smooth cost function due to the valvepoint effects. Also the solution procedure can easily trap in the local optima in the vicinity of optimal value. 2.2.3 Non-smooth Cost Functions with Multiple Fuels Since the dispatching units are practically supplied with multi-fuel sources [49], each unit should be represented with several piecewise quadratic functions reflecting the effects of fuel type changes, and the generator must identify the most economic fuel to burn. The resulting cost function is called a “hybrid cost function.” Each segment of the hybrid cost function implies some information about the fuel being burned or the
21
Figure 2-3. Cost function with multiple fuels units operation. Thus, generally, the fuel cost function is a piecewise quadratic function described as follows
ai 1 + bi 1 Pit ai 2 + bi 2 Pit
ci (Pi ) =
.. . ain + bin Pit
+ ci 1 (Pit )2
if Pit,min ≤ Pit ≤ Pit,1
+ ci 2 (Pit )2
if Pit,1 ≤ Pit ≤ Pit,2 .. .
+ cin (Pit )2
if Pit,n−1 ≤ Pit ≤ Pit,max
(2–18)
where are aip , bip , cip the cost coefficients of generator for the p th power level. The incremental cost functions are illustrated in Fig. (2.2.3) 2.2.4 Non-smooth Cost Functions with Valve-Point Effects and Multiple Fuels To obtain an accurate and practical economic dispatch solution, the realistic operation of the ED problem should consider both valve-point effects and multiple fuels. The reference [10] proposed an incorporated cost model, which combines the valve-point loadings and the fuel changes into one frame. Therefore, the cost function should combine (2–17) with (2–18), and can be realistically represented as shown in
22
(2–19) ai 1 + bi 1 Pit ai 2 + bi 2 Pit
ci (Pi ) =
.. . ain + bin Pit
t + ci 1 (Pit )2 + |ei ,1 sin(hi ,1 (Pimin ,1 − Pi ,1 ))|
if Pit,min ≤ Pit ≤ Pit,1
t + ci 2 (Pit )2 + |ei ,2 sin(hi ,2 (Pimin ,2 − Pi ,2 ))|
if Pit,1 ≤ Pit ≤ Pit,2 .. .
t + cin (Pit )2 + |ei ,n sin(hi ,n (Pimin ,n − Pi ,n ))|
if Pit,n−1 ≤ Pit ≤ Pit,max (2–19)
2.2.5 Emission Function Due to increasing concern over the environmental considerations, society demands adequate and secure electricity, i.e. not only at the cheapest possible price, but also at minimum level of pollution. In this case, two conflicting objectives, i.e., operational costs and pollutant emissions, should be minimized simultaneously [4, 5, 7, 62]. The atmospheric pollutants such as sulphur oxides (SOx ) and nitrogen oxides
(NOx ) caused by fossil-fueled generating units can be modeled separately or as the total emission of them which is the sum of a quadratic [4] and an exponential function and can be expressed as
N T ∑ ∑ t =1 i =1
αi
+ βi Pit + γi (Pit )2 + ηi exp(δi Pit )
where αi , βi , γi , ηi , and δi are emission coefficients of i th generating unit.
23
(2–20)
CHAPTER 3 SOLUTION METHODS 3.1 Continuous Greedy Randomized Adaptive Search Procedure (C-GRASP) Continuous-GRASP (C-GRASP) extends the greedy randomized adaptive search procedure (GRASP) that was introduced by Feo and Resende [16, 17] from the domain of discrete optimization to that of continuous global optimization in [24, 25]. It is described as a multi-start local search procedure, where each C-GRASP iteration consists of two phases, namely, a construction phase and a local search phase [24]. Construction combines greediness and randomization to produce a diverse set of good-quality starting solutions for local search. The local search phase attempts to improve the solutions found by construction. The best solution over all iterations is kept as the initial solution. The advantages of this method is simplicity to implement and no requirement for derivative information Pseudo-code for C-GRASP is shown in (3.1). C-GRASP works by discretizing the domain into a uniform grid. Both the construction (see the high level pseudo-code 3.2) and local improvement phases (see the high level pseudo-code 3.3) move along points on the grid. As the algorithm progresses, the grid adaptively becomes more dense. The main difference between GRASP and C-GRASP is that an iteration of C-GRASP does not consist of a single greedy randomized construction followed by local improvement, but rather a series of construction-local improvement cycles with the output of construction serving as the input of the local improvement, as in GRASP, but unlike GRASP, the output of the local improvement serves as the input of the construction procedure [25]. Since C-GRASP is essentially an unconstrained optimization algorithm, the constraints handling strategy needs to be incorporated into it in order to deal with the constrained ED problem. Approaches to manage these constraints are discussed in section 3.4.
24
pseudo-code 3.1 C-GRASP (n, l , u , f (·),MaxIters, MaxNumIterNoImprov, NumTimesToRun, MaxDirToTry,α) 1: f ∗ ← ∞ 2: for j ← 1, ... , NumTimesToRun do 3: x ← UnifRand(l , u ); h ← 1; NumIterNoImprov ← 0; 4: for Iter ← 1, ... , MaxIters do 5: x ← ConstructGreedyRandomized(x , f (·), n, h, l , u , α); 6: x ← LocalSearch(x , f (·), n, h, l , u , MaxDirToTry ); 7: if f (x ) < f ∗ then 8: x ∗ ← x ; f ∗ ← f (x ); NumIterNoImprov ← 0; 9: else 10: NumIterNoImprov← NumIterNoImprov+1 11: end if 12: if NumIterNoImprov≥ MaxNumIterNoImprov then 13: h ← h/2; NumIterNoImprov ← 0; {/}*make grid more dense*/ 14: end if 15: end for 16: end for 17: return x ∗
pseudo-code 3.2 ConstructGreedyRandomizedSolution (Problem Instance) 1: Solution ← ∅; 2: while Solution construction not done do 3: MakeRCL(RCL); 4: S ← SelectRandomElement(RCL); 5: Solution← Solution ∪ S; 6: AdaptGreedyFunction(S); 7: end while 8: return (Solution);
pseudo-code 3.3 LocalSearch(Solution,Neighborhood) 1: Solution* ← Solution 2: while Solution* not locally optimal do 3: Solution*← SelectRandomElement(Neighborhood(Solution*)); 4: if Solution better than Solution* then 5: Solution*← Solution; 6: end if 7: end while 8: return (Solution*)
25
3.2 Genetic Algorithms (GA) This section engages into the concept of genetic algorithms that reflects the nature of chromosomes in genetic engineering. GAs are a class of stochastic search algorithms that start with the generation of an initial population or set of random solutions for the problem at hand. Each individual solution in the population called a chromosome or string represents a feasible solution. The objective function is then evaluated for these individuals. If the best string (or strings) satisfies the termination criteria, the process terminates, assuming that this best string is the solution of the problem. If the termination criteria are not met, the creation of new generation starts, pairs, or individuals are selected randomly and subjected to crossover and mutation operations. The resulting individuals are selected according to their fitness for the production of the new offspring. Genetic algorithms combine the elements of directed and stochastic search while exploiting and exploring the search space [31]. More details about GA can be found in [22, 46, 58]. pseudocode 3.4 Genetic algorithm 1: initialize population() 2: while not converge do 3: assign population fitness() 4: for 1, ... , npopsiz do 5: select parents(p1,p2) 6: reproduction(p1,p2,child) 7: end for 8: select next generation() 9: end while The advantages of GA over other traditional optimization techniques can be summarized as follows: •
GA searches from a population of points, not a single point. The population can move over hills and across valleys. GA can therefore discover a globally optimal point, because the computation for each individual in the population is independent of others. GA has inherent parallel computation ability.
26
•
GA uses payoff (fitness or objective functions) information directly for the search direction, not derivatives or other auxiliary knowledge. GA therefore can deal with non-smooth, non-continuous and non-differentiable functions that are the real-life optimization problems. This property also relieves GA of the approximate assumptions for a lot of practical optimization problems, which are quite often required in traditional optimization methods.
•
GA uses probabilistic transition rules to select generations, not deterministic rules. They can search a complicated and uncertain area to find the global optimum. GA is more flexible and robust than the conventional methods [33]. The first attempt of the application of genetic algorithms in power systems is in the
load flow problem [70]. It has been found that the simple genetic algorithm quickly finds the normal load flow solution for small-size networks by specifying an additional term in the objective function. A number of approaches to improving convergence and global performance of GAs have been investigated [70]. 3.3
Simulated Annealing (SA)
The SA is a generic probabilistic meta-heuristic for the global optimization problem that was proposed by Kirkpatric et al. [32]. In the SA method, each point s of the search space is analogous to a state of some physical system, and the function E(s) to be minimized is analogous to the internal energy of the system in that state. The goal is to bring the system, from an arbitrary initial state, to a state with the minimum possible energy. In each step of the SA algorithm the current solution is replaced by a random “nearby” solution, chosen with a probability that depends on the difference between the corresponding function values and on a global parameter T (called the temperature), that is gradually decreased during the process. The dependency is such that the current solution changes almost randomly when T is large, but increasingly “downhill” as T goes to zero. The allowance for “uphill” moves saves the method from becoming stuck at local minima which are the bane of greedier methods. For certain problems, SA may be more effective than exhaustive enumeration. It has been shown that this technique converges asymptotically to the global optimal solution with probability one [1].
27
SA is an effective global optimization algorithm because of the following advantages [50]: •
suitability to problem in wide area,
•
no restriction on the form of cost function,
•
high probability to find global optimization,
•
easy implementation by programming. The pseudocode implementing SA is given bellow. It starts from state s 0 and
continue for kmax of steps or until a state with energy emax or less is found. The call neighbour(s) should generate a randomly chosen neighbour of a given state s ; the call random() should return a random value in the range [0,1]. The annealing schedule is defined by the temp(r), which should yield the temperature to use, given the fraction r of the time budget that has been expended so far. pseudocode 3.5 Simmulated Annealing 1: s ← s0 ; e ← E (s ) 2: sbest ← s ; ebest ← e ; 3: k ← 0; 4: while k < kmax and e > emax do 5: snew ← neighbour(s) 6: enew ← E (snew ) 7: if enew ≤ ebest then 8: sbest ← snew ; ebest ← enew 9: end if 10: if P(e , enew , temp(k /max )) > random() then 11: s ← snew ; e ← enew 12: k ←k +1 13: end if 14: end while 15: return sbest Actually, the “pure” SA algorithm does not keep track of the best solution found so far: it does not use the variables sbest and ebest , it lacks the first if inside the loop, and, at the end, it returns the current state s instead of sbest . While saving the best state is a
28
standard optimization, that can be used in any metaheuristic, it breaks the analogy with physical annealing since a physical system can “store” a single state only. In strict mathematical terms, saving the best state is not necessarily an improvement, since one may have to specify a smaller kmax in order to compensate for the higher cost per iteration. However, the step sbest ←
snew happens only on a small fraction of the
moves. Therefore, the optimization is usually worthwhile, even when state-copying is an expensive operation. SA has the ability to avoid getting local solutions; then it can generate global or near global optimal solutions for optimization problems without any restriction on the shape of the objective functions [44]. SA is not memory intensive [45]. However, the setting of control parameters of the SA algorithm is a difficult task and the computation time is high [3]. The computational burden can be reduced by means of parallel processing [44]. 3.4 Constraints Handling Constraints lie at the hear to fall constrained engineering optimization applications. Practical constraints, which are often nonlinear and non-trivial,confine the feasible solutions to a small subset of the entire search space. There are several approaches which can be applied to handle constraints in heuristic approaches. These methods can be grouped into four categories: methods that preserve the feasibility of solutions, penalty-based methods, methods that clearly distinguish between feasible and unfeasible solutions, and hybrid methods [15, 62]. 3.4.1 Penalty-Based Approach The penalty function method is frequently applied to manage constraints in evolutionary algorithms. Such a technique converts the primal constrained problem into an unconstrained problem by penalizing constraint violations. The penalty function method is simple in concept and implementation. However, its primal limitation is the degree to which each constraint is penalized. These penalty terms have certain weaknesses that become fatal when penalty parameters are large. Such a penalty
29
function tends to be ill conditioned near the boundary of the feasible domain where the optimum point is usually located [10]. The penalized fuel cost function in ED problem was employed in [51]. In [40] the ED problem was transformed into an unconstrained one by constructing an augmented objective function incorporating penalty factors for any value violating the constraints:
Neq ∑
Nueq
∑ H (X ) = J (X ) + k1 (hj (X ))2 + k2 max[0, −gj (X )]2 j =1 j =1
(3–1)
where J (X ) is the objective function value of the ED problem.
Neq and Nueq are the number of equality and inequality constraints, respectivel; hj (X ) and gj (X ) are the equality and inequality constraints, respectively; k1 and k2 are the penalty factors. Since the constraints should be met, the value of thek1 and k2 parameters were chosen to have high value of 10,000. This approach was epmpoyed when applying SA method. The heuristic startegy that is discussed in nex section was used to get a feasible solution while applying C-GRASP method. 3.4.2 Heuristic Strategy When the C-GRASP is applied to solve ED problem, a key problem is how to handle constraints with efficiency. In this section we mainly focus on handling the real power limits and generators ramp-up constraints. Other than penalty based way to satisfy the real power balance equality constraints (2–2), is to specify the output of
(N − 1) generating units and to find the N th from the equality constraint like in [4, 67]. In reference [67], authors employed a dependent generation power plt of randomly selected unit l . The heuristic strategy applied in LocalSearch() procedure in C-GRASP algorithm can be formulated in a following way: Step 1. Set the dispatch period index t
= 1 and iteration i = 1.
30
t at dispatch time t is Step 2. Calculate the violation of power blance constraint Perr calculated from 3–2 as follows
t = D t + Loss t − Perr
N ∑ i =1
Pit
(3–2)
= 0, then go to Step 5, otherwise to Step 3. Step 3. Randomly generate l the index of generating unit and calculate the real power of selected dependent generating unit plt from (3–3). t If Perr
Plt
= Dt −
N ∑ i =1 i ̸=l
Pit t = 1, 2, ..., T
(3–3)
However, considering transmission losses (2.1.1), these equality constraints become nonlinear and the output of dependent generating unit for every dispatch period t can be found from by solving a following equation
Bll (Plt )2 +(2
N ∑
N ∑ N ∑
i =1 i ̸=l
i =1 j =1 i ̸=l j ̸=l
Bli Pit +Bl 0 −1)Plt +(D t +
Pit Bij Pjt +B00 +
N ∑ i =1 i ̸=l
Bi 0 Pit −
N ∑ i =1 i ̸=l
Pit ) = 0
(3–4)
If it doesn’t violate the generator operating limits and ramp-up constraints (if they are present), go to Step 5. Otherwise, the value has to be modified according to 3–5 Plmax if Plt > Plmax t Pl = Plmin if Plt < Plmin
(3–5)
If ED incorporates ramp-up limits and dispatch period t > 1, then dependent unit output has to be calculated as 3–6 max(Plmin , Plt −1 − DRl ) t Pl = min(Plmax , Pit −1 + URl )
if Plt > max(Plmin , Plt −1 − DRl ) if Plt < min(Plmax , Pit −1 + URl )
After adjustment, go to Step 4.
31
(3–6)
l = l + 1. If l