JOURNAL OF CHEMICAL PHYSICS
VOLUME 121, NUMBER 8
22 AUGUST 2004
C6 À electronic relaxation dynamics probed via time-resolved photoelectron imaging Arthur E. Bragg, Jan R. R. Verlet, Aster Kammrath, and Daniel M. Neumarka) Department of Chemistry, University of California, Berkeley, California 94720 and Chemical Sciences Division, Lawrence Berkeley National Laboratory, Berkeley, California 94720
共Received 22 April 2004; accepted 17 May 2004兲 Anion time-resolved photoelectron imaging has been used to investigate the electronic relaxation ˜ 2 ⌸ ←X ˜ 2 ⌸ and 2 2 ⌸ ←X ˜ 2 ⌸ 0 0 transitions at dynamics of C6 ⫺ following excitation of the C g u g u 0 607 and 498 nm, respectively. Analysis of evolving photodetachment energy distributions reveals ˜ 2 ⌸ 0 0 level relaxes on differing relaxation pathways from these prepared states. Specifically, the C g a time scale of 620⫾30 fs to vibrationally hot 共⬃2.0 eV兲 anion ground state both directly and indirectly through vibrationally excited levels of the intermediate-lying ˜A 2 ⌺ ⫹ g state that decay with a time scale of 2300⫾200 fs. In contrast, the 2 2 ⌸ g 0 0 level relaxes much more quickly 共⬍100 fs兲 to vibrationally hot 共⬃2.5 eV兲 anion ground state directly and with transient population ˜2 ⫹ ˜2 accumulation in the ˜A 2 ⌺ ⫹ g , B ⌺ u , and C ⌸ g electronic levels, as determined by spectral and time-scale analyses. This work also presents the experimental observation of the optically inaccessible ˜B 2 ⌺ ⫹ u state, which is found to have an electronic term value of 1.41⫾0.05 eV. © 2004 American Institute of Physics. 关DOI: 10.1063/1.1769368兴
I. INTRODUCTION
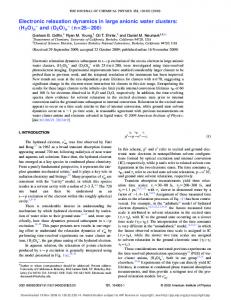
are known to have linear equilibrium geometries at sizes n ⬍10, and numerous bound electronic states below threshold, a consequence of the relatively high electron affinities of their neutral counterparts14,15 and their energetically dense electronic orbital structures. The electronic spectroscopy of C6 ⫺ , the species of interest in this work, has been characterized by a combination of matrix absorption,16,17 resonant two-photon detachment,8 and ab initio studies.18,19 An electronic energy diagram for C6 ⫺ is given in Fig. 1, labeled with best-available level energetics and shorthand electronic configurations for all states relevant to this study. The dominant molecular orbital for the C6 ⫺ ˜X 2 ⌸ u ground state is ...6 2g 1 4u 6 2u 7 2g 1 4g 2 3u , while nominal configurations of the energetically lowest ex˜2 ⫹ ˜2 cited states of the anion, ˜A 2 ⌺ ⫹ g , B ⌺ u , C ⌸ g , and 2 2 ⌸ g , all within 3 eV of the anion ground state, arise from 2 u ←7 g , 2 u ←6 u , 2 u ←1 g , and 4 g ←2 u excitations from the ground state, respectively. All optically allowed electronic transitions exhibit well-resolved vibrational structure, enabling one to monitor relaxation pathways starting from single vibronic levels of excited electronic states of C6 ⫺ in time-resolved experiments. We previously studied the internal conversion dynamics of C6 ⫺ following excitation ˜ 2 ⌸ ←X ˜ 2 ⌸ 0 0 transition in a time-resolved through the C g u 0 PES experiment with a magnetic bottle electron energy analyzer.6 This work showed that the initially excited ˜ 2 ⌸ 0 0 level decayed with a time constant of 730 fs to the C g ˜X 2 ⌸ ground state and the ˜A 2 ⌺ ⫹ and/or ˜B 2 ⌺ ⫹ levels, u g u which subsequently relaxed to the ground state on a time scale of 3.0 ps. Since this work was done, the advantages of photoelectron imaging 共PEI兲 in negative ion experiments have been demonstrated by Bordas,20 Sanov,21 and co-workers, and we
Time-resolved photoelectron spectroscopy 共PES兲 and its variants1 have been shown to be powerful techniques for the study of ultrafast relaxation dynamics in electronically excited neutral species ranging from diatomics2 to biomolecules.3 The application of these methods to similar dynamical processes in negative ions offers the additional advantage of incorporating size selectivity into the experiments, making it possible, for example, to track the evolution of relaxation phenomena with size in mass-selected metal and carbon cluster anions.4 – 6 Carbon cluster anions are particularly interesting as they support low-lying bound excited electronic states through which radiationless transitions can occur from an initially prepared excited state.7 In addition, depending on their size and how they are excited, these clusters undergo both direct photodetachment and thermionic emission.8,9 In this paper we present results on time-resolved photoelectron imaging of C6 ⫺ in which we elucidate relaxation pathways subsequent to excitation of single vibronic levels, and further characterize the conditions under which this species undergoes thermionic emission. Carbon cluster anions have been thoroughly characterized spectroscopically and via electronic structure calculations.10,11 Studies of these species and their neutral counterparts burgeoned in the 1980s and 1990s, reflecting an interest in identifying the carriers of the diffuse interstellar bands,7 the astronomically observed visible and near infrared absorptions of the interstellar medium, and understanding how the geometry of stable carbon structures evolves with size into the nanoscale regime.12,13 These molecular anions a兲
Author to whom correspondence should be addressed. Fax: 510-642-3635. Electronic mail:
[email protected]
0021-9606/2004/121(8)/3515/12/$22.00
3515
© 2004 American Institute of Physics
Downloaded 27 Aug 2004 to 130.37.129.78. Redistribution subject to AIP license or copyright, see http://jcp.aip.org/jcp/copyright.jsp
3516
Bragg et al.
J. Chem. Phys., Vol. 121, No. 8, 22 August 2004
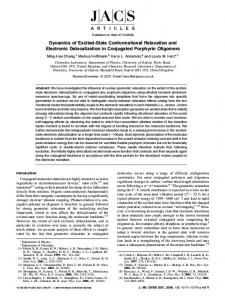
FIG. 2. Anion TRPEI apparatus. Ion source/mass spectrometer components: PV—pulsed valve; PD—pulsed discharge; E, A, G—Wiley-McLaren TOF focusing electrodes; D—ion deflectors; and Einz—Einzel Lens. Numbering indicates sequential participation in anion photoelectron VMI as explained in the text.
electronic state of C6 ⫺ is prepared initially, the electron kinetic energy distribution after several picoseconds is dominated by photoemission from highly vibrationally excited ground state anions.
II. EXPERIMENT FIG. 1. C6 ⫺ /C6 electronic state energetics. Configurations reference ground states. Energetics are taken from best-available data: 共a兲 Ref. 16, 共b兲 Ref. 19, 共c兲 Ref. 8, 共d兲 Ref. 29, and 共e兲 Ref. 30. EA共C6 )⫽4.180 eV 共Ref. 15兲. Arrows indicate one-electron-allowed photodetachment correlations.
have incorporated this detection technique into our timeresolved experiments.22,23 PEI offers higher electron energy resolution than our magnetic bottle analyzer and yields timeresolved photoelectron angular distributions 共PADs兲 as well. Here, we present a study of the internal conversion dynamics ˜ 2 ⌸ ←X ˜ 2 ⌸ and of C6 ⫺ following excitation of its C g u 0 2 2 ˜ 2 ⌸ g ←X ⌸ u 0 0 transitions using femtosecond timeresolved photoelectron imaging 共TRPEI兲. The aim of this work was to clarify the channels through which relaxation ˜ 2 ⌸ 0 0 state, and to contrast these pathoccurs from the C g ways and time scales with those arising through relaxation from the higher-lying 2 2 ⌸ g state. ˜ 2 ⌸ 0 0 state undergoes internal conWe find that the C g version to the ˜X 2 ⌸ u state by direct and indirect pathways; the improved instrumental resolution shows that the indirect pathway involves transient population of the ˜A 2 ⌺ ⫹ g state but ˜ 2 ⌸ 0 0 occurs on a not the ˜B 2 ⌺ ⫹ state. Initial decay of C g u time scale of 620⫾30 fs, while population of the ˜X 2 ⌸ u and ˜A 2 ⌺ ⫹ states rises on a comparable time scale and the ˜A 2 ⌺ ⫹ g g state transient subsequently decays on a 2300⫾200 fs time scale. In contrast, decay of the 2 2 ⌸ g 0 0 level and subsequent population of the vibrationally hot ground and electronically excited transient states occur within the experimental pumpprobe cross-correlation width (t decay⬍100 fs), where all ˜2 ⫹ ˜2 intermediate-lying states—the ˜A 2 ⌺ ⫹ g , B ⌺ u , and C ⌸ g states—participate as transient levels. The transient feature associated with the ˜B 2 ⌺ ⫹ u state provides the first experimental measurement of its term energy. Regardless of which
A detailed schematic of our anion time-resolved photoelectron imaging apparatus is shown in Fig. 2. Anions are generated in a pulsed source, mass separated by time-offlight 共TOF兲, and photoexcited and photodetached by femtosecond laser pulses. The resulting photoelectrons are collected and analyzed with a collinear velocity-map imaging 共VMI兲 electron optical system, yielding both electron kinetic energy 共eKE兲 and angular distributions. In more detail, C6 ⫺ was generated by passing a pulsed expansion 共500 Hz, 350 m pinhole, 25–35 psi backing pressure兲 of a 1% C2 H2 :1.5% CO2 mix in argon carrier through a pulsed discharge 共PD兲.24 A 1200 eV electron beam provided a stabilizing charge source for negative ion formation within the discharge. Negative ions were injected orthogonally into a time-of-flight mass spectrometer at a beam energy of 1700 eV. Ions passed through a grounded aperture 共1兲 and ‘‘rereferencing’’ tube 共2兲 en route to the laser interaction region 共3兲. Ions of interest were mass gated by briefly raising 共2兲 from its normal voltage of either ⫺2500 or ⫺4000 V 共depending on the pump wavelength兲 to 0 V and subsequently returning it to the original voltage once the chosen ions had entered; this permitted transmission of C6 ⫺ while blocking ions differing by one mass unit 共i.e., C6 H⫺ ) or more. Source ion distributions and gated ion signal were monitored by a retractable 1 in. chevron microchannel plate 共MCP兲 detector 共6兲. The far end of 共2兲, capped with an aperture, serves as the repeller electrode in our three-element photoelectron VMI assembly 共3兲, which is based on the design of Eppink and Parker.25 The other two elements are the extractor and grounded aperture electrodes that are held at static potentials. Ions interact with the femtosecond laser pulses—inducing excitation and photodetachment—between the repeller and extractor electrodes. Sharpest photoelectron images were obtained with an extractor-to-repeller potential ratio of 70%
Downloaded 27 Aug 2004 to 130.37.129.78. Redistribution subject to AIP license or copyright, see http://jcp.aip.org/jcp/copyright.jsp
C6⫺ electronic relaxation dynamics
J. Chem. Phys., Vol. 121, No. 8, 22 August 2004
for the current electrode geometry and location of the interaction region within the lens. Photoelectrons are accelerated toward a 70 mm diameter chevron MCP detector 共4兲, coupled to a P20 phosphor screen 共Burle兲, located 60 cm from the laser-interaction region. With imaging lens potentials 共repeller/extractor voltages兲 of ˜ 2 ⌸ ←X ˜ 2 ⌸ ) and ⫺4000 V/⫺2800 ⫺2500 V/⫺1750 V (C g u 2 2 ˜ V (2 ⌸ g ←X ⌸ u ), detachment signal filled 50%–70% of the detector area. A 500 Hz pulsed ‘‘gain gate’’ of ⬍1–2 s duration limited signal collection about the arrival time 共⬃300 ns interaction-to-detector兲 of the photoelectrons. Phosphor emission was ported from vacuum through a fiberoptic bundle, allowing a Dalsa-1M30 charge coupled device 共CCD兲 camera 共Uniforce兲, outfitted with an AF Nikkor 35 mm lens 共Nikon兲, to capture images at a 50 Hz repetition rate 共5兲; each frame integrated the signal of nine consecutive laser shots and was retriggered on the tenth. The camera collected images in a 2⫻2 pixel binning mode 共effectively, 512 ⫻512 pixels兲 in order to increase camera frequency and overall collection speed. An electron energy resolution of ⌬E/E⭐5% is routinely obtained following atomic anion photodetachment with broad-bandwidth 共20 meV兲 laser pulses. Photoelectron VMI yields 100% photoelectron collection while eliminating the ‘‘Doppler broadening’’ that results in a significant degradation of resolution when a magnetic bottle analyzer is used in conjunction with a fast ion beam,26 and therefore obviates the need to employ pulsed deceleration fields often used in magnetic bottle anion PES experiments. Moreover, the collinear arrangement used here largely eliminates resolution loss due to the energy spread of the ion beam in a TOF mass spectrometer.27 Pump and probe frequencies used in this experiment were generated from the 790 nm, 1 mJ 共500 Hz兲, 90 fs full width at half maximum 共FWHM兲 chirped-pulse amplified output of a Ti:Sapphire femtosecond oscillator 共Clark-MXR NJA-5, CPA-1000兲 through various frequency conversion schemes. The 607 nm pump pulse 共15 J, ⬃100 fs兲 used to ˜ 2 ⌸ ←X ˜ 2 ⌸ resonance was generated by secexcite the C g u ond harmonic generation 共BBO type-I兲 of the infrared signal produced from a fundamental-pumped optical parametric amplifier 共TOPAS, Light Conversion兲. The 498 nm pump ˜ 2⌸ pulse 共25 J, ⬃100 fs兲 used to excite the 2 2 ⌸ g ←X u transition was generated through sum-frequency mixing of a ⬃1350 nm OPA signal with the Ti:Sa fundamental 共BBO type-II兲. A 264 nm probe pulse 共15–20 J, ⬃120 fs兲 was generated by tripling the fundamental output and was delayed with respect to the pump pulse through use of a computer-controlled translation stage. A 50 cm lens focused the collinearly recombined beams within the spectrometer interaction region. The lens position was readjusted for each color scheme to maximize two-color photodetachment signal with respect to probe-only 共one-photon 264 nm兲 detachment. For both transitions, time zero was determined from the pump-induced half fall of direct UV 共one-photon 264 nm兲 ground state detachment signal. Data were typically acquired for 50 000–100 000 laser shots 共100–200 s兲 at each pump-probe delay, generally resulting in the collection of 150 000–200 000 photoelectrons
3517
for each delay with 15%–25% of these electrons arising from excited state detachment. Higher quality images 共cf. Fig. 5兲 at selected delay times were acquired over 200 000– 300 000 laser shots, with up to 500 000 photoelectrons collected. Each two-color image has an associated ‘‘probe-only’’ 共one-photon 264 nm兲 image, collected for a third of the number of laser shots used for the two-color image, that was used to normalize image-to-image signal fluctuations. Normalization of two-color signal collected in different sets of scans was accomplished through image collection at a fixed longtime delay where two-color signal no longer evolves. Background collection was interleaved with data acquisition for proper ion and laser background subtraction in both twocolor and normalizing 共probe-only兲 images. All images have been four-way symmetrized in order to account for inhomogeneities in detector and CCD sensitivity. Three-dimensional 共3D兲 velocity distributions were reconstructed using the basis set expansion 共BASEX兲 forward convolution method developed by Reisler and co-workers.28 Photoelectron kinetic energy distributions were obtained through velocity→energy transformation and radial integration of the ⫽0 slice of reconstructed 3D detachment distributions. Photoelectron angular distribution anisotropy parameters,  n ( ⑀ ), were acquired by projecting the 3D slice onto an even series of associated Legendre polynomials 关 P n (cos )兴 appropriate for an m-photon photodetachment process induced within the cylindrically symmetric experimental arrangement used here—collinear laser propagation, mutually parallel laser polarizations and detector plane; see Sec. IV D for more details.
III. RESULTS
Three types of photoelectron 共PE兲 images were taken as part of this investigation: 共i兲 one-color, one-photon probeonly images at 264 nm, 共ii兲 one-color, resonant multiphoton detachment 共RMPD兲 images at 607 and 498 nm, in which the ˜ 2 ⌸ ←X ˜ 2 ⌸ or photon energy is resonant with either the C g u 2 2 ˜ 2 ⌸ g ←X ⌸ u band origins, and 共iii兲 two-color, pump-probe images with pump wavelengths of 607 or 498 nm and a probe wavelength of 264 nm. The assignment of the 2 2 ⌸ g ˜ 2 ⌸ band at 498 nm by Maier16 has been questioned,19 ←X u
but we believe it to be correct 共see Sec. V兲 and will proceed in this section under that assumption. Figure 3共a兲 shows the one-photon PE image of C6 ⫺ obtained at 264 nm. A slice through the reconstructed 3D velocity distribution is displayed in Fig. 3共b兲, while the photoelectron spectrum is shown 共solid兲 in Fig. 3共c兲. The PE spectrum, previously measured and analyzed at higher resolution,29 exhibits three peaks at electron kinetic energies 共eKE兲 of 0.52, 0.36, and 0.27 eV 关labeled 1, 2, and 3, respectively, in Figs. 3共b兲 and 3共c兲兴 corresponding to the ˜X 3 ⌺ ⫺ g , ⫺ ˜ 2 ⌸ photodetachment transitions, re˜a 1 ⌬ g , ˜b 1 ⌺ ⫹ ⫹e ←X u u spectively. The improvement in energy resolution relative to our previously measured Doppler-broadened spectrum6 obtained with a magnetic bottle 关dashed overlay in Fig. 3共c兲兴 is apparent. The angular distributions of the photoelectrons at these energies are relatively isotropic 关cf. Figs. 3共a兲 and
Downloaded 27 Aug 2004 to 130.37.129.78. Redistribution subject to AIP license or copyright, see http://jcp.aip.org/jcp/copyright.jsp
3518
Bragg et al.
J. Chem. Phys., Vol. 121, No. 8, 22 August 2004
FIG. 3. One-photon photodetachment of C6 ⫺ at 264 nm: PE image and BASEX-inversion—共a兲 and 共b兲, respectively; 共c兲 C6 ⫺ PE spectrum obtained from 共b兲—共a兲 magnetic-bottle PE spectrum 共264 nm兲 of C6 ⫺ is overlaid 共dashed兲. Numbers explained in text.
3共b兲兴—the anisotropy parameters  2 for these transitions 关see Eq. 共6兲兴 were measured as 0.18⫾0.02, 0.13⫾0.05, and ⫺0.02⫾0.07, respectively. RMPD images of C6 ⫺ collected at 607 and 498 nm are shown in Figs. 4共a兲 and 4共b兲, respectively, while PE spectra 共smoothed兲 obtained from these images are shown in Figs. 4共c兲 and 4共d兲. The images at the two wavelengths are dominated by bright central spots. RMPD at 607 nm, resonant ˜ 2 ⌸ ←X ˜ 2 ⌸ band origin, requires a minimum of with the C g u three photons 共i.e., 关 1⫹n 兴 , n⬎2) for electron detachment. The resulting PE spectrum peaks at zero eKE and drops off monotonically with increasing eKE. At 498 nm, RMPD via ˜ 2 ⌸ 0 0 transition yields a PE spectrum similar the 2 2 ⌸ g ←X u 0 to that seen at 607 nm, though extending to higher eKE and exhibiting a small maximum at eKE ⬃550 meV. Absorption of at least three photons is required to observe signal beyond eKE⫽0.80 eV. Selected two-color pump-probe photoelectron images of
˜ 2 ⌸ ←X ˜ 2 ⌸ 0 0 transition C6 ⫺ following excitation of the C g u 0 are displayed in Fig. 5. The contribution from probe-only photodetachment 共i.e., Fig. 3兲 has been subtracted from the images in order to highlight detachment signal arising from the initial and nascent relaxing states; negative intensities have been minimized in subtraction. For both transitions investigated a parallel pump/probe laser polarization scheme was employed, with a common polarization parallel to the detector plane and corresponding to the vertical direction in all images, as indicated. In both cases, the images are quite isotropic and contract with increasing pump-probe delay, exhibiting two-color, two-photon photodetachment signal well beyond the image centers, in contrast to the one-color RMPD images in Fig. 4. Time-resolved PE kinetic energy distributions obtained from unsubtracted photoelectron images at both pump wavelengths are displayed in Figs. 6 and 7, with associated pumpprobe delays indicated. These spectra exhibit two-photon contributions from pump-probe photodetachment and onephoton contributions from probe-only photodetachment of ground state C6 ⫺ ; the latter has the same form as in Fig. 3共c兲 and appears in Figs. 6 and 7 as three sharp features between 0.25 and 0.5 eV. This probe-only signal is depleted at very short pump-probe delay times 共cf. Fig. 6, 70 fs兲; its apparent recovery at longer times is mainly due to the build up of underlying two-photon signal at low eKE. There is also a contribution to the PE spectra from pump-induced RMPD processes 共Fig. 4兲, as can be seen in Fig. 8, which compares pump-probe spectra at long delay times with spectra in which the probe laser comes well before the pump laser. ˜ 2⌸ The two-color signal following excitation of the C g 2 ˜ ←X ⌸ u transition at 607 nm 共Fig. 6兲 is consistent with our previous study,6 though all features are now better resolved. Signal extending to ⬃2.5 eV is observed at the earliest delays, decaying by 1 ps. A sharp feature at ⬃0.85 eV is prominent at 70 fs, growing further by 1 ps, and subsequently decaying. Beyond 4 ps, no further evolution occurs. The pump-probe signal appears mainly as the difference between the black and gray curves in Fig. 8, i.e., as an unstructured shoulder between 0.55 and 1.0 eV. Pump-probe spectra obtained by excitation of the ˜ 2 ⌸ transition at 498 nm 共Fig. 7兲 show new pho2 2 ⌸ g ←X u todetachment features. A very short-lived, low-intensity feature, marked by a ⫹ in Fig. 7, is observed between 2.5 and 3.0 eV during the initial probe-only depletion. Subsequently, a pair of resolved peaks centered at 0.88 and 1.08 eV, observed initially near time zero, continue to grow until ⬃150 fs, after which they decay at comparable rates. At long times, the two-photon signal is similar in nature to that seen at 607 nm, though extending to somewhat higher eKE. IV. ANALYSIS A. Spectral assignments and time-scale analyses
The energetics and configurations of C6 ⫺ doublet electronic states below 3 eV are summarized in the lower half of Fig. 1. As pointed out in Sec. I, the term energies of these states were taken from a combination of experimental8,16,17 and theoretical18,19 studies. Amongst these states, only the
Downloaded 27 Aug 2004 to 130.37.129.78. Redistribution subject to AIP license or copyright, see http://jcp.aip.org/jcp/copyright.jsp
J. Chem. Phys., Vol. 121, No. 8, 22 August 2004
C6⫺ electronic relaxation dynamics
3519
FIG. 4. One-color femtosecond resonant multiphoton detachment 共fs-RMPD兲 of C6 ⫺ . Images and smoothed spectra, respectively: 共a兲 and 共c兲 607 nm; 共b兲 and 共d兲 498 nm.
˜B 2 ⌺ ⫹ state is optically inaccessible via one-photon absorpu tion, and it is the only state whose term energy has not been determined experimentally. The electron affinity 共EA兲 of linear C6 has been determined to be 4.180 eV using anion zero electron kinetic energy spectroscopy.15 A C6 共neutral兲 energy-level diagram, labeled with shorthand electronic configurations, is given in the upper portion of Fig. 1. Numerous excited states lying below the energetic neutral←anion detachment limit (h probe⫹h pump⫺EA) imposed in this experiment have been mapped and characterized with a combination of anion PE spectroscopy at 5.82 eV 共Ref. 29兲 and multireference doubles configuration interaction 共MRD-CI兲 calculations.30 As discussed previously,6 assignments of some of the higher-lying neutral excited states from the experimental PE spectrum29 of C6 ⫺ have been revised in light of electronic structure calculations30 performed after the experiment. Anion photodetachment from either ground or excited states is expected to be dominated by one-electron photodetachment transitions. The anion and neutral molecular orbital configurations in Fig. 1, based on the calculations by Botschwina18 and Peyerimhoff,19,30 show which neutral
states are thereby accessible from each anion state. While photodetachment from the anion ground state can access all neutral levels shown in Fig. 1, this is not the case for the anion excited states. The dashed arrows in Fig. 1 show the lowest neutral state accessible from each anion excited state. The neutral 1 3 ⌸ u,g states are the lowest that are accessible 1 ˜2 ⫹ from the anion ˜A 2 ⌺ ⫹ g and B ⌺ u states, while the 1 ⌸ u,g and ˜X 3 ⌺ ⫺ g states are the lowest-lying neutral levels acces˜ 2 ⌸ and 2 2 ⌸ C ⫺ , respectively. sible from C g g 6 The one-photon absorption and photodetachment spectra of C6 ⫺ from its ground state are generally dominated by ⌬⫽0 transitions for all transitions observed,8,16,17,29 indicating relatively small differences in nuclear geometry between the ground and excited anion/neutral states. If the anion and neutral vibrational frequencies are similar, ⌬⫽0 photodetachment transitions for even moderately vibrationally excited ions should occur close to eKE0-0 , the kinetic energy corresponding to photodetachment transition between anion and neutral vibrationless levels. This value can be determined using the energies in Fig. 1 according to Eq. 共1兲,
˜ ←X ˜ : experimental images obtained using a 607 nm⫹264 nm pump-probe scheme. Laser polarizations are mutually parallel, parallel to the FIG. 5. TRPEI—C detector, and are vertical, as indicated. Direct one-photon UV photodetachment contributions have been subtracted.
Downloaded 27 Aug 2004 to 130.37.129.78. Redistribution subject to AIP license or copyright, see http://jcp.aip.org/jcp/copyright.jsp
3520
Bragg et al.
J. Chem. Phys., Vol. 121, No. 8, 22 August 2004
˜ ←X ˜ excitation. An arrow inFIG. 6. TRPE spectra measured following C dicates the maximum allowable eKE with the color scheme employed.
0
eKE0-0 ⫽h probe⫺EAC6 ⫹ X T C ⫺ ⫺ Y T C0 , 6
6
共1兲
in which X T 0S represents the electronic term value for species S in its Xth electronic state. Table I lists eKE0-0 values computed from the referenced anion and neutral term values provided in Fig. 1; these eKE0-0 values are used below to guide assignment of observed photodetachment features. ˜ 2 ⌸ 0 0 relaxation dynamics B. C g
In Fig. 6, the earliest transient signal is the broad feature centered at 1.5 eV. This feature lies in the eKE range at ˜ 2 ⌸ state of which one anticipates detachment from the C g ⫺ 1 C6 to the 1 ⌸ u,g states of C6 共see Table I兲, and is assigned 共as before6兲 to photodetachment from the initially prepared
˜ excitation. An arrow indiFIG. 7. TRPE spectra measured following 2←X cates the maximum allowable eKE with the color scheme employed. ⫹ marks a high eKE 共2.5–3.0 eV兲 feature seen near time zero; * marks a low-intensity feature seen after time zero between 1.25 and 2.5 eV.
FIG. 8. ‘‘Pump-probe’’ photodetachment 共black兲 following excitation at 共a兲 607 nm (⌬ pu-pr⫽43.7 ps) and 共b兲 498 nm (⌬ pu-pr⫽18.7 ps) vs ‘‘probebefore-pump’’ 共gray, dotted兲 photodetachment.
˜ 2 ⌸ state. The sharp, transient feature at 0 0 level of the C g 0.85 eV is where the 1 3 ⌸ u,g ←C6 ⫺ ˜A 2 ⌺ ⫹ g photodetachment transition is anticipated 共cf. Table I兲. This feature is present between 70 fs and 1 ps, indicating that the ˜A 2 ⌺ ⫹ g state serves as an intermediate in the overall relaxation dynamics. No evolution of the pump-probe signal occurs beyond ⬃4 ps; at these long delays, pump-probe signal is most evident on the high eKE side of the probe-only signal between 0.5 and 1.0 eV 共see Fig. 8兲, and is attributed to highly vibrationally excited C6 ⫺ in its ground ˜X 2 ⌸ u electron state formed by in˜2 ternal conversion from the ˜A 2 ⌺ ⫹ g and C ⌸ g states. It thus appears that the overall relaxation dynamics involve three electronic states of C6 ⫺ : the initially prepared ˜ 2 ⌸ vibrationless level, the ˜A 2 ⌺ ⫹ state, and the ˜X 2 ⌸ C g u g state. We can gain more quantitative insight into these dynamics by integrating the signal associated with each state as a function of pump-probe delay. In order to monitor the ˜ 2 ⌸ state population, the integrated intensity between 1.25 C g and 2.50 eV is plotted as a function of temporal delay in Fig. 9共a兲, and fit to Eq. 共2兲, ˜ 共 t 兲 ⫽c exp兵 ⫺t/ ˜ 其 ⫹c , C 1 C 0
共2兲
with a lifetime C˜ of 620⫾30 fs. Transient ˜A 2 ⌺ ⫹ g population and subsequent decay are clocked according to the evolution
Downloaded 27 Aug 2004 to 130.37.129.78. Redistribution subject to AIP license or copyright, see http://jcp.aip.org/jcp/copyright.jsp
C6⫺ electronic relaxation dynamics
J. Chem. Phys., Vol. 121, No. 8, 22 August 2004
3521
TABLE I. eKE0-0 values for photodetachment of C6 ⫺ from low-lying electronic states with 264 nm 共4.70 eV兲, calculated with Eq. 共1兲 from the text and best-available electronic anion and neutral term values 共references for values listed in Fig. 1 caption兲. Parenthesized values give eKE0-0 for 498 nm 关1⫹1兴 photodetachment through 2 2 ⌸ g . Italicized values give electron kinetic energies following nominally disallowed, multielectron-active photodetachment transitions. Low-lying excited electronic states of C6 ⫺
Accessible electronic states of C6
2 2 ⌸ ag
˜ 2⌸ c C g
˜ 2 ⌺ ⫹b B u
˜ 2 ⌺ ⫹a A g
˜ 2⌸ X u
˜ 3 ⌺ ⫺1 X g
3.02 共0.80兲
2.56
¯
¯
0.52
˜a 1 ⌬ 1g
2.84 共0.63兲
2.40
¯
0.35
2.74 共0.53兲
2.30
¯
¯
¯
1.71
0.99
0.83
1.46
0.74
0.58
1 1 1
⌺ ⫹2 g 3 1 ⌸ g,u 1 1 ⌸ g,u 1
¯
of signal between 0.80 and 1.05 eV, encompassing the peak centered at 0.85 eV. Gated integration of this window versus pump-probe delay is plotted in Fig. 9共b兲 and has been fitted with Eq. 共3兲, ˜A 共 t 兲 ⫽a exp兵 ⫺t/ ˜ 其 ⫺a exp兵 ⫺t/ ˜ 其 ⫹a , 2 A 1 C 0
共3兲
in which ˜A corresponds to the population lifetime of the intermediate-lying state. With C˜ fixed to 620 fs, ˜A was determined to be 2300⫾200 fs. Finally, the ground state population was obtained by integrating the signal from 0.50 to 0.75 eV; this is plotted in Fig. 9共c兲 and fit to Eq. 共4兲, ˜X 共 t 兲 ⫽x ⫺x exp兵 ⫺t/ ˜ 其 ⫺x exp兵 ⫺t/ ˜ 其 , 0 2 A 1 C
共4兲
in which the time scales have been fixed to those found above, as both relaxation pathways are anticipated to end with population of highly vibrationally excited levels of the ground state. The time constants in Eqs. 共2兲–共4兲 are listed in Table II. The time scales and overall dynamical picture for relaxation ˜ 2 ⌸ vibrational origin are similar to those obtained of the C g in our earlier study of C6 ⫺ , but the transient state can now be definitively assigned as the ˜A 2 ⌺ ⫹ g state owing to the higher energy resolution in the TRPEI experiment. One point not addressed in the above analysis is the branching of the initial relaxation between the ˜A 2 ⌺ ⫹ g and ˜X 2 ⌸ states. The relative photodetachment cross sections u from these two states are unknown, so the branching cannot be assessed quantitatively. However, decay of the ˜A 2 ⌺ ⫹ g state is not accompanied by a significant increase in the ˜X 2 ⌸ state signal, i.e., x Ⰶx when fit to Eq. 共4兲. It thereu 2 1 fore appears that direct relaxation to the ground state dominates over relaxation via the ˜A 2 ⌺ ⫹ g state. C. 2 2 ⌸ g 0 0 relaxation dynamics
We next consider the TRPE spectra resulting from excitation of the 2 2 ⌸ g 0 0 level, starting with the very shortlived, weak feature between 2.5 and 3.0 eV. One would like to assign this to one-photon detachment out of the initially prepared 2 2 ⌸ g state. In fact, detachment from this state to the lowest three neutral levels of C6 should occur at eKE’s in the range 3.02–2.74 eV 共see Table I兲, consistent with such an assignment. One must question whether this feature is a real resonant pump-probe feature, given its low intensity. In fact,
¯
0.25 ¯
¯
a peak at the corresponding eKE is also seen in the RMPD spectrum at 498 nm 关Fig. 4共d兲兴; the small peak at ⬃550 meV is at the correct eKE for 关1⫹1兴 detachment out of the 2 2 ⌸ g state at this wavelength when compared to the eKE observed for 关1⫹1⬘兴 detachment. Given that one and two-color experiments show essentially the same weak feature, we are confident it is actually present and corresponds to a resonant process. The next features of interest are the pair of relatively sharp transient peaks at 0.88 and 1.08 eV. These are also seen at the earliest delay times but persist longer than the feature from the 2 2 ⌸ g state. The two peaks are quite close to the eKE values expected for transitions from the ˜A 2 ⌺ ⫹ g and ˜B 2 ⌺ ⫹ states to the 1 3 ⌸ states of C ; according to Table g,u 6 u I, the two ⌬ v ⫽0 transitions should occur at 0.83 and 0.99 eV, respectively. There are also smaller features at slightly lower eKE’s that may arise through transitions from the two anion states to the higher-lying 1 1 ⌸ g,u states, but this correspondence is less definitive. Finally, the long-time signal is attributed to photodetachment from the vibrationally excited ˜X 2 ⌸ state of C ⫺ . u 6 Following the procedure in Sec. IV B, signal in selected eKE regions is integrated as a function of time to track energy flow through the various anion electronic states. The results are shown in Fig. 10共a兲 for long delay times and in Fig. 10共b兲 for shorter delays. Population was monitored in the 2 2 ⌸ g state by integrating electron signal from 2.50 to ˜2 ⫹ 3.00 eV, the ˜B 2 ⌺ ⫹ u state from 0.99 to 1.20 eV, the A ⌺ g state from 0.78 to 0.95 eV, and the ˜X 2 ⌸ u state from 0.58 to 0.76 eV. Finally, gated integration between 1.25 and 2.50 eV 共centered on the * in Fig. 7兲 has been performed to identify ˜ 2 ⌸ state; there does appear ‘‘trace’’ accumulation in the C g to be non-negligible time-dependent signal in this region, as shown in Figs. 10共a兲 and 10共b兲. In Fig. 10共b兲, electron signals associated with the 2 2 ⌸ g ˜ 2 ⌸ states are compared to a 200 fs FWHM Gaussian and C g 共dashed line兲 representing the approximate cross correlation of pump and probe laser pulses. Signal intensity from 2 2 ⌸ g is limited to the laser cross correlation, and is estimated to be ˜ 2⌸ , a sub-100 fs process. Notably, the intensity in the C g ˜B 2 ⌺ ⫹ , and ˜A 2 ⌺ ⫹ states rises on a comparable time scale, g u reaching a maximum by ⬃150 fs. For this reason only signal decay has been fit for each integrated spectral window 共gray
Downloaded 27 Aug 2004 to 130.37.129.78. Redistribution subject to AIP license or copyright, see http://jcp.aip.org/jcp/copyright.jsp
3522
Bragg et al.
J. Chem. Phys., Vol. 121, No. 8, 22 August 2004
through the bright state decay, with negligible increase there˜ 2 ⌸ ←X ˜ 2⌸ after, similar to the rise observed following C g u excitation 共see previous discussion兲; this observation regarding the relaxed ground state photodetachment signal is highlighted by the overlaid ‘‘s-curve,’’ which approaches its maximum value by ⬃150 fs, and indicates that relaxation favors direct decay to the anion ground state. All relaxation time scales are summarized in Table II. Finally, the transient signal from relaxation of the ini⫺ tially prepared 2 2 ⌸ g locates the ˜B 2 ⌺ ⫹ experimenu of C6 tally for the first time. The transient peak at eKE⫽1.08 eV is assigned to the C6 1 3 ⌸ u,g ←C6 ⫺ ˜B 2 ⌺ ⫹ u photodetachment transition. The term value of the ˜B 2 ⌺ ⫹ state is then given by u ⫺
0
T ˜B ⫽EA⫹eKE⫹T 3 ⫺h probe ,
共5兲
⌸
⫺ 0 in which T 3 and T ˜B represent the neutral ⌸ and anion ˜B ⌸
0
term values, respectively. From Fig. 1, T 3 ⫽0.849 ⌸ ⫾0.040 eV for one or both of the nearly degenerate 1 3 ⌸ u,g ⫺ neutral states. Using h probe⫽4.70 eV, we find T ˜B ⫽1.41 ⫾0.05 eV, where the measurement uncertainty has been estimated based on the FWHM of the probe laser bandwidth and the 1 3 ⌸ u,g term value uncertainty. This value lies close to values of 1.32 and 1.34 eV previously reported18,19 in ab initio studies. D. Angular distributions
The PADs in the pump-probe experiments were fit to the standard expression,31 I 共 t; , ⑀ 兲 ⬀1⫹  2 共 ⑀ 兲 P 2 共 cos 兲 ⫹  4 共 ⑀ 兲 P 4 共 cos 兲 ,
˜ ←X ˜ : 共a兲 C ˜ , 共b兲 FIG. 9. Integrated photodetachment intensities vs delay—C ˜A , and 共c兲 vibrationally hot X ˜ states; data are overlaid with fitting curves 共dashed兲. Details regarding spectral gate widths and fitting procedures are outlined in the text.
lines兲 in accordance with Eq. 共2兲. Decay lifetimes for the ˜ 2 ⌸ , ˜B 2 ⌺ ⫹ , and ˜A 2 ⌺ ⫹ state windows decay with firstC g u g order lifetimes of 560⫾70, 1860⫾140, and 2350⫾200 fs. Growth of signal intensity within the gate encompassing relaxed ground state detachment features occurs largely
共6兲
where P n (cos ) represents the nth-order Legendre polynomial, is the polar angle between the photoelectron recoil vector and the laser polarization direction, and  n ( ⑀ ) corresponds to the nth PAD anisotropy parameter for photoelectrons generated with kinetic energy ⑀. These were fitted for each angular distribution as a function of pump-probe delay using the spectral gates assigned to each detachment feature. For each detachment transition, the fitted values exhibited noticeable scatter with time, though no statistically significant variation as a function of time. We thus report only the time-averaged values of the anisotropy parameters, which are listed in Table III with anisotropy values (  2 ) for direct UV photodetachment of the ground state ion. In all cases measurement uncertainties have been determined from consideration of multiple images/measurements. In all cases the mean  4 ’s were ⬃0.0, and are not considered here. The  2 param-
TABLE II. Relaxation time scales of bright and nascent populated transient states 共left to right兲 following ˜ 2 ⌸ ←X ˜ 2 ⌸ and 2 2 ⌸ ←X ˜ 2 ⌸ 0 0 transitions. Details of time-scale analyses are given in excitation of the C g u g u 0 the text. Subsequently populated states Initial states
2 2⌸ g
˜ 2⌸ C g
˜ 2⌺ ⫹ B u
˜ 2⌺ ⫹ A g
˜ 2⌸ 0 0 C g
¯
620⫾30fs
¯
2300⫾200fs
2 ⌸g 0
⬍100 fs
560⫾70fs
1860⫾140 fs
2350⫾200fs
2
0
Downloaded 27 Aug 2004 to 130.37.129.78. Redistribution subject to AIP license or copyright, see http://jcp.aip.org/jcp/copyright.jsp
C6⫺ electronic relaxation dynamics
J. Chem. Phys., Vol. 121, No. 8, 22 August 2004
3523
˜ : 共a兲 full range, 2 is plotted with an estimated temporal pulse cross correlation 共200 fs FWHM, gray兲; C ˜, B ˜, FIG. 10. Integrated intensities vs delay—2←X ˜ is plotted with an ‘‘s-curve’’ growth function 共gray兲. Fit details are given in the text. 共b兲 and ˜A are plotted with first-order exponential decays 共gray兲; X ˜ are plotted with a 200 fs FWHM Gaussian 共dashed兲. Early-delay 共⬍⬃1 ps兲: 2 and C
eters are all positive but small 共⬍0.3兲, corresponding to nearly isotropic PADs and limiting, in this particular instance, their utility towards differentiating overlapping detachment transitions.
V. DISCUSSION
Our results on C6 ⫺ can be summarized as follows. At a ˜ 2 ⌸ ←X ˜ 2⌸ 0 0 pump wavelength of 607 nm, where the C g u 0
˜ 2⌸ TABLE III. Time-averaged photodetachment anisotropy parameters (  2 ) obtained following 2 2 ⌸ g ←X u ˜ 2 ⌸ ←X ˜ 2 ⌸ 共parenthesized兲 excitation. Italicized values were measured for one共nonparenthesized兲 and C g u photon photodetachment from the ˜X 2 ⌸ u ground state. Neutral electronic states
Anion electronic states
˜ 3 ⌺ ⫺ /a ˜ 1⌺ ⫹ ˜ 1 ⌬ g /b X g u
1 3 ⌸ u,g
1 1 ⌸ u,g
2 2⌸ g
0.16⫾0.08
¯
¯
˜ 2⌸ C g
¯
¯
0.15⫾0.05 共0.15⫾0.10兲
˜B 2 ⌺ ⫹ u
¯
0.24⫾0.06
¯
˜A 2 ⌺ ⫹ g
¯
0.15⫾0.06 共0.29⫾0.06兲
¯
˜X 2 ⌸ u
0.14⫾0.05 共0.18⫾0.06兲; 0.18⫾0.02/ 0.13⫾0.05/ ⫺0.02⫾0.07
¯
¯
Downloaded 27 Aug 2004 to 130.37.129.78. Redistribution subject to AIP license or copyright, see http://jcp.aip.org/jcp/copyright.jsp
3524
J. Chem. Phys., Vol. 121, No. 8, 22 August 2004
˜ 2 ⌸ state undergoes parallel detransition is excited, the C g ˜2 cay to the ˜A 2 ⌺ ⫹ g and X ⌸ u states with a time constant of 620 fs, while the ˜A 2 ⌺ ⫹ g state subsequently decays to the ˜X 2 ⌸ state with a lifetime of 2300 fs. At 498 nm, where the u ˜ 2 ⌸ state is excited, the 2 2 ⌸ state decays on a 2 2 ⌸ g ←X u g time scale too fast to measure with our instrumentation. This decay is accompanied by a nearly instantaneous rise in the lower-lying excited states and ground state of C6 ⫺ , with the excited states then decaying to the ground state with time constants ranging from 560 to 2300 fs. At both wavelengths, direct relaxation to the ground state dominates over the indirect pathways through intermediate excited states. ˜ 2⌸ The relaxation mechanism for the 0 0 level of the C g 6 state is similar to that put forth in our earlier paper, though the current study provides more details into the dynamics. The improved resolution of the TRPEI setup shows that re˜2 ⫹ laxation occurs via the ˜A 2 ⌺ ⫹ g state but not the B ⌺ u state. The origin of this selectivity is of considerable interest, since the initially prepared bright state can be vibronically coupled ˜2 ⫹ to either the ˜A 2 ⌺ ⫹ g or B ⌺ u states through g or u bending modes, respectively, both of which are present in C6 ⫺ . ˜ 2 ⌸ and ˜A 2 ⌺ ⫹ While a conical intersection between the C g g states could favor relaxation through the ˜A 2 ⌺ ⫹ g state, the ˜2 ⫹ calculated equilibrium geometries18 of the ˜A 2 ⌺ ⫹ g and B ⌺ u ˜ 2⌸ states are nearly identical and quite close to that of the C g 2 ˜ state, so it is unlikely that the C ⌸ g state undergoes a coni˜2 ⫹ cal intersection with either the ˜A 2 ⌺ ⫹ g or B ⌺ u states anywhere near its minimum energy structure where the 0 0 vibrationless level is localized. On the other hand, the density ˜ 2 ⌸ 0 0 state is of vibrational levels isoenergetic to the C g 2 ⫹ ˜ about a factor of 5 higher for the A ⌺ g state than for the 6 higher-lying ˜B 2 ⌺ ⫹ u state. A feature in the TRPE spectra one fifth the size of the transient ˜A 2 ⌺ ⫹ g state feature would be difficult to observe here, and so this simple density-of-states consideration may explain our results. The pump-probe experiments at 498 nm pump wavelength provide new insight into a less well-characterized region of the C6 ⫺ electronic absorption spectrum. In a matrix absorption experiment, Maier and co-workers16 assigned a weak band with an origin at 498 nm 共2.49 eV兲 to the ˜ 2 ⌸ transition. The only theoretical work on the 2 2 ⌸ g ←X u upper state was carried out by Cao and Peyerimhoff,19 who calculated vertical transition energies for this and many other electronic transitions in C6 ⫺ . They calculated the 2 2 ⌸ g ˜ 2 ⌸ transition to lie at 2.84 eV, but found the lowest ←X u quartet state of C6 ⫺ , the 1 4 ⌸ g state, to lie 2.50 eV above the ˜X 2 ⌸ ground state. As a result, they suggested that the exu perimental band was misassigned and may have been the ˜ 2 ⌸ transition. Our results and spin-forbidden 1 4 ⌸ g ←X u analysis in Figs. 7 and 10 show that the upper state undergoes extremely rapid radiationless decay 共⬍100 fs兲 to lowerlying doublet states. Such rapid dynamics would be unprecedented for a spin-forbidden relaxation pathway and support the original experimental assignment of the 498 nm band. The relaxation dynamics of the 2 2 ⌸ g 0 0 level exhibit ˜ 2 ⌸ state. In both parallels and differences relative to the C g cases, the decay time of the initially prepared state matches,
Bragg et al.
to within experimental resolution, the rise time of populations in the lower-lying doublet states. However, the lifetime of the 2 2 ⌸ g state is significantly shorter than that of the ˜ 2 ⌸ state; we can only place an upper bound of ⬃100 fs C g on its decay time and the associated rise times in the lowerlying states. The 2 2 ⌸ g state relaxes via both the ˜A 2 ⌺ ⫹ g and ˜B 2 ⌺ ⫹ states; the state-selective effect observed following u ˜ 2 ⌸ ←X ˜ 2 ⌸ excitation is absent. Finally, Table II shows C g u ˜ 2 ⌸ and ˜A 2 ⌺ ⫹ transients are that the decay times for the C g g essentially the same at the two pump wavelengths. This result indicates that the additional ⬃0.5 eV of vibrational energy available to both states at 498 nm has little effect on their lifetimes. A detailed explanation of the 2 2 ⌸ g state relaxation dynamics is difficult in the absence of more information about its electronic structure and equilibrium geometry. Cao19 char˜ 2 ⌸ transition as a 4 ←2 moacterizes the 2 2 ⌸ g ←X u g u lecular orbital 共MO兲 promotion. As a result 共see Fig. 1兲, the MO occupancies of the 2 2 ⌸ g state differ from those of the ˜A 2 ⌺ ⫹ , ˜B 2 ⌺ ⫹ , and C ˜ 2 ⌸ states by two electrons, which g g u would normally result in weak coupling and hence slow radiationless transitions. The very rapid relaxation to these states may result from significant configuration interaction ˜ 2 ⌸ states. between the 2 2 ⌸ g and C g The time scales extracted from the pump-probe experiments for relaxation to the ground state are of use in understanding the fs-RMPD photoelectron spectra in Fig. 4. The monotonically decreasing signal towards higher eKE 关except for the small maximum at 0.55 eV in Fig. 4共d兲兴 is suggestive of the cluster analog of thermionic emission. This emission process involves the statistical evaporation of an electron from a cluster in which excitation energy has been randomized amongst all internal degrees of freedom.32–34 This phenomenon has been observed in resonant multiphoton excitation of carbon cluster anions using nanosecond lasers8 and single photon detachment of metal cluster and larger carbon cluster anions,9,20,35 and has been implicated in the autodetachment dynamics of excited dimeric-core (OCS) ⫺ n and 36 –38 clusters. (CS2 ) ⫺ n In the previous ns-RMPD experiments on C6 ⫺ , the observation of thermionic emission was explained in terms of sequential absorption and thermalization events.8 In the pro˜ 2⌸ posed mechanism, resonant excitation of the C g 2 ˜ ←X ⌸ u transition is followed by internal conversion to the ground state. The vibrationally hot ion subsequently absorbs additional photons, relaxing vibronically between absorption events, until a sufficient number of photons 共three total at 607 nm兲 have been absorbed for electron emission to be energetically feasible. This mechanism requires that internal conversion is rapid on the time scale of the nanosecond laser pulse. The observation of thermionic emission in fs-RMPD spectra is consistent with the ultrafast internal conversion dynamics observed in two-color time-resolved investigations, as it implies that the time constant for internal conversion is comparable to the laser pulse duration of ⬃100 fs. At 498 nm, internal conversion to the ground state is sufficiently rapid to satisfy this condition. At 607 nm, however, internal
Downloaded 27 Aug 2004 to 130.37.129.78. Redistribution subject to AIP license or copyright, see http://jcp.aip.org/jcp/copyright.jsp
C6⫺ electronic relaxation dynamics
J. Chem. Phys., Vol. 121, No. 8, 22 August 2004
conversion to the ground state occurs with a time constant of 620 fs, considerably longer than the laser pulse, implying that the sequential absorption/thermalization mechanism is less efficient at this wavelength. Indeed, the intensity of the RMPD signal at 607 nm is considerably lower than at 498 nm at comparable laser pulse energies, despite a significantly larger absorption cross section at 607 nm. Additionally, while only two photons at 498 nm are needed to detach an electron, the eKE distribution in Fig. 4共d兲 extends well beyond the energetic limit for two-photon absorption 共0.80 eV兲, indicating a substantial amount of three-photon absorption. This observation implies that after two photons at 498 nm have been absorbed, the time constant for thermionic emission must be comparable to or longer than the laser pulse width, thus facilitating absorption of a third photon prior to electron emission.
VI. CONCLUSIONS
Time-resolved photoelectron imaging has been used to characterize the relaxation dynamics of C6 ⫺ electronically ˜ 2 ⌸ ←X ˜ 2 ⌸ 0 0 and 2 2 ⌸ excited through the C g u 0 g 0 2 ˜ ←X ⌸ u 0 0 transitions. Relaxation from the 2 2 ⌸ g 0 0 level ˜ 2 ⌸ 0 0 level 共⬍100 fs veris substantially faster than the C g sus 620 fs兲. The increased resolution available for this investigation relative to a previous study6 yields a more detailed assignment of the electronic states participating in the ensuing electronic relaxation pathway. In both cases, parallel relaxation pathways are observed; the initially excited state relaxes directly to the ground state and also to lower-lying excited states, which then relax more slowly to the ground state. The direct pathway dominates for both initially excited ˜ 2⌸ 0 0 states. The indirect pathway for relaxation from the C g state involves only the ˜A 2 ⌺ ⫹ g state; no population in the close-lying ˜B 2 ⌺ ⫹ u state is seen at any time. In contrast, the indirect pathway from the 2 2 ⌸ g 0 0 level results in transient population of all lower-lying excited doublet states. In particular, a transient feature assigned to the ˜B 2 ⌺ ⫹ u state yields the first experimental term value for this state, 1.41⫾0.05 eV. Finally, one-color, resonant multiphoton detachment at the pump wavelengths corresponding to the two electronic transitions yields PE spectra characteristic of thermionic emission, consistent with a previously proposed model8 in which sequential absorption and relaxation cycles lead to a vibrationally hot anion cluster from which the excess electron evaporates. This study highlights the advantages of anion TRPEI relative to older time-resolved anion PES methods. This technique may be further applied to investigate electronic relaxation dynamics following excitation of analogous species, such as ‘‘odd-numbered’’ carbon clusters and the hydrides of these species, in which electronic states are more sparse,7 perhaps leading to divergent dynamics from those observed. Yet this technique may be applied more generally than to the case of relaxation following excitation between discrete molecular levels. For example, as mentioned in the Introduction, TRPES has been applied to the study of relaxation dynamics in transition metal cluster anions, revealing
3525
near-bulk relaxation time scales reflective of high electronic state densities. However no time-resolved studies have directly observed, in progression, the consequence of a gradual transition from molecular to ‘‘bulklike’’ properties on the electronic relaxation dynamics of size-selected clusters. Such a study would provide a much desired link to understand the evolution of material properties with increased degree of aggregation and is one of our current research goals. ACKNOWLEDGMENTS
This research is supported by the National Science Foundation under Grant No. DMR-0139064. A.K. was supported by the Abramson Graduate Fellowship in Chemistry. A. Stolow, A. E. Bragg, and D. M. Neumark, Chem. Rev. 共Washington, D.C.兲 104, 1719 共2004兲. 2 A. Assion, M. Geisler, J. Helbing, V. Seyfried, and T. Baumert, Phys. Rev. A 54, R4605 共1996兲. 3 S. Ullrich, T. Schultz, M. Z. Zgierski, and A. Stolow, J. Am. Chem. Soc. 126, 2262 共2004兲. 4 N. Pontius, P. S. Bechthold, M. Neeb, and W. Eberhardt, Phys. Rev. Lett. 84, 1132 共2000兲. 5 S. Minemoto, J. Mu¨ller, G. Gantefo¨r, H. J. Mu¨nzer, J. Boneberg, and P. Leiderer, Phys. Rev. Lett. 84, 3554 共2000兲. 6 C. Frischkorn, A. E. Bragg, A. V. Davis, R. Wester, and D. M. Neumark, J. Chem. Phys. 115, 11185 共2001兲. 7 J. P. Maier, Chem. Soc. Rev. 26, 21 共1997兲. 8 Y. Zhao, E. de Beer, C. Xu, T. R. Taylor, and D. M. Neumark, J. Chem. Phys. 105, 4905 共1996兲. 9 B. Baguenard, J. C. Pinare´, F. Le´pine, C. Bordas, and M. Broyer, Chem. Phys. Lett. 352, 147 共2002兲. 10 A. Van Orden and R. J. Saykally, Chem. Rev. 共Washington, D.C.兲 98, 2313 共1998兲. 11 W. Weltner and R. J. Van Zee, Chem. Rev. 共Washington, D.C.兲 89, 1713 共1989兲. 12 K. Raghavachari and J. S. Brinkley, J. Chem. Phys. 87, 2191 共1987兲. 13 H. W. Kroto, J. R. Heath, S. C. O’Brien, R. F. Curl, and R. E. Smalley, Nature 共London兲 318, 162 共1985兲. 14 D. W. Arnold, S. E. Bradforth, T. N. Kitsopoulos, and D. M. Neumark, J. Chem. Phys. 95, 8753 共1991兲. 15 C. C. Arnold, Y. X. Zhao, T. N. Kitsopoulos, and D. M. Neumark, J. Chem. Phys. 97, 6121 共1992兲. 16 P. Freivogel, M. Grutter, D. Forney, and J. P. Maier, J. Chem. Phys. 107, 22 共1997兲. 17 D. Forney, J. Fulara, P. Freivogel, M. Jakobi, D. Lessen, and J. P. Maier, J. Chem. Phys. 103, 48 共1995兲. 18 S. Schmatz and P. Botschwina, Chem. Phys. Lett. 235, 5 共1995兲. 19 Z. Cao and S. D. Peyerimhoff, J. Phys. Chem. A 105, 627 共2001兲. 20 B. Baguenard, J. C. Pinare´, C. Bordas, and M. Broyer, Phys. Rev. A 63, 023204 共2001兲. 21 E. Surber and A. Sanov, J. Chem. Phys. 116, 5921 共2002兲. 22 A. V. Davis, R. Wester, A. E. Bragg, and D. M. Neumark, J. Chem. Phys. 118, 999 共2003兲. 23 A. E. Bragg, R. Wester, A. V. Davis, A. Kammrath, and D. M. Neumark, Chem. Phys. Lett. 376, 767 共2003兲. 24 D. L. Osborn, D. J. Leahy, D. R. Cyr, and D. M. Neumark, J. Chem. Phys. 104, 5026 共1996兲. 25 A. T. J. B. Eppink and D. H. Parker, Rev. Sci. Instrum. 68, 3477 共1997兲. 26 O. Cheshnovsky, S. H. Yang, C. L. Pettiette, M. J. Craycraft, and R. E. Smalley, Rev. Sci. Instrum. 58, 2131 共1987兲. 27 W. C. Wiley and I. H. McLaren, Rev. Sci. Instrum. 26, 1150 共1955兲. 28 V. Dribinski, A. Ossadtchi, V. A. Mandelshtam, and H. Reisler, Rev. Sci. Instrum. 73, 2634 共2002兲. 29 C. Xu, G. R. Burton, T. R. Taylor, and D. M. Neumark, J. Chem. Phys. 107, 3428 共1997兲. 30 M. Hanrath, S. D. Peyerimhoff, and F. Grein, Chem. Phys. 249, 121 共1999兲. 31 K. L. Reid, Annu. Rev. Phys. Chem. 54, 397 共2003兲. 32 C. E. Klots, Chem. Phys. Lett. 186, 73 共1991兲. 1
Downloaded 27 Aug 2004 to 130.37.129.78. Redistribution subject to AIP license or copyright, see http://jcp.aip.org/jcp/copyright.jsp
3526 33
Bragg et al.
J. Chem. Phys., Vol. 121, No. 8, 22 August 2004
E. E. B. Campbell and R. D. Levine, Annu. Rev. Phys. Chem. 51, 65 共2000兲. 34 J. U. Andersen, E. Bonderup, and K. Hansen, J. Phys. B 35, R1 共2002兲. 35 H. Weidele, D. Kreisle, E. Recknagel, G. S. Icking-Konert, H. Handschuh,
G. Gantefo¨r, and W. Eberhardt, Chem. Phys. Lett. 237, 425 共1995兲. E. Surber and A. Sanov, Phys. Rev. Lett. 90, 093001 共2003兲. 37 E. Surber and A. Sanov, J. Chem. Phys. 118, 9192 共2003兲. 38 R. Mabbs, E. Surber, and A. Sanov, The Analyst 128, 765 共2003兲. 36
Downloaded 27 Aug 2004 to 130.37.129.78. Redistribution subject to AIP license or copyright, see http://jcp.aip.org/jcp/copyright.jsp