Cache Simulation Based on Runtime Instrumentation for OpenMP Applications Jie Tao† and Josef Weidendorfer†† †
Institut f¨ur Rechnerentwurf und Fehlertoleranz Universit¨at Karlsruhe 76128 Karlsruhe, Germany
[email protected]
††
Lehrstuhl f¨ur Rechnertechnik und Rechnerorganisation Institut f¨ur Informatik, Technische Universit¨at M¨unchen 85748 Garching, Germany
[email protected]
Abstract
the middle. Performance tools, like automatic performance analyzer and performance data visualizer, are used for tuning cache performance, while hardware monitors trace the memory traffic and supply the needed information for tools to do their work. The middleware between them provides an interface for requesting monitoring data. Since the core of this infrastructure, the hardware monitor, is still under development, a simulation environment is essential that is capable of offering accurate performance data like the hardware monitors and allowing the earlier development of performance tools and optimization techniques.
To enable optimizations in memory access behavior of high performance applications, cache monitoring is a crucial process. Simulation of cache hardware is needed in order to allow research for non-existing cache architectures, and on the other hand, to get more insight into metrics not measured by hardware counters in existing processors. One focus of EP-Cache, a project investigating efficient programming on cache architectures, is on developing cache monitoring hardware to give precise information about the cache behavior of OpenMP applications on SMP machines. As the hardware is still in an early state of development, getting experience with the monitoring software infrastructure to be built for use in real applications requires cache simulation. Two techniques are used for the cache simulation engine: driven by instrumentation integrated at source level and instrumentation integrated at runtime by rewriting code onthe-fly. In this paper, we mainly describe the second technique together with a sample code, showing the advantages and feasibility of this approach. Additionally, in order to allow a comparison, we also give a brief description of the experience with the source instrumentation technique.
A critical issue concerning simulation is the instrumentation technique. In the case of our source instrumentation with Augmint [12], the assembler code, generated by the compiler for a program, is parsed and modified. For each memory reference a simulator call is inserted to switch the control between target application execution and simulation processing. However, this approach is limited to special compilers and architectures, due to the assembler format which has to be parsed. Additionally, as the runtime part of Augmint uses its own thread model different from POSIX threads, we can not use the OpenMP functionality of the compilers which rely on POSIX threads, but need our own OpenMP implementation in form of the source-to-source translator ADAPTOR [1]. Augmint is not capable of instrumenting existing library code. It has to be assumed that cache pollution triggered by library calls only has minimal influence on simulation results.
1 Introduction
In contrast, runtime instrumentation covers all the code being executed, and does not depend on the compiler. The Valgrind runtime instrumentation framework [11] enables us to easily integrate this approach. Together with the support of POSIX threads by Valgrind, OpenMP implementations of different compilers can be compared. Another benefit is the support of the new multimedia instruction extensions generally found in Pentium III/IV (SSE/SSE2), which
EP-Cache1 is a project aiming at providing a hybrid monitoring infrastructure (consisting of hard- and software components) for optimizing the cache access behavior of realistic OpenMP applications. This well-layered infrastructure comprises performance tools at the top level, hardware monitors on the bottom, and multilevel interfaces in 1 More
information at http://www.gmd.de/SCAI/EP-CACHE/.
1
Augmint currently can not handle. In the next section, we will give some details on the two instrumentation techniques used within the EP-Cache project. Afterwards, the cache simulator and adaptations needed for runtime instrumentation are presented. This is followed by a description of the software infrastructure for processing performance data acquired by the simulator. In Section 5, some experimental results in relation with a sample benchmark code are illustrated. Section 6 discusses related work. Finally, several directions for future research regarding the monitoring infrastructure are laid out.
simulation toolkit for Intel x86 multiprocessor architectures. In order to generate memory references and synchronization events for modeling the target systems, it deploys a source-level instrumentor called Doctor. Doctor is used to insert additional instructions at the memory reference points to create memory access events. It takes as input an assembly code with required semantics and outputs an augmented assembly language file. Since compilers use different semantics for generating assembly codes, Doctor does not work on top of all compilers. This indicates that source-level instrumentation relies on compilers and can not be generally used for flexible simulation tools.
2 Instrumentation Techniques 2.2 Runtime Instrumentation Performance characteristics of applications can only be partly observed from the outside, especially if hardware access is not given. Even then, any observed data has to be attributed to some source level code position or data structure to be useful for the application developer. Therefore, instrumentation for performance analysis usually produces application related metrics while the application is running, optionally relates this to measurements from monitoring hardware, does some preprocessing of observed data, and dumps the data to the outside world. Instrumentation has to be present when executing the program, but can be added at different phases, namely: • manually to application source (by the application programmer), • manually to library code the application uses, • automatically by rewriting source code, • automatically by rewriting compiled code, • automatically by patching compiled code at runtime directly before execution. The methods changing object code are platform dependent in contrast to source code rewriting, since the instruction stream for a given processor has to be parsed and extended.
2.1 Source Level Instrumentation Source instrumentation is usually done within the application source code and is commonly used for acquiring performance data. A special, architecture dependent version of source instrumentation is done within compiled assembly code, and is generally used in the research area of simulation for generating events of interest. Augmint [12] is a well-known example for using sourcelevel instrumentation. Augmint is a fast execution driven
Runtime instrumentation always produces some overhead while running an application, and it destroys the original partitioning of wallclock time to execution time of single code ranges of the original application. However, it is adequate for driving hardware simulations, where wallclock time is not used at all. In addition, runtime instrumentation directly works with unmodified executables, hence does not rely on compilers and in some cases the programming models. An example of such a runtime instrumentation tool is Valgrind. Valgrind [11] is a CPU emulator, running mostly in a main loop which is executing instrumented versions of code ranges from the target program to be supervised. The code range granularity is at basic block level, i.e. control flow statements only happen at the end of the code pieces. The exact instrumentation depends on the use case and can be specified in custom plugins, called skins. For a code range to be executed next from the target program, and if no instrumented version exists in Valgrind’s instrumentation cache, it goes through the following steps: 1. parse the IA-32 instructions and translate them to a virtual RISC instruction set, 2. let the custom instrumentation function insert additional instructions into the RISC instruction sequence (e.g. calls to C functions), 3. retranslate into IA-32 and put it into the instrumentation cache. After this, the new instrumented code range is executed immediately. The RISC instruction set is chosen for comfortable instrumentation possiblities: There is no limit on the number of virtual registers available, and special treatment of memory accesses needs checking of a few instructions only in contrast to the large number of IA-32 instructions which possibly involve memory accesses.
3 Flexible Cache Simulation for OpenMP
3.2 The Independent Simulator
As described, an OpenMP simulation and monitoring environment is needed for the EP-Cache project. Our first approach for this is based on source-level instrumentation, together with an existing multiprocessor simulation tool based on Augmint. The second approach is based on Valgrind and does therefore not rely on compilers. It is hence currently used within this project for acquiring performance data.
The cache simulator based on Augmint is capable of providing valuable performance data about the runtime memory accesses of OpenMP programs. However, it is specific for ADAPTOR and the Intel Fortran compiler ifc [9] due to Doctor. In order to provide an OpenMP cache simulator of general purpose, we chosed Valgrind in the second step of this research work. Actually, Valgrind itself contains a cache simulator, which supports two cache hierarchy levels with fixed write back behavior and LRU replacement policy. However, this simulator does not model SMPs, but uniprocessor systems. In order to enable this, we had to integrate the memory hierarchy simulator of SIMT into Valgrinds supervision process.
3.1 The Initial Approach The first version of the cache simulator is built on top of a self-developed simulation system called SIMT [14]. SIMT is a multiprocessor simulator modeling the parallel execution of applications on shared memory machines. As it focuses on the research work in the area of the memory system, it contains a detailed simulator modeling the complete memory hierarchy including caches with arbitrary levels and various cache coherence protocols. In addition, it simulates hardware monitors that can be connected to any level of the memory hierarchy and that are capable of tracing full access histograms. Based on these monitoring facilities, SIMT provides accurate information about runtime accesses, enabling users to analyze the memory and cache access behavior of applications and further to optimize them resulting in better performance. SIMT uses Augmint as frontend for generating memory references and hence relies on Augmint’s mechanisms which introduces some limitations. One limitation is caused by Augmint’s instrumenter Doctor that depends on compilers that generate assembly codes. Another limitation comes from Augmint’s thread modeling mechanism. Augmint does not simulate standard thread libraries, like the POSIX threads which is used by most shared memory programming models. Rather it uses its own thread structure to model user-level threads. Correspondingly, applications have to use specific macros to express parallelism within the source code. This limitation also exists within SIMT, since SIMT directly applies the thread structure of Augmint. Hence, SIMT depends on programming models, and OpenMP directives can not be simulated by SIMT. In order to tackle this problem, we had to modify the OpenMP library of the project compiler ADAPTOR [1], a source-to-source Fortran OpenMP compiler, in order to translate the OpenMP parallel pragmas to Augmint-specific macros. In addition, mechanisms with respect to threads scheduling and synchronizations had to be modified as well. In this way, an OpenMP simulation environment has been established.
Fortunately, SIMT provides a simple interface between its frontend, the memory reference generator, and the memory hierarchy simulator. This interface consists of the functions that implement the detailed operations of memory access in caches and the main memory. These functions are called by the frontend when an event is generated. For example, when a read event is generated, the function sim read() is called and when a write event is generated, sim write() is called. To switch the frontend from Augmint to Valgrind, these functions have been rewritten forming a pure interface not relying on the runtime environment of Augmint. On the side of Valgrind, the instrumentation plugin MemAccess has been developed as a bridge to the SIMT cache simulator. MemAccess traps all memory accesses performed at runtime during the execution and then calls application defined handlers, in our use case the SIMT functions. Handlers are linked into the target application, but are not target to instrumentation themselve, as they are registered with the Valgrind layer to be called directly when memory access events happen. The communication mechanism between an target application and Valgrind core is called Client Request: by using a C macro, a special no-op instruction sequence is compiled into target code, detectable by the Valgrind instrumentor and leading to a call into a skin supplied function. Thus, if an application is executed without MemAccess, no handlers will be called, i.e. no events are generated for the cache simulator. The basic client request of MemAccess is the registration of the handler functions to be called on memory accesses. Actual notification has to be explicitly switched on or off by another client request. The handler functions, which include the cache simulator, fill up event buffers depending on monitoring configuration. For these buffers to be read by the upper monitoring layer, which is target to instrumentation, the notification has to be switched off temporarily.
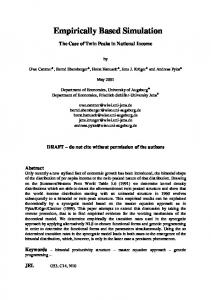
User Application Performance Visualisation Tools
MRI ePAPI Histogram Chain Monitor Control Component
Ring Buffers
Low Level Monitor API Software Hardware Monitor 0 CPU 0
Monitor 1 CPU 1
Monitor n CPU n
Figure 1. Software infrastructure of data processing
4 Data Processing Cache simulation usually involves a large amount of overhead for any application even with medium size, since every memory access has to be handled. This overhead will be strongly increased if the simulator additionally generates unmanageable huge amounts of data. This situation is specially critical for this work because hardware monitors capable of tracing every single event are used to collect memory access information. These monitors can be selectively connected to each location of the memory hierarchy, hence can create significant amount of data when working in a full tracing mode. In addition, the raw monitoring data is based on single events and physical addresses, and can therefore not directly be used by performance tools and applications for performance tuning. In order to solve this problem, a multilayer software infrastructure has been designed within EP-Cache for transforming the original performance data into a high level abstraction with respect to data structures. This not only results in smaller amounts of data but also simplifies the use at the high level. The software infrastructure of the data processing layers is shown in Figure 1. As illustrated in this figure, the monitoring data is first delivered from the hardware monitor to a ring buffer. This work is done through the low level driver and API of the hardware monitors. From there, data is sorted by the Monitor Control Component and stored into a histogram chain that is ordered by the addresses of corresponding memory blocks with cache line size, so called memory lines. In addition, the Monitor Control Component also combines the monitoring data from different monitors and probably different processors, and translates physical to virtual addresses. On top of this component, the ePAPI library
further processes the monitoring data into statistical forms such as total number of single events and access histograms. Finally, the Monitoring Request Interface (MRI) maps the virtual addresses into data structures using the context table provided by some compilers or using the debugging information. Also within this component, the final high-level data abstraction is delivered to performance tools and applications for performance analysis. As the primary data processing component, the ePAPI library provides a set of functions not only for data processing but also for configuration of the monitoring devices. Similar to the PAPI [4] library for hardware counters, ePAPI is capable of generating statistical numbers on individual events like cache hits and misses. Besides this, ePAPI generates access histograms recording the occurrence of single events over the complete working set at granularity of cache lines. These histograms can be used to find critical regions where individual metrics, like cache locality, show a poor performance. As an information request interface, the main function of MRI is to allow tools and applications to specify runtime requests that hold definitions of the required information, like information type, source code region, and name of the concerned data structure. The runtime information type can be individual events and access histograms in combination with program regions. Typical program regions are program units, loops, parallel regions, and function call sites. According to the requests, the MRI layer calls appropriate ePAPI functions and delivers the information to the consumer via a push and/or pull interface. The changes needed in Figure 1, which shows the final design with hardware cache monitor(s), to get the runtime simulation approach we describe in this paper, are 1. replacing the Low Level Monitor API by the cache
simulator, which is now writing the event data to the ring buffers instead of the hardware monitors, and 2. replacing the hardware monitors by the Valgrind layer with the MemAccess instrumentation plugin, which is now generating the events instead of signals on cache chips. In the simulation approach, there is no need for a real SMP system, as multiple cache hierarchies are simulated, too.
5 Results Based on the OpenMP simulation environment described above, we have studied a set of applications from various benchmark suites. As a case study, the MG code within the NAS OpenMP Benchmark suite [6] is chosen in this section to show a few sample uses of the simulation tool. MG uses a multigrid algorithm to compute the solution of the three-dimensional scalar Poisson equation. The algorithm works on a set of grids ranging from coarse to fine resolution, with the latter being the dominant factor for computation time. For this study, MG is simulated with 32x32x32 being the finest grid resolution. The simulated target architecture is a 4-node Symmetric Multiprocessor (SMP) system, each processor node with a 16KB, 2-way L1 cache and a 512KB, 4-way L2 cache. Caches are maintained coherent using the MESI protocol that invalidates cache copies in all processors at each write operation. First, the simulation environment provides results about various events for a single simulated run. These events include hits, misses, or total accesses with respect to read, write, or both of them. For example, LC1 READ HIT is an event that gives the number of the read operations performed on the level 1 cache. Events can be specified for the complete program or restricted to a single code segment or memory area. This allows to study critical regions and arrays in the working set that cause performance problems. For the C version of the MG code, compiled with omcc2 , Table 1 shows the absolute number in terms of several events listed on the first column. It can be seen that only a small number of L1 misses happen on the whole system, with a miss rate of 2.4%, 2.2%, 2.6%, and 2.3% for each processor. It also can be seen that processor 1 performs less invalidations and less L1 misses than other processors. This indicates that cache coherence parameters correlate with the locality characteristics of the code. For the second level cache, a significant amount of misses can be observed with an average miss rate of 11% for all processors, compared to the number of L2 misses. Again, cache line invalidation is 2 omcc is from the Omni OpenMP compiler suite, using GNU gcc as backend.
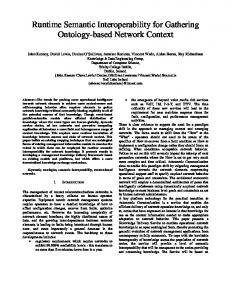
a critical reason for these misses. The numbers in the last line of Table 1 clearly show this. Besides individual events such as those listed in Table 1, the OpenMP simulation environment provides information in the form of memory access histograms at granularity of memory lines. Figure 2 illustrates such a histogram that records the access location of the first 100 lines of array v in the MG code. As illustrated in Figure 2, the access histogram depicts the accesses to the working set at granularity of cache line size. The x-axis shows the accessed locations, while the corresponding numbers of accesses to L1, L2, and the local memory are presented on the y-axis. Since it clearly exhibits the different behavior of each location in the memory hierarchy, this histogram is capable of directing the user to detect an optimized data placement for data structures within the source code. Finally, the simulation environment allows to study the impact of different compilers and programming languages with respect to an individual application. As an example, we give the simulation results of MG with both a C version and a Fortran version, compiled using the Omni OpenMP compilers omcc and omf77 [10]. The Fortran version also was compiled with the Intel compiler ifc. Table 2 presents the real execution times of both versions and different compilers, run on a 1.5 GHz Athlon, together with simulation results. The real execution times become small for reasonable simulation times; currently, the slowdown factor is around 1000 unfortunately. The overhead comes mainly from the simulation of the hardware monitors, since all memory references have to be traced and counter arrays to be updated depending on configuration. Still, it can be seen that the Intel Fortran version runs 3 times as fast as the Omni Fortran version, and the Omni C version is inbetween. This can be explained by the low number of memory references issued by the Intel compiler, which is only 30% of those issued by the Omni C compiler and 22% of those issued by the Omni Fortran compiler. Obviously, memory access characteristics correlate quite strong with real execution times.
6 Related Work The basic concept of runtime instrumentation has been used by several tools. An example is Shade [5]. Other techniques for seamless instrumentation of binaries are ATOM [7], which does binary rewriting, and DynInst [3], which can patch binaries while running. Runtime instrumentation is most often used for debugging purposes and analysis tools in software development. Other usages are processor migration and virtualization, hardware fault injection or even runtime optimizations. A set of research work has been reported regarding cache
L1 L1 L1 L2 L2
ACCESS TOTAL ACCESS MISS INVALIDATION ACCESS MISS INVALIDATION
Proc. 0 25 559 086 624 026 4 262 72 154 27 768
Proc. 1 24 704 245 541 011 1 578 43 091 24 982
Proc. 2 25 412 592 650 960 3 163 77 247 37 659
Proc. 3 25 430 594 578 403 1 799 72 285 22 961
Table 1. Results on single events of the C version
Figure 2. Access histogram of array v (first 100 memory lines)
simulators. They are used either as a single tool such as Valgrind or combined with a complete architecture simulator. Examples are RSIM and MICA. RSIM [13], the Rice Simulator for ILP Multiprocessor, simulates shared memory multiprocessors (and uniprocessors) built from processors that aggressively exploit instruction-level parallelism (ILP). RSIM models a two-level cache hierarchy, but supports only a hardware directory-based cache coherence protocol. MICA [8] is a memory and network simulation environment for cache-based PC platforms. MICA extends Limes, a multiprocessor simulator, with the simulation of L2 caches and uses it to create a trace file including all memory references. However, MICA’s cache simulator is quite simple and does not enable the modeling of various caches. In addition, most of the multiprocessor simulators use special macros for parallelization, and none of them supports OpenMP executions in contrast to our simulator.
model the computer hardware in high detail, allowing to evaluate the complete parallel architectures. All developed systems, however, are designed for specific architectures and purposes, and can not be straightforwardly used for our research on memory systems. Besides this, no system supports the execution of OpenMP programs. Modern rocessors are equipped with hardware counters that can also supply information about memory accesses. For this, platform independent libraries like PAPI [4] and PCL [2] are available for reading these counters. However, hardware counters can only provide limited access to special events. In contrast, our approach offers more insight into e.g. the access histogram allowing to detect regions and reasons causing locality problems.
Many simulation systems have been developed over the last years. Prominent systems include the most comprehensive simulation tool SimOS from Stanford university, the memory oriented SIMICS from Swedish Institute of Computer Science, and the Wisconsin Wind Tunnel (WWT) from university of Wisconsin. These larger simulators
In this paper we have introduced a flexible, general cache simulator for understanding the cache access behavior of OpenMP applications. This work is based on a runtime instrumentation tool and a multiprocessor simulator. We have modified SIMT’s cache simulator to be driven by events generated using the Valgrind framework, and thus, we have
7 Summary and Future Research
C (omcc) Fortran (ifc) Fortran (omf77)
execution time 0.06s 0.03s 0.09s
total access 101 106 517 30 538 285 139 975 127
total L1 miss 2 394 400 1 450 642 2 449 482
Table 2. Different simulation results with programming languages and compilers
established a compiler independent simulation environment for OpenMP. This environment is capable of providing detailed information about the runtime cache access behavior. In combination with a data processing infrastructure, this information allows to detect critical code segments, data structures, and memory regions that cause cache locality problems. However, this work is currently still in its initial phase. The original Augmint approach has one benefit. It is easy to extend the instrumentation to deliver additional source information like bounds of used data structures. This data is needed to handle data-symbol oriented monitoring requests, which is a crucial feature of the MRI layer of our monitoring infrastructure. Within Valgrind, however, this information has to be fetched from debug information included in the binary. This is especially tricky for dynamically allocated memory. Further improvement lies on the simulation infrastructure. One missing piece is intelligent mapping of running threads to processors, as we simulate separate cache hierarchies per processor. Currently, static round robin is supported. This only gives useful results when there are as many processors as threads, and all threads are supposed to have enough work all the time. If these assumptions do not hold true, there will be a large discrepancy between reality and simulation results. Another issue which has to be resolved for practical reasons, is the current slowdown of the implemented simulator. There is some potential for improvements: e.g., a possibility seems to parallelize the simulation process itself.
Acknoledgements We would like to thank Julian Seward for his excellent runtime instrumentation framework Valgrind, which made the work described in this paper possible.
References [1] ADAPTOR. High Performance Fortran Compilation System, 2002. Available at http://www.gmd.de/SCAI/lab/adaptor. [2] R. Berrendorf and B. Mohr. PCL - The Performance Counter Library: A Common Interface to Access Hardware Performance Counters on Microprocessors. Version 2.2. Online PCL documentation. http://www.fz-juelich.de/zam/PCL.
[3] B.P.Miller, M. Callaghan, and e. a. J.M. Cargille. The Paradyn Parallel Performance Measurement Tool. IEEE Computer, 28(11):37–46, November 1995. [4] S. Browne, J. Dongarra, N. Garner, G. Ho, and P. Mucci. A portable programming interface for performance evaluation on modern processors. The International Journal of High Performance Computing Applications, 14(3):189–204, Fall 2000. [5] B. Cmelik and D. Keppel. Shade: A Fast Instruction Set Simulator for Execution Profiling. In SIGMETRICS, Nashville, TN, US, 1994. [6] D. B. et. al. The NAS Parallel Benchmarks. Technical Report RNR-94-007, Department of Mathematics and Computer Science, Emory University, March 1994. [7] A. Eustace and A. Srivastava. ATOM: A Flexible Interface for Building High Performance Program Analysis Tools, 1994. [8] H. C. Hsiao and C. T. King. MICA: A Memory and Interconnect Simulation Environment for Cache-based Architectures. In Proceedings of the 33rd IEEE Annual Simulation Symposium (SS 2000), pages 317–325, April 2000. [9] Intel Corporation. Intel Fortran Compiler for Linux. Available at http://www.intel.com/software/products/ compilers/flin/. [10] K. Kusano, S. Satoh, and M. Sato. Performance Evaluation of the Omni OpenMP Compiler. In Proceedings of International Workshop on OpenMP: Experiences and Implementations (WOMPEI), volume 1940 of LNCS, pages 403–414, 2000. [11] N. Nethercote and J. Seward. Valgrind: A Program Supervision Framework. In Proceedings of the Third Workshop on Runtime Verification (RV’03), Boulder, Colorado, USA, July 2003. Available at http://developer.kde.org/˜sewardj. [12] A.-T. Nguyen, M. Michael, A. Sharma, and J. Torrellas. The Augmint Multiprocessor Simulation Toolkit for Intel x86 Architectures. In Proceedings of 1996 International Conference on Computer Design, October 1996. [13] V. S. Pai, P. Ranganathan, S. V. Adve, and T. Harton. An Evaluation of Memory Consistency Models for SharedMemory Systems with ILP Processors. In Proceedings of the Seventh International Conference on Architectural Support for Programming Languages and Operating Systems, pages 12–23, October 1996. [14] J. Tao, M. Schulz, and W. Karl. A Simulation Tool for Evaluating Shared Memory Systems. In Proceedings of the 36th ACM Annual Simulation Symposium, pages 335–342, Orlando, Florida, April 2003.