... volumes determined using height-accumulation, measured with a telescopic Spiegel-Relaskop, in conjunction with point sampling should estimate volume of ...
AN ABSTRACT OF THE THESIS OF
James Douglas Arney (Name of student)
in Forest Management
for the
M. S. (Degree)
presented on
(Major)
(Date)
Title: CALCULATION OF TREE VOLUME AND SURFACE AREA BY THE HEIGHT-ACCUMULATION METHOD L.
Abstract approved:
Dr. David P. Paine This study was initiated to determine the accuracy and limits of the height-accumulation method of measuring tree volume and
surface area for Pacific Northwest second-growth trees. Thirty
trees were selected from various thinning treatments in a 55 year old Douglas-fir forest. Each tree was measured with the highly accurate Barr and Stroud optical dendrometer and height, surface area, and cubic-foot volume were calculated on a Control Data Corporation 3300 electronic computer.
A Spiegel-Relaskop was used to measure taper steps for height-accumulation. These results were then compared with the
dendrometer results to determine the accuracy of this technique. The Relaskop was found to be inadequate when used alone, but
when a 4-power telescope was mounted, it greatly enhanced the usefulness of the instrument.
The telescopic Spiegel -R elaskop, using the height-accumulation
method, was found to be capable of measuring volume with compar-
able accuracy to the optical dendrometer. The study revealed that volumes determined using height-accumulation, measured with a telescopic Spiegel-Relaskop, in conjunction with point sampling should
estimate volume of a stand as accurately as any other c±uising :tech. nique. In addition this method, like other recently developed rrieth-
ods, eliminates the use of volume tables and their inherent biases.
Calculation of Tree Volume and Surface Area by the Height-Accumulation Method by
James Douglas Arney
A THESIS
submitted to
Oregon State University
in partial fulfillment of the requirements for the degree of Master of Science June 1968
APPROVED:
Associate Professor of Forest Management
Head of Department of Forestry
Dean of Graduate School
Date thesis is presented Typed by Opal Grossnicklaus for
James Douglas Arney
A CKNO WLE DGMENTS
The author would like to express his appreciation to the many
people who gave their assistance during the course of this study.
He is greatly indebted to his major professor, Dr. David P. Paine, for valuable assistance during the study and his critical review in design of the telescopic Spiegel-Relaskop. He would also like to thank Professor Alan B. Berg for supplying much of the data, and William A. Groman who operated the Barr and Stroud optical den-
drometer and worked closely with the author. The financial assistance from the Mclntire-Stennis Coopera-
tive Forestry Research Act was also greatly appreciated. He would like to acknowledge Professor John F. Bell and the graduate students in the HgradhuthI for their encouragement and interest in developing the telescopic Spiegel-Relaskop.
Most sincere thanks is also due to his wife, Susan, for her patience, support and encouragement throughout this study.
TABLE OF CONTENTS INTRODUCTION
The Problem Purpose of the Study Objectives MATERIALS AND METHODS
Methods
Basic Concepts o Volume Formulas
The Concept of Basal Area Sampling Design of the Study Area of the Study Materials Formation of a Computer Program The Spiegel-Relaskop Collection of the Data
2 3 6
8 8 8
10 12 14 14 14 18 19
PRESENTATION OF RESULTS
21
SUMMARY AND CONCLUSIONS
36
Bitterlich Sampling with Height-Accumulation BIBLIOGRAPHY
40 41
APPENDIX I
Height Accumulation Theory
43
APPENDIX II
Sampling Theory
48
APPENDIX III
The Telescopic Spiegel-Relaskop
51
APPENDIX IV
Error Example using Smalian Formula
58
APPENDIX V
Flow Charts and Computer Programs
60
LIST OF FIGURES
Figure
Page
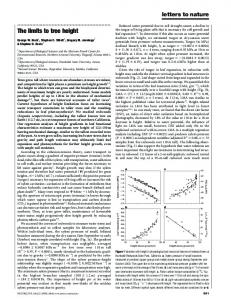
Theory of formula selection for stem form.
17
Stem profile - tree no. 142
22
Stem profile - tree no. 130
24
Difference in angle for 110 and 112 feet of height
27
Stem profile as predicted by parabolic formula
29
Stem profile as predicted by trio of formula
32
Stem profile as predicted by trio of formula
33
LIST OF TABLES Table
Page
Computer printout analysis for Barr and Stroud dendrometer using Smalian formula versus the
23
tele Sc opic Spiegel -Relaskop using height-accumulation formula.
Computer printout analysis for volume by trio (neoloid, conoid, paraboloid) and height by optimum distance method. Measured by Barr and Stroud dendrometer versus the telescopic Spiegel-Relaskop.
30
Computer printout analysis for volume by trio(conoid, 34 neoloid, paraboloid) and height by optimum distance method. Measuredby Barr and Stroud dendrometer versus the telescopic Spiegel-Relaskop to an eightinch top diameter.
CALCULATION OF TREE VOLUME AND SURFACE AREA BY THE HEIGHT-ACCUMULATION METHOD INTRODUCTION
Foresters have come to realize that trees are a manageable
forest crop. By advanced silvicultural practices the form of tree stems can be manipulated to meet more demanding and varied man-
agement objectives. At the same time foresters try to explain the factors which control the growth form of the forest crop. The
spatial element required to grow even a few trees involves a multitude of independent and interdependent factors; very few of which can
be controlled or explained. Since the area is necessarily so large,
it is impractical to measure every tree. Thus foresters are involved with sampling designs in order to measure the forest crop. These designs are always limited by that part of the environment which cannot be explained in the model (Grosenbaugh, 1948).
To determine when to harvest it is necessary to obtain an estimate of the volume of the standing trees. The size and inacces-
sibility of measuring trees before harvest led to felled tree measurements. But felling the trees prior to the planned harvest to estimate
the volume destroys any possibility of future management plans for
those trees. Therefore, trees outside the management unit must be utilized for felled tree volume. Volume tables where constructed
with volume over one independent variable. The one variable usu-
ally being diameter breast high! The limitations are readily apparent. Foresters have strived to improve this estimate by adding
more variables, and complex interactions of variables (ii. e., spe-
cies height, form class, form quotient, site, tariff access, et cetera). The Problem Fe-lied tree volume usually does not possess the distinct char-
acteristics inherent in standing trees. Volumes obtained in this manner contain bias that usually cannot be -removed, even when
corrected by a few rigorously valid sample trees from the management unit. The forester must eventually get back to making direct
non-destructive measurements on the standing trees -in the management unit.
The be-st estimate of the true volume of a stand is a good un-
biased sample of precisely measured volumes of individual trees.
There are a number of valid unbiased sampling schemes appropri-
ate to any forest stand. But no objective measure of standing tree volume has been discovered. The only alternative at present-is to
measure some function of volume. The function must be objectively
measured, directly correlated to volume, and a sensitive predictor of variation in volume between individual trees. A series of diame-
ter -and height measurements comes the closest to fulfilling these
3
requirements. Height is easily obtained for any point on the tree. Diameter, except near the ground, has been difficult, if not impossibie, to obtain. The most accurate instrument designed to measure
upper stern diameter is the Barr and Stroud optical dendrometer. A recent study showed that it can measure diameter atany visible point on the tree to the nearest one-tenth inch (Bell and Groman, 1968).
But, since the instrument does not allow for direct field
interpretation of readings of diameter or height, spacing of meas-
urements is purely arbitrary. Thus, the'interprter has litt1, if any, objective measure of the distinct form of the sample tree. To sample the stand effectively the measurements must be precise and
sensitive to the stem form of each sampled tree. David Bruce of the Pacific Northwest Forest and Range Experiment Station made a
slide rule fQr field interpretation of diameters and height using the Barr and Stroud dendrometer. It is not precise and is slow to use. Purpose of Study
In 1954, Dr. Lewis R. Grosenbaugh produced a paper which introduced a new tree measurement concept. It not only does away
with volume tables, but also is sensitive to individual tree stem form. He presented extensive mathematical proofs on the concept and called it height-ac cumulation.
His basic argument in proving the theory is that the integral
4
function, :
explains the relationship of diameter, X, and height, Y, to volume
of a series of frustra of solids of revolution. This function holds true for all frustra of solids of revolution of the general form X2 =
where B is an arbitrary constant and K equals two for
parabolic frustra, three for conic frustra, and four for neoloidic
frustra. The constant K is often arbitrarily selected as two for ease of calculation with height as the independent variable and diamete'r as
the dependent variable at various heights on the tree. Grosenbaugh (1967) pointed out that extrapolation of these
basic forms must not be carried out where frustra are too long or where upper and lower diameters differ by greater than 20 percent.
He also points out that least squares, minimax principles, and maximum likelihood do not provide a valid guide for testing or evaluating
the merits of any arbitrary projections. It has been proven that the integral function XY dx,
is equally valid where diameter and height form an upward progres -
sive total of heights times a diminishing arithmetic progression of diameters. Height is now the dependent variable and diameter is
the independent variable. This method has none of the defects which
make conventional felled tree methods impractical on standing trees.
Height at any point on the tree is easily measured, whereas diameter is not.
Hans Enghardt and H. J. Derr of the Alexandria Research Center, in central Louisiana, have used the height-accumulation method since 1955. It has proven rapid in the field and in office computations
and has yielded estimates close to those by othe'r methods. They
found it well suited for thinning stuies because the task of constructing local volume tables at each thinning interval was time consuming.
Their experimental stands of long leaf (Pinus palustris MilL),
slash (Pinus elliottii Engeim.) and lobloUy pine (Pinus taeda L.) ranged from 10 to 30 years old. Over 1900 sample trees were measured with the Speigel-Relaskop using height-accumulation. In a corn-
parison with cubic volume from Mesavage's form class volume tables,
average total cubic-foot volumes inside bark, differed by less than 0. 1 percent, with a maximum difference of 1.8 percent on a single plot, in another study they found less than three percent difference
in volumes obtained from plot sampling with height-accumulation
compared to measuring all trees. No individual tree comparisons were made.
In a study in southern New Hampshire by James P. Barrett, 26 white pines were felled and measured with i-inch taper steps.
The trees ranged from 5. 1 to 28. 0 inches Diameter Breast High and from 31 to 103 feet in total height. Voluxes were computed by
the graphical method and height-accumulation formula to one inch
taper steps. There was less than a 1 -in-20 chance that individual tree volume would vary from graphical estimates by more than 1. 25
cubic feet using one inch taper steps (Barrett, l964). The only other work that is being done with height-accumula-
tion started in 1963 in Shelton, Washington. Simpson Timber Com-
pany is investigating application of height-accumulation to determine
regression equations for volume by tree diameter under their Continuous Forest Inventory. They plan to complete their study in 1968 (Petzold, 1966). Objectives
The present study was designed to: Determine the accuracy and limits of the height -accumu-
lation method of measuring tree volume and surface area for Pacific Northwest second-growth forests. Determine the possibility of applying this method with a Spiegel -Relaskop a.nd variable plot cTruisip.g. The Spiegel-
Relaskop is in common use in the Pacific Northwest for
variable plot cruising; and it is one of the few instruments
which measures upper stem diameters over 30 inches.
7
3)
Provide an easily applicable and understandable computer program for quick and easy programming of height-accumulation prediction methods developed.
Minor objectives of this study were to determine the time involved to make the necessary measurements and to determine the effect of field conditions on the accuracy of the measurements.
MATERIALS AND METHODS
Methods
Basic Concepts of Volume Formulas
The most commonly used formulas in forestry for determining the cubic-foot content by logs in standing trees are: (B1+B2)
Smalian formula:
V
Huber formula:
V = B1L
L
2
=
2
(B1+4B1+B2)
Newton formula:
V=
6
L
Where
V = cubic-foot volume of a log
B1 = basal area, in square feet, of large end of log = basal area, in square feet, of the middle of the log
B 2
= basal area, in square feet, of small end of the log L = length in feet of the log (Chapman and Meyer, 1949)
Both the Smalian and Huber formulas calculate the volume of a
perfect parabolic frustum
Where the log assumes any other form
than a paraboloid, these formulas are only an approximation of the true volume. Therefore, their use should be restricted to the upper
portions of the tree. Providing the form is symmetrical, the Newton formula will approximate a parabolic, conic, or neoloidic frustum The height-accumulation method involves making the diameter
D, on standing trees the independent variable arbitrarily selected in
an arithmetric progression up the tree, and measuring the associated height, H.
Thus the measurement of the bole of each tree is directly
related to the growth form. The volume of a tree can be considered as the sum of the volumes of several frusta of solids of revolution. If each section of the bole is chosen such that the difference in upper
and lower diameters is consistent, then the difference can be considered a constant. This will, in effect, remove diameter as a neces-
sary variable to compute cubic volume. The constant difference in diameter can be chosen before any measurements are taken. This
difference is commonly referred to as a taper step. The height-accumulation formula will calculate volume of frusta of solids of revolution as cones, neoloids, or paraboloids simply by adjustment of a single constant, rrT
2
2(144)
K.
The general form being
j
j
i=1
i=1
EH+
L1
2K
where
V = volume, in cubic feet, of the entire stem ir
3.1415927
10
T = taper step, in inches 3
i=l
H1 = sum of the upward progressive totals of height to each
diameter increment, in feet 3
Lj i=1
= sum of the lengths, in feet, between each diameter meas urement,
j = number of taper steps measured on the tree K = shape divisor, 2 for paraboloid, 3 for conoid, and 4 for ne oloid
The Concept of Basal Area Sampling
One of the newest and most efficient sampling schemes is Bitterlich point sampling. It is objective and easily applied to forest sampling. All trees are counted which subtend an angle greater than some preset horizontal angle; the number of trees counted multi-
plied by the basal area factor equals t1te estimate of basal area per
acre. Trees of the stand are sampled by unequal probability sampling proportional to basal area. Equal probability sampling is proportional to frequency which frequently samples heaviest in size
classes of least interest. Bitterlich point sampling is the best unbiased estimator of stand basal area. A precise measure of volume for each tree of the Bitterlich sample will determine a volume-basal
area ratio with which to estimate stand volume. The form of the
11
basal area estimator is A
Ba = nFA
where A
BA = estimated basal area of the stand, in square feet the average number of trees per point in the sample 43560
F
Csc
2
,
the basal area factor
A = the number of acres in the stand 8 = a horizontal angle of a specified size used to dete'rmine
if a tree is to be sampled A
The estimator, T , of the volume of the stand is
__1n. y
m j=1
j _:ij/A:'
j1 i=l
Z
flj
j-1
where
m = the number of points sampled (count points plus measured points)
nj = the number of trees sampled on the jth point k = the number of points measured for volume y.. = the volume measured by height-accumulation on the ith U
tree on the jth point
x. = the basal area of the ith tree on the jth point 'See Appendix II for a more complete discussion of the sarnpUng theory.
12
The value of the volume estimator,
depends on the height-
accumulation method to predict true stem volume for a given basal
area. On each sample point the observer counts the number of point
sampled trees. A subsample of the points is measured with heightaccumulation to estimate the volume/basal area ratio.
Volume
trees are measured using height-accumulation with one, two, or
four-inch taper steps. Each point sample is a complete unbiased estimate of stand basal area. The average of all the point samples
for volume/basal area ratio times the average number of trees per point and the appropriate constants yields an estimate of the stand volume per acre. Design of the Study
To estimate the volume of a stand the estimator must be unbi-
ased, consistent, and efficient. The Bitterlich point sample overlayed with a small sample of precisely measured trees will fulfill
these requirements. The height-accumulation formula is exact for volume,
2
but it is not known if the method of measuring trees
for height-accumulation can be efficiently applied to the tall dense stands of the Pacific Northwest. If height-accumulation with a
Spiegel-Relaskop can be applied, the interpreter should have an 2See Appendix I for a more complete discussion of heightaccumulation theory and estimating procedures.
13
estimating scheme that is inexpensive, unbiased, consistent and efficient.
A large number of trees have previously been measured with the highly accurate Barr and Stroud optical dendrometer to determine
their true cubic-foot content. These measurements were made for another study but appeared to be ideally suited for use as controls to gauge the performance of height - ac cumulation.
Initially two electronic computer programs were designed by
this author. The foundation for the first was taken from a program
written for the Forest Research Laboratory, Corvallis, Oregon. It was designed to calculate the total volume, surface area and length
of individual trees measured with the optical dendrometer. The second program reads the output from the first program plus the observations on the same trees using the telescopic Spiegel-Relaskop.
The latter program computes volume, surface area and length by the height-accumulation method and compares paired results by
statistical methods. The program also computes the totals of all trees measured, their mean difference, standard deviation of the difference, coefficient of variation for mean difference and for
control mean, standard errorof mean difference, and results of a
paired t test. This analysis was made for volume, surface area and length individually. Results from these analyses should demon-
strate the efficiency of height-accumulation, its unbiasness, and
14
limitations in various stand conditions. Area of Study
The sampling for this study was done on the Black Rock Exper-
imental Forest. It is located approximately 24 miles northwest of Corvallis, Oregon. The stands sampled were 55 year old Douglasfir ranging in diameter from 8. 0 to 26. 0 inches and in height from 80 to 140 feet. The stands are part of a long term study on thirmings. Mate riáls
The following discussion presents a pair of electronic computer programs and a new look at the adaptability of the SpiegelRelaskop. Tl flow charts and program listings are covered in Appendix V. The Relaskop with optics was tested in the field before
adoption into this project. A more complete description of the Spiegel-Relaskop with optics is found in Appendix III.
Formation of a Computer Program In order to calculate and compare volumes of a number of
measured trees quickly and accurately, an electronic computer program (HTACCUM), was written. It compares individual volume
estimates against true dendromete red volumes and displays trends
or biases in the estimating procedure. A second program, II, was
15
written to include the Bitterlich point sample theory. Program II yields individual tree volume, surface, and length; tree and stand identification; stand volume, surface, and length; and tree and stand
variances and errors of estimates. Explanation of Program I (HTACCUM)
Program I reads one control card, which sets the upper diameter limits for volume computations. 2.
The program reads a set of cards which represents one tree. These cards contain data of the form:
the true volume, surface, and length of the ith tree in the stand from the Forest Research Lab revised program
an observation card for the ith tree which contains
the plot number, tree number, DBH, distance of
instrument from tree, first even diameter measured, taper step, number of measurements on tree, and a list of measured heights on the tree. 3.
The program subdivides the tree into three basic forms for determination of volume. The lowest segment is automatically loaded into the neoloid summation. Each following segment is loaded dependent on its length when compared to the previous segment. Thus, if
16
L.
> L.1 load L.i+l in neoloid summation
L.
= L.1 load L,1+1 in conoid summation
L,
< Li load L.1+1 in paraboloid summation
1+1
1+1
i+1
where
Li = the ith segment length, in feet L.+l = the segment immediately above L.
The last segment is always loaded into the conoid summation.
After summation by form is complete the program sums all segments and computes volume, surface, and length for the treeS
The computed volume, surface, and length are compared to
the true volume, surface, and length. The differences and percent differences are recorded. The program repeats steps 2 through 5 until all tress have been summed and recorded. 7,
All trees are included in final volume, surface, and length calculations. Differences, percent differences, and error
variances are computed. 8.
All data are printed out and labeled for analysis.
17
B
Y
x B3
When 5ç>
use parabolic formula B2
Al
X
use conic formula
B1
X
Where L. 1.