Applied Radiation and Isotopes 124 (2017) 7–15
Contents lists available at ScienceDirect
Applied Radiation and Isotopes journal homepage: www.elsevier.com/locate/apradiso
Calculation spreadsheet for uncertainty estimation of measurement results in gamma-ray spectrometry and its validation for quality assurance purpose
MARK
⁎
Alessia Ceccatellia, , Ashild Dybdala, Ales Fajgeljb, Aurelien Pitoisa a Terrestrial Environment Laboratory, IAEA Environment Laboratories, Department of Nuclear Sciences and Applications, International Atomic Energy Agency, Vienna International Centre, PO Box 100, 1400 Vienna, Austria b Office of the Deputy Director General, Department of Nuclear Sciences and Applications, International Atomic Energy Agency, Vienna International Centre, PO Box 100, 1400 Vienna, Austria
A R T I C L E I N F O
A B S T R A C T
Keywords: Uncertainty estimation γ-ray spectrometry Validation Quality assurance
An Excel calculation spreadsheet has been developed to estimate the uncertainty of measurement results in γ-ray spectrometry. It considers all relevant uncertainty components and calculates the combined standard uncertainty of the measurement result. The calculation spreadsheet has been validated using two independent open access software and is available for download free of charge at: https://nucleus.iaea.org/rpst/ReferenceProducts/Analytical_Methods/index.htm. It provides a simple and easy-to-use template for estimating the uncertainty of γ-ray spectrometry measurement results and supports the radioanalytical laboratories seeking accreditation for their measurements using γ-ray spectrometry.
1. Introduction Many important decisions are based on the results of analytical measurements. The results are used for example to verify compliance with legislation limits, to check materials against specifications or for trade purposes. Whenever decisions are made from analytical results, it is essential to have some indication of the quality of the results to know the extent to which they can be relied on for the purpose in hand. One essential measure of this is the estimation of the measurement result uncertainty, that is required by the ISO/IEC 17025:2005 standard (ISO, 2005) as a quantitative indication of the quality and reliability of the measurement result, and is thus one of the main pillars of any laboratory quality system. Gamma-ray spectrometry is a nuclear analytical technique of choice for many radioanalytical laboratories worldwide to carry out their environmental radioactivity monitoring programme (Ceccatelli et al., 2014). The proper estimation of measurement result uncertainty in γray spectrometry is however not always straightforward (Iurian et al., 2016), as shown from difficulties of laboratories to properly estimate measurement result uncertainty in proficiency test exercises, like, for example, the ones provided by the International Atomic Energy Agency (IAEA) to radioanalytical laboratories worldwide. Such difficulties are also observed to a lesser extent for the laboratories member of the IAEA's network of Analytical Laboratories for the Measurement of
⁎
Environmental Radioactivity (ALMERA) (IAEA, 2014; Osvath et al., 2016). Difficulties in properly estimating the measurement result uncertainty in γ-ray spectrometry can depend on the characteristics of the radionuclide under investigation and of the sample matrix, but also sometimes on a lack of systematic methodology in carrying out the estimation. Independently from the approach chosen for estimating the measurement result uncertainty (e.g. using the approach given in the Guide to the Expression of Uncertainty in Measurement (GUM) (JCGM, 2008), using the Bayesian or the Kragten analysis of uncertainties Kragten, 1994; Kragten, 1995), estimation requires a proper inventory of all uncertainty sources and a proper quantification of each uncertainty component. Where the principles of the GUM are used – which we consider in this paper – conversion to standard uncertainty of each uncertainty component and the proper combination of the standard uncertainties to assess the combined standard uncertainty of the measurement result is essential (JCGM, 2008; JCGM, 2012). In addition to the usual sources of uncertainty, including (but not limited to) measurement repeatability, counting statistics, mass determination, counting efficiency, etc., in γ-ray spectrometry there are some technique-specific uncertainty components that must be considered. For example, those related to self-attenuation in the sample, measurement geometry and true-coincidence summing are among the additional parameters to be taken into account. For these specific
Corresponding author. Present postal address: Via Bussana 103, 00054 Fregene, Rome, Italy. E-mail address:
[email protected] (A. Ceccatelli).
http://dx.doi.org/10.1016/j.apradiso.2017.03.002 Received 27 July 2016; Received in revised form 20 December 2016; Accepted 2 March 2017 Available online 03 March 2017 0969-8043/ © 2017 Elsevier Ltd. All rights reserved.
Applied Radiation and Isotopes 124 (2017) 7–15
A. Ceccatelli et al.
components, quantification depends on the method applied to determine the correction factor. Some sources of uncertainties are a-priori quantifiable such as those related to the instrumentation and the nuclear and atomic parameters of the radionuclide under investigation. Implementation of a quality assurance system in compliance with the requirements of the ISO/IEC 17025:2005 standard for γ-ray spectrometry is an important step for many radioanalytical laboratories worldwide to support their efforts in carrying out reliable and valid analytical measurements for their applications, such as environmental radioactivity monitoring. Proper estimation of measurement result uncertainty is an essential element for reporting measurement results and for providing correct interpretation, especially with regard to ‘fitfor-purpose’ considerations of the analytical approach used. The estimation of measurement result uncertainty is required in the clause 5.4.6 of the ISO/IEC 17025:2005 standard (ISO, 2005). The use of calculation spreadsheets can be a useful tool for estimating in a systematic manner the uncertainty of all the measurement results carried out in the laboratory over the years. Proper validation of the calculation spreadsheets is required to prevent their mishandling and the introduction of systematic errors in the calculation over their long-term use. The control of the data is stated in the clause 5.4.7 of the ISO/IEC 17025:2005 standard (ISO, 2005) and is further elaborated in other ISO standards (ISO, 2014):
Table 1 List of uncertainty components in γ-ray spectrometry.
‘…when using computer software, a suitable validation of the software shall be carried out prior to its use…’
Uncertainty components in γ-ray spectrometry
Method for quantification
Measurement repeatability Measurement reproducibility Calibration source activity Sample net peak area Calibration source net peak area Full-Energy-Peak efficiency fit Sample mass determination (repeatability) Sample mass determination (balance resolution) Volume determination Dry mass determination Corrections: – Background – Geometry and self-attenuation – True-coincidence summing (calibration source) – True-coincidence summing (sample) – Spectral interference – Dead-time – Decay Atomic and nuclear data: – Radionuclide half-life, T1/2 – Intensity of γ line, Iγ (considered radionuclide) – Intensity of γ line, Iγ (interfering radionuclide)
Direct input Direct input Direct input Direct input Direct input Direct input Calculated from Calculated from Calculated from Calculated from Calculated from Direct input Direct input Direct input Calculated from Calculated from Calculated from
input input input input input
input input input
Direct input Direct input Direct input
literature (such as nuclear and atomic data, calibration source activity, geometry and self-attenuation correction, true-coincidence summing correction) and from measurement results (such as measurement repeatability, measurement reproducibility, sample net peak area, calibration source net peak area, full-energy-peak efficiency fit). The uncertainty components that are calculated from input require, in general, the application of the “law of propagation of errors” (JCGM, 2008), that is implemented in the calculation spreadsheet, except the component due to mass repeatability, that is obtained by using repeated values of mass as inputs in the calculation spreadsheet. The calculation spreadsheet presented in this paper is based on the GUM approach and the relative uncertainty components are combined in quadrature to obtain the relative combined standard uncertainty of the measurement result (JCGM, 2008). The uncertainty components are treated as independent, therefore covariances are not taken into account in the combination formula. This is valid in most cases, but may lead to an overestimation of the combined standard uncertainty for true-coincidence summing correction component. This correction, depending on the nuclide(s) in question, may be applied both to the radionuclide under investigation in the sample and to other radionuclides present in the calibration source. The complexity of quantifying such potential covariance leads to a conservative uncertainty estimation approach.
Such validation can be performed using another independent software. For validation of a calculation spreadsheet for estimating measurement result uncertainty according to the GUM, one may make use of commercially available software (for example GUM Workbench). It has however to be noticed that commercially available software are licensed and therefore used by only a limited number of laboratories worldwide. To respond to the challenges mentioned above, a calculation spreadsheet, conforming to the requirements of ISO/IEC 17025:2005, was developed and validated by using open access software to properly estimate the uncertainty of the measurement results in γ-ray spectrometry. This calculation spreadsheet and its validation using two different approaches are presented in this paper. 2. Description of uncertainty components and their combination 2.1. Uncertainty components Table 1 lists the uncertainty components considered in the present calculation spreadsheet and usually taken into account as main components inγ-ray spectrometry. It differentiates the sources of uncertainty that are input directly by the user in the calculation spreadsheet, from the ones which are calculated from inputs using formulae. All quantities and units are given in accordance with the nomenclature/terminology of the relevant ISO documents (ISO, 2009; JCGM, 2012). The γ-ray spectrometry method whose uncertainty components are described hereafter is based on the efficiency transfer approach. Efficiency calibration is performed experimentally, using a multi-γ standard source, and correction factors for geometry, self-attenuation and true-coincidence summing are computed using dedicated codes (Vidmar et al., 2010). The sample geometry considered is cylindrical and oven drying method is applied for determination of sample moisture content. A detailed description of the uncertainty components is reported in the calculation spreadsheet. The uncertainty components that are direct input in the calculation spreadsheet are already expressed as relative standard uncertainties and do not require further application of the “law of propagation of errors” (JCGM, 2008). They are obtained from data available in the
2.2. Equations used for uncertainty components calculated from input As described in § 2.1, the uncertainty components calculated from input are obtained applying the “law of propagation of errors” and can be related to the case where either massic activity, a, or activity concentration, cA , is the quantity to be determined in the sample. These components are reported hereafter, using the relevant formulae. For simplicity, whenever the uncertainty component applies to both massic activity and activity concentration, massic activity is used in the related equations. 2.2.1. Volume determination The volume, V, of a cylindrical sample is expressed as:
d V = 2π × ( )2 × h 2 Where d is the container diameter [mm] and h is the sample height [mm] in the container. 8
Applied Radiation and Isotopes 124 (2017) 7–15
A. Ceccatelli et al.
The relative standard uncertainty component of activity concentration cA due to volume determination is:
The relative standard uncertainty component of massic activity a due to spectral interference correction is:
scA
sa a
cA
=
scaliper
(2 ×
d
V
)2 + (
scaliper h
)2
the gamma line of interest for radionuclide 2, and
2.2.2. Dry mass determination The relative moisture content of the sample, W, is expressed as:
(m w − md ) mw
=
(
W
smd (m w − md )
)2 + (
RcDT =
sm md × w )2 (m w − md ) mw
sa a
RcDecay = Rm × e−λ∆ t Where Rm is the measured count rate in the peak of interest in the sample spectrum [s−1], λ is the decay constant of the radionuclide of interest [d−1], and Δt is the time elapsed between the measurement date and the reference date (neglecting decay during measurement time) [d]. The relative standard uncertainty component of massic activity a due to decay correction is:
sRb Rc
Where sRb is the standard uncertainty of Rb [s−1]. As sRb is not directly available from the measurement it can be calculated as follows:
sRb = ( Where
Rb s Rb Rb
= RcDT × s τ DT
2.2.6. Decay correction The net count rate in the peak of interest in the sample spectrum, corrected for decay, RcDecay , is expressed as:
Where Rm is the measured count rate in the peak of interest in the sample spectrum [s−1], and Rb is the measured count rate in the peak of interest in the blank spectrum [s−1]. The relative standard uncertainty component of massic activity a due to background correction is:
sRb
Rm 1 − (Rm × τ)
Where sτ is the standard uncertainty of τ [s].
Rcbkg = Rm − Rb
bkg
is the relative
Where Rm is the measured count rate in the peak of interest in the sample spectrum [s−1], and τ is the analog-to-digital converter (ADC) dead-time [s]. The relative standard uncertainty component of massic activity a due to dead-time correction is:
2.2.3. Background correction The net count rate in the peak of interest in the sample spectrum, corrected for the background, Rcbkg , is expressed as:
=
R2*
2.2.5. Dead-time correction The net count rate in the peak of interest in the sample spectrum, corrected for dead-time, RcDT , is expressed as:
Where smd is the standard uncertainty of md [g], as determined by the balance resolution, and sm w is the standard uncertainty of mw [g], as determined by the balance resolution.
sa a
s R*2
standard deviation of the count rate of radionuclide 2 in a peak *, free from spectral interference.
Where mw is the wet sample mass [g] and md is the dry sample mass [g]. The relative standard uncertainty component of massic activity a due to dry mass determination is:
sa a
interf
Where A2 is the activity of radionuclide 2 [Bq], Iγ1(E ) is the intensity of the gamma line of interest for radionuclide 1, Iγ2(E ) is the intensity of
Where scaliper is, in the specific case, the resolution of the caliper used to measure container diameter and sample height (JCGM, 2008).
W =
sR* Iγ2(E ) A2 × 1 × 2 A R2* Iγ (E )
=
sa a
) × Rb
= Decay
ln (2) × ∆t ×s 2 T1/2 T
1/2
Where T1/2 is the radionuclide half-life [d].
and Rb can be easily calculated using information from the
spectrum analysis software.
3. Structure of the calculation spreadsheet for uncertainty estimation
2.2.4. Spectral interference correction The spectral interference correction applies to partially or totally overlapping peaks of two radionuclides, indicated as radionuclide 1 (radionuclide of interest) and radionuclide 2 (interfering radionuclide). In the case of total overlapping, where the two peaks cannot be deconvoluted using mathematical algorithms, the net count rate in the peak of interest at energy E in the sample spectrum, corrected for the spectral interference, Rcinterf , is expressed as:
The calculation spreadsheet is provided with instructions for use, reported in a separate worksheet named “Instructions”. The instructions describe in details all symbols and quantities that appear in the “radionuclide” worksheet and explain how to properly fill in the required cells/fields in the “radionuclide” worksheet. The “radionuclide” worksheet is specific for a certain radionuclide and is given its name, as it includes some nuclear and atomic parameters for that radionuclide. The calculation spreadsheet is available for download free of charge on the IAEA Reference Products homepage: https://nucleus.iaea.org/rpst/ReferenceProducts/Analytical_ Methods/index.htm. The specific case of K-40 is explained in this paper. Changing only the specific radionuclide-dependent parameters, it is possible to create a calculation spreadsheet for any radionuclide of interest. The “radionuclide” worksheet can be divided into three main regions. The first region (cells included between lines A1 and A62 and columns between L1 and L62) is mainly dedicated to input values
Rcinterf = (R1 + R2 ) − R2 Where R1 is the net count rate in the peak of interest in the sample spectrum, due to radionuclide 1 [s−1], and R2 is the net count rate in the peak of interest in the sample spectrum, due to radionuclide 2 [s−1]. When using a manual approach for the determination of Rcinterf , R2 is obtained by calculation of the activity A2 of radionuclide 2, determined by the analysis of another suitable peak of radionuclide 2 that is free from spectral interference. 9
Applied Radiation and Isotopes 124 (2017) 7–15
A. Ceccatelli et al.
cell numbers in the Excel calculation spreadsheet are given in Table 2. The same test values were also used as input in both open access software applied for validation of the Excel calculation spreadsheet. The validation was carried out on the K-40 worksheet, since the formulae for spectral interference correction for this radionuclide (energy line 1460.822 keV) with Ac-228 (energy line 1459.131 keV) are active, allowing a complete validation of the calculations (DDEP, 2016). Massic activity was considered as the quantity to be measured in the sample. The numerical result of the relative combined standard uncertainty, uc , obtained by the Excel calculation spreadsheet using the test values in Table 2 was found equal to 0. 0581379837589682 . The number of reported figures is the maximum that can be stored by Excel. The numerical results in the validation process were not rounded on purpose, in order to compare different software up to the maximum number of figures possible.
used in the spreadsheet for calculation of the uncertainty components that require the application of the law of propagation of errors. The second region (cells included between lines A66 and A117 and columns between E66 and E117) is dedicated to the combination in quadrature of all considered uncertainty components to obtain the relative combined standard uncertainty of the measurement result. Some uncertainty components are derived from calculation using inputs from the first region, some others are direct input from the user in the second region. The third region (cells included between lines G66 and G84 and columns between Q66 and Q84) is dedicated to the calculation of the combined standard uncertainty of the mean, in the case that the measurement result is obtained as arithmetic mean of repeated measurement results. In the “radionuclide” worksheet it is possible to select two alternative options depending on the quantity to be determined in the sample under investigation. If the quantity is the massic activity, the mass should be selected as option in cell B9. Like this, all cells related instead to volume determination (that is required if the quantity to be measured is the activity concentration) will turn into red and will not be considered into the calculation. The opposite happens if the volume is selected as option in cell B10. The related screenshot is shown in Fig. 1. In the “radionuclide” worksheet it is also possible to select two alternative options related to the potential application of spectral interference correction for the considered gamma line. If the gamma line is affected by spectral interference and the correction is applied, such option should be marked in cell H51. Thus, all cells/fields related to spectral interference are enabled and related inputs are considered in the calculation. The opposite happens if cell H52 is marked instead. The related screenshot is shown in Fig. 2.
4.2. Validation of the calculation spreadsheet using open access calculator WolframAlpha (single run) The online computational knowledge engine WolframAlpha was chosen for the validation of the developed uncertainty calculation spreadsheet, since it is available online free of charge, provides high precision in the calculations, does not require any programming knowledge, and it fulfils the requirements of the ISO/IEC 17025:2005 standard. Hence it can be used by anyone and so can contribute to standardizing the validation process. 4.2.1. Validation of the uncertainty components calculated from input values The relative standard uncertainties, ui, of the individual uncertainty components have been calculated using the open access calculator WolframAlpha and the input values given in Table 2. Those numerical calculations are described in detail below.
4. Numerical validation As mentioned in the Clause 5.4.7 of the ISO/IEC 17025:2005 standard ISO (2005) on the control of the data, when using a computer software, a suitable validation of the software shall be carried out prior to its use. Such validation can be achieved using another independent software. The Excel calculation spreadsheet was validated using two independent open access software, as described below.
4.2.1.1. Mass determinationsample (repeatability). The input values used for the calculation were the following: – Three measurement results for the gross mass in gram – One measurement result for the tare mass in gram.
4.1. Input for the calculation of the uncertainty components The test values for the calculation of the uncertainty components, although chosen for their simplicity, are representative of typical values obtained for γ-ray spectrometry measurements of γ-emitting radionuclides in environmental samples. The test values (“validation values”) used as inputs for the calculation of the uncertainty components along with their
The numerical value of the relative standard uncertainty was determined as given below:
u1 =
s m
Fig. 1. Screenshot of the “radionuclide” worksheet related to the quantity to be determined in the sample under investigation. (For interpretation of the references to color in this figure, the reader is referred to the web version of this article).
10
Applied Radiation and Isotopes 124 (2017) 7–15
A. Ceccatelli et al.
Fig. 2. Screenshot of the “radionuclide” worksheet related to the potential application of spectral interference correction for the considered gamma line. Table 2 Inputs for the calculations of the uncertainty components. Fields for direct input
Cell
Mass determination: – Gross mass [g] x 3
– Tare [g] – sbalance (balance resolution) Dry mass determination: – Masswet [g] – Massdry [g] – smass wet (balance resolution) – Smass dry (balance resolution) Background correction: – Peak count rateblank [s−1] – Net count ratesample [s−1] – Relative standard deviationpeak area blank Decay correction: – Tmeas – Tref [d] Spectral interference correction: – Activity of considered radionuclide at Tmeas [Bq] – Activity of interfering radionuclide at Tmeas [Bq] – Relative standard deviationpeak area interfering radionuclide – Iγ for the considered radionuclide – Iγ for the interfering radionuclide Uncertainty components for direct input – Measurement repeatability – Measurement reproducibility – Calibration source activity – Sample net peak area – Calibration source net peak area – Full-Energy-Peak efficiency fit Corrections: – Geometry and self-attenuation – True-coincidence summing (calibration source) – True-coincidence summing (sample) Predefined uncertainty components – Atomic and nuclear data: – Radionuclide half-life T1/2 Calculated from inputs, T1/2 (B42) and sT1/2(B46) – Iγ for the considered radionuclide – Iγ for the interfering radionuclide
Value for test
3
∑n =1 (gross n −
1 2
3
∑ (netn − a)2
=
n =1
1 3
1 [(80 − 80)2 + (80. 01 − 80)2 + (79. 99 − 80)2] 2
K14 K15 K16 L11 E15
100.00 100.01 99.99 20.00 0.01
B24 B26 B28 B30
1.5 1.2 0.00001 0.00001
B35 B37 E35
0.0005 0.05 0.1
u2 =
B44
5000
Where m is defined in paragraph 4.2.1.1.
B51 B53 E51 E55 E57
50 0.5 0.1 0.1 0.005
u2 =
C70 C72 C74 C76 C78 C80
0.005 0 0.005 0.01 0.005 0
– – – –
C94 C96 C98
0.02 0.03 0.03
C108 B42 B46 C110 C112
=
1 3
(0. 01) ≈ 0. 0057735 ui =
s 0. 01 = ≈0. 00007216878 m 80 3
4.2.1.2. Mass determinationsample (balance resolution). The input value used for the calculation was the balance resolution in gram, sbalance. The numerical value of the relative standard uncertainty was determined as given below:
sbalance m
sbalance 0. 01 = = 0. 000125 m 80
4.2.1.3. Dry mass determination. The input values used for the calculation were the following: masswet in gram, m w massdry in gram, md smass wet in gram, sm w smass dry in gram, smd
The numerical value of the relative standard uncertainty was determined as given below:
5E+11 1E+09 0.01 0.03
u3 =
2 ⎛ smd ⎞2 ⎛ sm w m ⎞ × d⎟ + ⎜ ⎟ ⎜ mw ⎠ ⎝ m w − md ⎠ ⎝ m w − md
u3 =
2 ⎛ 0. 00001 ⎞2 ⎛ 0. 00001 1. 2 ⎞ × ⎟ ≈ 0. 000042687 ⎟ + ⎜ ⎜ ⎝ 1. 5 − 1. 2 ⎠ ⎝ 1. 5 − 1. 2 1. 5 ⎠
4.2.1.4. Background correction. The calculation were the following:
Where s is the standard deviation of the mean of the net masses in gram, and m is the average of the net masses in gram.
m=
1 3
s=
– peak count rateblank – net count ratesample – relative standard uncertaintypeak
tare)
3 (100 − 20) + (100. 01 − 20) + (99. 99 − 20) = = 80. 0 3
input
values
used
for
the
area blank
The numerical value of the relative standard uncertainty was determined as given below: 11
Applied Radiation and Isotopes 124 (2017) 7–15
A. Ceccatelli et al.
Fig. 3. Screenshots of the calculations carried out using the open access calculator WolframAlpha. Letters from a) to h) correspond to calculations related to the uncertainty components and to the combined standard uncertainty described respectively in paragraphs 4.2.1 and 4.2.2.
u4 =
scountrateblank Netcountratesample
calculation were the following: – Activity of the considered radionuclide at the measurement time in becquerel, A – Activity of the interfering radionuclide at the measurement time in becquerel, A2 – Intensities of the gamma lines of interest for the considered and interfering radionuclides respectively, Iγ1(E ) and Iγ2(E )
Where:
scountrateblank = rel .
st.
unc.
peakarea × peakcountrate
=0. 1 × 0. 0005 = 0. 00005
u4 =
scountrateblank = Netcountratesample
0. 00005 = 0. 001 0. 05
– Relative standard uncertaintypeak
area of interfering radionuclide,
s R*2 R2*
The numerical value of the relative standard uncertainty was 4.2.1.5. Spectral interference correction. The input values used for the 12
Applied Radiation and Isotopes 124 (2017) 7–15
A. Ceccatelli et al.
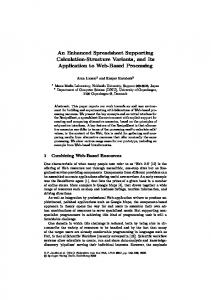
Fig. 4. Configuration file (config.r) used for defining the constants and input values used for the calculations.
– sT1/2 (B46) in day
determined as given below:
Iγ2(E ) Iγ1(E )
sR*
u5 =
A2 × A
u5 =
sR* Iγ2(E ) A2 × 1 × 2 = * A R Iγ (E ) 2
×
The numerical value of the relative standard uncertainty was determined as given below:
2
R2* 0. 5 0. 005 × × 0. 1 = 0. 00005 50 0. 1
u7 =
u7 =
4.2.1.6. Dead-time correction. The input values used for the calculation were the following:
=
– Net count ratesample per second – Standard deviation of the dead-time in second, sτ .
ln(2) × (Tmeas − Tref ) (T1/2 )2
ln(2)×(Tmeas
− Tref )
(T1/2 )2
× sT1/2 =
ln(2) × B 44 × B 46 (B 42)2
× sT1/2 =
ln(2) × 5000 × 1×109 (5 × 10¹¹)2
ln(2) × 10−10 ≈ 1. 38629×10−11 5
4.2.2. Validation of the relative combined standard uncertainty Combining in quadrature all the obtained uncertainty components, the relative combined standard uncertainty, uc , is given by:
The numerical value of the relative standard uncertainty was determined as given below:
u6 = Netcountratesample × sτ = B37 × B62
7
u2c = ∑i =1 ui = (0. 005)2 +
u6 = Netcountratesample × sτ =0. 05 × 0. 000001 = 5 × 10⁻⁸
(0. 005)2 + (0. 01)2 + (0. 005)2
+(0. 000125)2 + (0. 001)2 + 2
(0. 02)2 + (0. 03)2+ (0. 03)2
+(0. 00005) + (0. 002) + (0. 01)2 + (0. 03)2
4.2.1.7. Decay correction. The input values used for the calculation were the following:
⎛ 0 . 01 ⎞2 +⎜ ⎟ + ⎝ 80 3 ⎠
– Tmeas − Tref (B44) in day – T1/2 (B42) in day
+( 13
ln(2) 5
2
(
0 . 00001 0.3 2
×
1.2 2 ) 1.5
+
× 10−10) + 2. 5 × 10⁻¹⁵
(
0 . 00001 2 ) 0.3
Applied Radiation and Isotopes 124 (2017) 7–15
A. Ceccatelli et al.
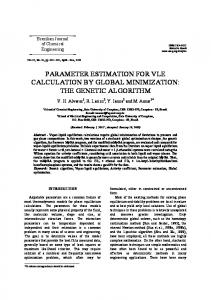
Fig. 5. R-script using the constant and input values from the configuration file to calculate the uncertainty components and the combined standard uncertainty.
of the R programming code is that the written programme is repeatable, and therefore one can easily change the input values to run the code again and get a new result. Fig. 6. Results when running the above script. The first line of numbers shows the calculated uncertainty components. The last line shows the combined standard uncertainty.
uc =
4.3.1. R-script for validation of the calculation spreadsheet Using the open access R programming code, a configuration file (config.r) and a R-script were written in order to have all the calculations described earlier carried out on a systematic manner. The configuration file (config.r) is used to define all constants and input values used for the calculations. The R-script uses the constant and input values from the configuration file to calculate the uncertainty components and the combined standard uncertainty. In the configuration file (config.r), all constants and input values are “stored” and can be altered accordingly, making this method repeatable. This programme enables the Excel calculation spreadsheet to be validated on a systematic manner for any calculation being carried out, giving additional confidence on the estimation of the measurement result uncertainty. The configuration file (config.r) and the R-script are given in Figs. 4 and 5 respectively.
u2c ≈ 0. 0581379837589682
Screenshots of all the calculation steps carried out using the open access calculator WolframAlpha are shown in Fig. 3. The numerical results obtained using the open access calculator WolframAlpha have been compared with the numerical results given in the corresponding cells in the Excel calculation spreadsheet. Identical results are obtained up to 15 significant figures, after which Excel does not store any further digits. Agreement is therefore obtained for all numerical results, validating the calculation spreadsheet for the estimation of the measurement results uncertainty in γ-ray spectrometry. It has however to be noticed that, using this open access calculator, the validation of the spreadsheet can be carried out only on a single run and cannot be recalled for further calculations. This issue was addressed by using a separate open access programming code.
4.3.2. Validation results At the end the R-script prints all the components (the comp vector), i.e. the uncertainty components calculated from input values and the combined standard uncertainty, so that they can be checked against the Excel calculation spreadsheet. Fig. 6 shows the results when running the R-script with the input values given in Table 2. The results obtained for the calculated uncertainty components and the combined standard uncertainty when running the R-script with the input values given in Table 2, are in agreement with the numerical results obtained in the corresponding cells in the Excel calculation
4.3. Validation of the calculation spreadsheet using open access R programming code (systematic manner) Since performing the calculations using the open access calculator WolframAlpha is not time efficient, as data cannot be stored for further recalling, a separate programme was written in the open access R programming code. R is a programming language mainly used for statistics and data analysis, and is free to use by anyone. The advantage 14
Applied Radiation and Isotopes 124 (2017) 7–15
A. Ceccatelli et al.
CRM. Appl. Radiat. Isot. 87, 461–467. DDEP, 2016. Decay Data Evaluation Project, Recommended data. 〈http://www.nucleide. org/DDEP_WG/DDEPdata.htm〉 (web page consulted in November 2016). IAEA, 2004a. Quantifying Uncertainty in Nuclear Analytical Measurements, TECDOC 1401:2004. International Atomic Energy Agency, Vienna, Austria. 〈http://www-pub. iaea.org/MTCD/Publications/PDF/te_1401_web.pdf〉. IAEA, 2004b. Quality System Implementation for Nuclear Analytical Techniques, TCS 24:2004. International Atomic Energy Agency, Vienna, Austria. 〈http://www-pub. iaea.org/MTCD/publications/PDF/TCS-24_web.pdf〉. IAEA, 2014. ALMERA Proficiency Test: Determination of Natural and Artificial Radionuclides in Soil and Water, IAEA Analytical Quality in Nuclear Application Series No. 32:2014. In: International Atomic Energy Agency, Vienna, Austria. 〈http://www-pub.iaea.org/MTCD/Publications/PDF/IAEA-AQ-32_web.pdf〉. ISO, 2005. ISO/IEC 17025:2005. General Requirements for the Competence of Testing and Calibration Laboratories. International Organization for Standardization, Geneva, Switzerland. ISO, 2009. ISO 80000-10:2009. Quantities and units – Part 10: Atomic and nuclear physics. International Organization for Standardization, Geneva, Switzerland. ISO, 2014. ISO/IEC 25051:2014. Software engineering – Systems and Software Quality Requirements and Evaluation (SQuaRE) – Requirements for Quality of Ready to Use Software Product (RUSP) and Instructions for Testing. International Organization for Standardization, Geneva, Switzerland. Iurian, A.R., Pitois, A., Kis-Benedek, G., Migliori, A., Padilla-Alvarez, R., Ceccatelli, A., 2016. Assessment of measurement result uncertainty in determination of 210Pb with the focus on matrix composition effect in gamma-ray spectrometry. Appl. Radiat. Isot. 109, 61–69. JCGM, 2008. Evaluation of Measurement data – Guide to the Expression of Uncertainty in Measurement (GUM 1995 with minor corrections), 100:2008. Joint Committee for Guides in Metrology. 〈http://www.bipm.org/utils/common/documents/jcgm/JC GM_100_2008_E.pdf〉. JCGM, 2012. International vocabulary of metrology – Basic and general concepts and associated terms (VIM 2008 with minor corrections), 200:2012. Joint Committee for Guides in Metrology. 〈http://www.bipm.org/utils/common/documents/jcgm/JC GM_200_2012.pdf〉. Kragten, J., 1994. Calculating standard deviations and confidence intervals with a universally applicable spreadsheet technique. Analyst 119, 2161–2166. Kragten, J., 1995. A standard scheme for calculating numerically standard deviations and confidence intervals. Chemom. Intell. Lab. Syst. 28, 89–97. Osvath, I., Tarjan, S., Pitois, A., Groening, M., Osborn, D., 2016. IAEA's ALMERA network: supporting the quality of environmental radioactivity measurements. Appl. Radiat. Isot. 109, 90–95. Pitois, A., Osvath, I., Tarjan, S., Groening, M., Osborn, D., 2016. Role of the IAEA's ALMERA network in harmonization of analytical procedures applicable worldwide for radiological emergencies. Radiat. Prot. Environ. 39, 53–61. Vidmar, T., Celik, N., Cornejo Diaz, N., Dlabac, A., Ewa, I.O.B., Carrazana Gonzales, J.A., Hult, M., Jovanovic, S., Lepy, M.-C., Mihaljevic, N., Sima, O., Tzika, F., Jurado Vargas, M., Vasilopoulou, T., Vidmar, G., 2010. Testing efficiency transfer codes for equivalence. Appl. Radiat. Isot. 68, 355–359.
spreadsheet and with the numerical results obtained using the open access calculator WolframAlpha. The configuration file and R-script can also be easily adapted for the validation of the estimation of measurement result uncertainty for other γ-emitting radionuclides by changing the input parameters and by making minor corrections to the R-script. Both the configuration file and the R-script shown here are simple procedures and can be used as an example on how to build a validation of an Excel calculation spreadsheet for measurement result uncertainty estimation. 5. Conclusions A calculation spreadsheet for properly estimating the uncertainty of measurement results obtained by γ-ray spectrometry was developed and validated using two independent open access software. It provides to scientists in the field of γ-ray spectrometry a simple and easy-to-use calculation spreadsheet for estimating the uncertainty of their γ-ray spectrometry measurement results. The calculation spreadsheet conforms to ISO/IEC 17025:2005 requirements and provides support to radioanalytical laboratories seeking accreditation of the γ-ray spectrometry nuclear analytical technique. The good agreement of the numerical results obtained using the three independent calculation software represents a cross-validation approach of those for the given purpose. This work is part of the activities of the IAEA Environment Laboratories to support the enhancement of the reliability and comparability of the environmental radioactivity measurement results obtained by nuclear analytical techniques in Member States’ laboratories (IAEA, 2004a; IAEA, 2004b); Pitois et al., 2016), and as such the calculation spreadsheet is available for download free of charge on the IAEA Reference Products homepage: https://nucleus.iaea.org/rpst/ReferenceProducts/Analytical_ Methods/index.htm. References Ceccatelli, A., Katona, R., Kis-Benedek, G., Pitois, A., 2014. Measurement of 226Ra in soil from oil field: advantages of γ-ray spectrometry and application to the IAEA-448
15