Session T3D
Parameter Estimation Using Spreadsheet Optimization: A Review of Applications in Civil and Environmental Engineering Education and Research Lizette R. Chevalier1, Shashi Marikunte2, Jemil Yesuf 3 Southern Illinois University Carbondale Carbondale, IL 62901
Abstract - The use of empirical models is an integral part of the design and analysis of civil and environmental engineering systems. One of the most commonly used methods for parameter estimation is linear regression. This technique is also applied to nonlinear models with two unknown parameters when the equation can be linearized through transformation. Equations with more than two unknown parameters can be solved using matrices that expand on the basic form of the solution for linear equations. The use of spreadsheets in engineering education and research is a common tool used for basic curve fitting (two unknown parameters) as well as smaller matrix solutions. This paper presents a different approach for the use of spreadsheets, namely, parameter estimation using optimization. Spreadsheet optimization is a practical platform that easily determines the parameters of equations. The number of unknown variables is not constrained. In addition, the analysis can be expanded to include minimizing a range of nonlinear error functions, consequently allowing for a broader mathematical approach to parameter estimation. This paper reviews the use of spreadsheet optimization on several civil and environmental engineering applications. Index Terms - Spreadsheets, optimization, sorption isotherms, weir equation, strength of concrete INTRODUCTION In the undergraduate engineering curriculum, the traditional approach to parameter estimation of nonlinear equations is to first linearize the data through transformation, followed by linear regression. This technique is also used in industry in numerous applications. Linear regression assumes a Gaussian distribution of the error at each point. However, linearization of the data implicitly alters this error structure and may also violate the error variance and normality assumption [1]-[3]. Furthermore, this technique is limited to the estimation of two variables. An alternative method for parameter estimation is optimization based on minimizing the error. This approach
provides two significant advantages. First, it is applicable to equations with more than two parameters. Secondly, the method allows for a choice of an error function and consequently a broader mathematical approach to parameter estimation. In this study, optimization was performed using the solver add-in of Microsoft Excel®. Our investigation is focused on curriculum commonly taught in the civil and environmental engineering courses: calibrating flow over a weir, dye sorption using the Langmuir isotherm model, dye sorption using the Redlich-Peterson isotherm and estimating the strength of concrete (materials). The Redlich-Peterson isotherm and the equation for estimating the strength of concrete represent equations with more than two unknown parameters. MATHEMATICAL BACKGROUND The basic mathematical equations evaluated were: y = a o x a1 (1a) ao x y= (2a) 1+ a1 x y=
ao x
1 + a1 x a2 y = ao + a1 x1 + a2 x2 + a3 x1 x2 + ..
(3) (4a)
where y is the dependent variable, x is the independent variable(s) and an represent the unknown coefficients or fitting parameters. Equations 1 and 2 can be linearized using the following transformations: ln y = ln ao + a1 x
(1b)
1 1 1 a1 = + y a o x a 0
(2b)
Because Eqn. 3 has three parameters, it cannot be solved using linearization techniques. Equation 4 can be solved using a solution technique based on the basic principles of linear
1
Lizette R. Chevalier, Chair, Dept. of Civil and Environmental Engineering,
[email protected] Shashi Marikunte, Asst. Professor, Dept. of Civil and Environmental Engineering,
[email protected] 3 Jemil Yesuf, Graduate Student, Dept. of Civil and Environmental Engineering,
[email protected] 2
San Juan, PR
July 23 – 28, 2006 9th International Conference on Engineering Education T3D-13
Session T3D regression, namely, minimizing the error by setting the partial derivative of the coefficients equal to zero. A generalized solution, which can be expanded to include additional terms, is: n ∑ x1i ∑ x 2i
∑x ∑x ∑x x 1i 2 1i
1i
∑x ∑x x ∑x
a o ∑ y i (4b) 1i 2 i a1 = ∑ x1i y i 2 x y 2 i a 2 ∑ 2i i 2i
2i
is the sum of the residual error, Sr. The residual error (e2) is the square of the difference between Qexp and Q based on (5). This value is minimized by changing the values of C and n. A comparison of parameter estimation based on both techniques is presented in Figure 2 and Table 1. As evident by the graph, parameter estimation based on spreadsheet optimization is a better fit model for the data. When the data was linearized, the R2 value of the linear regression was 0.9996. This linearized R2 value is often reported as evidence of a good fit. As evident by Figure 2, the parameters from this method do not provide a close fitting model. An appropriate quantitative measure of a good fit for nonlinear equations is the root mean squared residual (RMSR):
∑ ( y i − y i,model )
2
RMSR =
(6)
N
where N is the number of data points. Values close to zero indicate a good fit. In this case, the linear transform model (LTRM) resulted in a higher RMSR than the optimization model (Table 1), which is in agreement with Figure 2. TABLE 1. COMPARISON OF THE PARAMETER ESTIMATION METHODS FOR A V-NOTH WEIR
C
n
R2
RMSR
LTRM
3.322
2.797
0.9996
0.0069
Optimization
3.101
2.741
n/a
0.0013
0.25
Measured 0.20
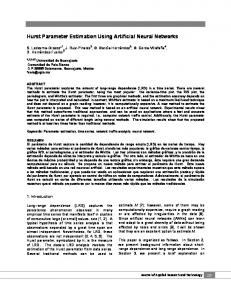
FIGURE 1 EXAMPLE OF USING MICROSOFT EXCEL® SOLVER FOR PARAMETER
LTRM Optimization
ESTIMATION Q, ft 3 /s
0.15
FLOW OVER A WEIR
0.10
In civil engineering practice, it is necessary to determine the flow rate of streams and similar open channels for water resource management or to forecast floods. One method of measuring flowrate is the weir structure. A popular weir is the V-notch weir, named for it’s V-shaped crest. The basic principle of a weir is that flowrate (Q) is directly related to the water depth (H) above the weir crest. Mathematically, this relationship is written as: Q = CH n
(5)
where C is the coefficient of discharge which is a function of the notch angle θ, and n is a weir constant. The basic form of this equation and the transformation is (1a) and (1b). An alternative to this approach is parameter estimation using the solver add-in of Microsoft Excel®. An example worksheet for this method is presented in Figure 1. Cell K12
San Juan, PR
0.05
0.00 0.10
0.15
0.20
0.25
0.30
0.35
H, ft
FIGURE 2 COMPARISON OF EXPERIMENTAL AND MODELED DATA FOR FLOW OVER A WEIR.
LANGMUIR ISOTHERM
The design and operation of adsorption processes require equilibrium adsorption data for use in mass transfer models which can then be used to predict the performance of the adsorption contact processes under a range of operating conditions [4]. Mostly, these adsorption studies are performed July 23 – 28, 2006 9th International Conference on Engineering Education T3D-14
0.40
Session T3D
qe =
K L Ce 1 + a L Ce
300 250 200 qe, mg/g
by equilibrating predetermined quantities of adsorbent with solutions of adsorbate(s) at fixed pH and temperature. Graphs of resulting equilibrium data correlating the variation of solidphase concentration (qe), or the amount of solute adsorbed per unit mass of solid, to the variation of equilibrium solutionphase concentration (Ce) are termed adsorption isotherms. Langmuir [5] developed a theoretical equilibrium isotherm model that is widely used in industry and research:
150 Measured LTRM Optimization
100 50
(7) 0 0
100
200
300
400
500
600
700
800
Ce, mg/L
where KL is given as:
K L = Qo a L
FIGURE 3 COMPARISON OF EXPERIMENTAL AND MODELED DATA FOR LANGMUIR ISOTHERM
(8)
Qo (mg·g-1) is the solid-phase concentration corresponding to a condition in which all sites are filled or maximum adsorption capacity attained, and aL (L·mg-1) is a constant related to the net enthalpy of adsorption. This equation is in the form of (2a), and can be transformed into a linear equation in the from of (2b) As with the previous example, we estimated the coefficients using both linear regression the solver add-in of Microsoft Excel® by minimizing the sum of the residual errors. The data used was from a batch study evaluing the sorption of methylene blue onto activated carbon. The initial concentration of adsorbate (methylene blue) ranged from 50 – 1400 mg·L-1 while a fixed mass of adsorbent (0.25g of filtrasorb 400) was used to set up this experiment. The results are presented in Table 2 and Figure 3. Visual examination of the graph shows that parameter estimation based on spreadsheet optimization is a better fit for the data. When the data was linearized, the R2 value of the linear regression was 0.9995, but RMSR based on the actual data was 22.272. The RMSR for the spreadsheet optimization method is 17.187, which indicates a better fit. This is consistent with the results of the previous example. We are not suggesting that this level of improvement would be evident in all systems, however, this does support the use of teaching this method in the undergraduate curriculum and utilizing it for model development in industry and research. TABLE 2 COMPARISON OF THE PARAMETER ESTIMATION METHODS FOR THE LANGMUIR
REDLICH-PETERSON ISOTHERM Redlich and Peterson [6] proposed an empirical equation, designated the “three parameter equation,” which may be used to represent adsorption equilibria over a wide concentration range:
qe =
K R Ce 1 + a R C ebR
(9)
where KR, aR, and bR are Redlich-Peterson parameters. This equation reduces to a linear isotherm at low surface coverage, and to the Langmuir isotherm when bR = 1. The two models considered so far have all been two parameter equations that employed linear transformation in order to determine and evaluate the quality of the model constants. However, Equation (3c) cannot be linearized to produce the values of the three parameters. Instead, parameter estimation was only determined using spreadsheet optimization. The experimental data used to evaluate this model is identical to that used for the Langmuir isotherm evaluation. The graphical results of parameter estimation of the Redlich-Peterson isotherm are presented in Figure 4. The RMSR of the fit is 17.147, the resulting parameters for KR, aR and bR were 22.852, 0.091 and 0.989.
ISOTHERM
KL
aL
R2
RMSR
LTRM
34.01
0.126
0.9995
22.272
Optimization
21.77
0.081
n/a
17.187
San Juan, PR
July 23 – 28, 2006 9th International Conference on Engineering Education T3D-15
Session T3D from the RMSR of 17.71 compared to 35.72, and visual inspection of the figure.
300 250
TABLE 3 COMPARISON OF MODELS FOR THE STRENGTH OF CONCRETE
qe, mg/g
200 150 100 Measured
50
a0
a1
a2
a3
RMSR
Regression
180.20
-378.24
2.79
-0.09
35.72
Optimization
182.65
-354.90
2.79
-0.12
17.71
Calculated 0 0
100
200
300
400 Ce, mg/L
500
600
700
200
800
Regression
150
Ymodel, Mpa
FIGURE 4 COMPARISON OF EXPERIMENTAL AND MODELED DATA FOR THE REDLICHPETERSON ISOTHERM
STRENGTH OF CONCRETE Concrete has been extensively used in the construction industry since the beginning of the 20th century. Concrete is a highly complex heterogeneous material. The properties of concrete can be widely varied depending on the appropriate selection and proportioning of constituent materials. The response of the material to stress depends on the mix ingredients and their interaction. The response to compressive forces is considered to be the most important property of concrete. Two major factors that are critical for concrete performance are the material matrix and water content [6]. Supplementary cementious materials, such as silica fume, fly ash and metakaolin are often partially substituted with cement in concrete to produce a high-performance concrete by improving the bond between the aggregate and the cement paste [7]. A decrease in the water to cement (w/c) ratio results in increased strength and reduced porosity in cement paste and hence the concrete becomes stronger and impermeable. While, relatively small number of data points may be sufficient to arrive at general conclusions, a comprehensive experimental design with sufficient data points and strong statistical tools are needed to develop accurate models to predict the effect of individual response on the strength of concrete. Previous research [8] determined that the model that best fits the analyzed data is presented by the following quadratic equation: y = a 0 + a 1 x 1+ a 2 x 2 + a 3 x 22
(10)
where y is the compressive strength in MPa, x1 is the water to binder ratio and x2 is the silica fume content. Table 3 summarizes the results of the parameter estimation of (10) using regression as well as spreadsheet optimization. Figure 5 presents a comparison of the raw data with the two models. As found with the other models evaluated, the fit using spreadsheet optimization provided a better fit, as evidence
Optimization
100
50
0 0
50
100
150
200
Ymeasured, Mpa FIGURE 5 COMPARISON OF SPREADSHEET OPTIMIZATION MODEL TO MEASURED DATA.
SUMMARY This paper presents several studies in civil and environmental engineering where spreadsheet optimization was used for parameter optimization. In three of the four cases, this method performed better than regression techniques. The comparisons included an example of multiple regression with two independent variables. In the fourth case, we demonstrated the use of this method for a three parameter equation. As stated previously, we are not suggesting that parameter estimation using spreadsheet optimization will always provide a better fit to the data. However, the results do support the use of teaching this method in the undergraduate curriculum and utilizing it for model development in industry and research.
REFERENCES [1]
Myers, R.H., “Classical and Modern Regression With Applications”, PWS-Kent, 1990.
San Juan, PR
July 23 – 28, 2006 9th International Conference on Engineering Education T3D-16
Session T3D [2]
Ratkowski, D.A., “Handbook Of Nonlinear Regression Models”, Marcel Dekker, 1990.
[8]
S.P. Shah, S.H. Ahmad, “High Performance Concretes and Applications,” Edward Arnold, London, 1994.
[3]
Porter, J.F., Mckay, G., and Choy, K.H., “The prediction of sorption from a binary mixture of acidic dyes using single and mixed-isotherm variants of the ideal adsorbed solute theory”. Chemical Engineering Science, 54, 1999, 5863-5885.
[9]
Samir Nacer, "Optimization of Silica Fume Content and Water to Enhance Performance of Concrete," Master’s Thesis, Dept. of Civil and Environmental Engineering, Southern Illinois University Carbondale, Dec. 2005.
[4]
Weber, W. J. Jr. and DiGiano, F.A. Process dynamics in environmental systems. John Wiley and Sons. 1996.
[5]
Langmuir, I., “The adsorption of gases on plane surface of glass, mica and platinum”, J. Am. Chem. Soc. 40, 1916,1361-1368.
[6]
Redlich, O and Peterson, D.L., “A useful adsorption isotherm”, J. Phys. Chem, 63, 1959, 1024.
[7]
S. Mindess, J.F. Young, D.C. Darwin, “Concrete,” 2nd edition, Prentice Hall, New Jersey, 2002.
San Juan, PR
July 23 – 28, 2006 9th International Conference on Engineering Education T3D-17