International Journal of Psychophysiology 94 (2014) 69–75
Contents lists available at ScienceDirect
International Journal of Psychophysiology journal homepage: www.elsevier.com/locate/ijpsycho
Calibration of an objective alertness scale Arcady A. Putilov ⁎, Olga G. Donskaya Research Institute for Molecular Biology and Biophysics, Siberian Branch of the Russian Academy of Medical Sciences, 2, Timakova Street, Novosibirsk 630117, Russia
a r t i c l e
i n f o
Article history: Received 3 January 2014 Received in revised form 25 July 2014 Accepted 27 July 2014 Available online 2 August 2014 Keywords: Subjective sleepiness Sleep deprivation EEG spectrum Principal component analysis Calibration Karolinska Sleepiness Scale
a b s t r a c t In order to establish validity of an objective scale of alertness–sleepiness, one is forced to somehow calibrate it using subjective scales, such as the Karolinska Sleepiness Scale (KSS). We evaluated the effects of prolonged wakefulness on the extent of disagreement between objective and subjective KSS assessments, and tested whether calibration of an objective alertness–sleepiness scale can be established despite the limited reliability of subjective reports. Starting from 7 p.m., the resting electroencephalogram (EEG) was recorded at 2-hour intervals over the last 32–50 h of 44–61-hour wakefulness of 15 healthy study participants. Frontal and occipital scores on the 2nd principal component of the EEG spectrum and occipital alpha-theta power difference were computed for 1-min intervals of 5-min eyes-closed EEG recordings. To obtain alertness scale scores in the range from 5 to 0, positive and negative values of these EEG indexes were assigned to 1 and 0, respectively, and then summed. Although correlation between time courses of objective and subjective (KSS) scores was very strong, evidence for systematic errors in both the mean and the calibration was also found. Correction of these errors resulted in strengthening of correlation (r = 0.99) and establishing one-to-one correspondence between the steps of objective and subjective scales. The results indicate that scores from 5 to 0 on the objective alertness scale can be anchored to minimal, mild, moderate, marked, severe, and disabling levels of sleepiness. © 2014 Elsevier B.V. All rights reserved.
1. Introduction Sleepiness plays an important role in the quality of everyday life, and the threats of increased sleepiness to public health, productivity, and safety are well-documented (Brousse et al., 2011; Hobbs et al., 2010; Mitler et al., 1988; Ohayon et al., 2010). Because measurement is the foundation of all science, researchers are not able to understand much or improve much if their approach to detection and measurement of sleepiness is incapable of providing accurate and precise results. However, sleepiness is a paradoxical vigilance state that opposes the well-established sleep in that nobody can reliably measure it despite everyone's ability to consciously perceive it. It is a subjective concept, and its research produced many controversial questions, such as whether the physiological component of subjective feeling of sleepiness might be precisely defined in scientific terms, and what might be a reliable physiological marker of drowsiness (Cluydts et al., 2002; Dinges, 2004; Horne, 2004). In spite of the extraordinary progress achieved in the field of circadian and sleep research in recent decades, the assessment of sleepiness remains among the most challenging scientific problems (Czeisler, 2011; Mullington et al., 2011; Quan et al., 2011). Experimental observations suggest that self-perceived levels of sleepiness do not always correspond reliably to objectively measured ⁎ Corresponding author at: 11, Nipkowstr, 12489 Berlin, Germany. Tel.: + 49 30 61290031; fax: +49 30 53674643. E-mail address:
[email protected] (A.A. Putilov).
http://dx.doi.org/10.1016/j.ijpsycho.2014.07.010 0167-8760/© 2014 Elsevier B.V. All rights reserved.
levels (i.e., Berka et al., 2004; Bishop et al., 1998; Hoch et al., 1992; Tremaine et al., 2010). For example, similar to the effects of alcohol, the negative effects of drowsiness are always subjectively underestimated (Czeisler, 2011). The reason for this might be the inability of sleepy participants to accurately identify the levels of drowsiness due to impaired cognitive functioning (Smith et al., 2005, 2009). On the other hand, experiments on sleep deprivation showed that the correlation coefficients between the decreases in subjective alertness and objective performance measures were often insignificant. Numerous studies suggested dissociation between objective indexes of neurobehavioral functioning and sleep pressure measured by subjective sleepiness scales (Carskadon and Dement, 1981; Frey et al., 2004; Herscovitch and Broughton, 1981; Philip et al., 2004; Van Dongen et al., 2003). Besides, these studies were confirmed by research based on comparison with objective markers of sleepiness. For instance, it was noted that many study participants tend to report a major deterioration of objective indexes of alertness–sleepiness while suffering only modest performance decrement (Leproult et al., 2003; Galliaud et al., 2008). It was also shown that sleep-restricted individuals are likely to underestimate the effect of sleepiness on their performance, and that the extent of mismatch between performance and subjective sleepiness was modulated by the circadian phase (Zhou et al., 2012). Consequently, experimental evidence led many researchers to the conclusion that subjective sleepiness provides a better gauge to sleepiness compared to objective measures of performance (Baulk et al., 2001; Horne and Baulk, 2003; Reyner and Horne, 1998; Smith et al., 2002; Van Dongen et al., 2004).
70
A.A. Putilov, O.G. Donskaya / International Journal of Psychophysiology 94 (2014) 69–75
Only the scales for subjective assessment of alertness–sleepiness levels can be regarded as the simplest and most user-friendly instruments of sleepiness quantification. One of such instruments, the Karolinska Sleepiness Scale (KSS), has become the most widely used tool for self-assessment of sleepiness. It was found to be a sensitive and reliable measure of drowsiness (Gillberg et al., 1994; Åkerstedt et al., 2014), and there were many successful attempts to validate it against different physiological measures (Filtness et al., 2012; Kaida et al., 2006; Marzano et al., 2007; van den Berg et al., 2005). Earlier (Putilov and Donskaya, 2013a) we proposed that the EEG recordings obtained on 5-min eyes closed interval of the Karolinska Drowsiness Test (KDT) can be used for construction of very simple but objective scales (e.g., the physiological analogous of KSS). Scores on such scales can be calculated by assigning positive and negative 1-min values of an EEG index to 1 and 0, respectively. We showed that KSS scores were significantly associated with scores on such an objective scale based on an EEG index, i.e., either alpha–theta power difference or score on the 2nd principal component of the EEG spectrum (Putilov and Donskaya, 2013a). Moreover, we found that changes in these EEG indexes were more strongly associated with changes in KSS score than with changes in objective measures of performance and self-assessed levels of energy and mood (Putilov et al., 2012). Since an objective sleepiness scale cannot be directly derived from subjective scales, it might be difficult to properly calibrate an objective scale (i.e., due to the abovementioned questionable reliability of subjective reports and dissociation between changes in sleepiness and objective performance measures). Nevertheless, one is always forced to somehow calibrate and validate an objective scale using subjective scales. Particularly, the subjective nature of sleepiness concept requires utilization of reports on self-perceived alertness–sleepiness levels on, at least, two, starting and final, steps of any effort to calibrate an objective scale. The questions arise as to whether our objective alertness scales can be applied for detecting systematic errors in subjective assessment of sleepiness, and whether correction of these errors opens a perspective of using self-reported subjective feelings for calibration of objective alertness scales. The aims of the present analysis were to detect systematic errors in subjective perception of sleepiness under condition of sleep deprivation, and to examine whether, despite the limited reliability of subjective reports, calibration of an objective alertness scale can be established. Particularly, a well-calibrated alertness scale would have a slope of one, i.e., one additional score on scale for objective measurement of alertness–sleepiness level would predict, on average, one additional score on scale for assessing levels of subjective feeling of sleepiness. Consequently, we tested the hypothesis that such one-to-one correspondence can be established through detection and correction of systematic errors in self-perception of sleepiness levels. 2. Method The protocol of the experiment has been extensively described in three previously published papers (Donskaya et al., 2012; Putilov et al., 2012; Putilov and Donskaya, 2013a). The study was performed in accordance with the ethical standards laid down in the Declaration of Helsinki. The experimental protocols were approved by the Ethics Committee of the Siberian Branch of the Russian Academy of Sciences. Informed written consent was obtained from each study participant. The experimental data set contains spectra calculated from recordings of resting the EEG signal from 7 male and 8 female participants. They ranged in age from 22 to 26 and from 19 to 24 years old (average ± standard deviation: 24.7 ± 1.9 and 21.6 ± 2.2, respectively). The EEG signal was recorded with 2-h interval in the eyes open and eyes closed conditions (2 and 5 min, respectively) starting from Friday evening (19:00). The study personnel ensured that the participants always remained awake between the EEG recordings. A participant
could terminate his/her further participation in the experiment when feeling an irresistible desire to sleep during one of the 2-hour intervals between the EEG recordings. On the other hand, he/she could receive a bonus depending upon the duration of his/her participation in the experiment. For instance, on the time interval between the 16th and 25th recording sessions, payment increased 100%. Nevertheless, the participants consequently dropped out of the experiment due to inability to resist sleepiness after the 16th (#4), 17th (#2, #5), 19th (#1, #3), 20th (#12, #13, #14), 21st (#15), and 23rd sessions (#7, and #11). The last (25th) session scheduled on Sunday evening (19:00) was completed by only 4 study participants (#6, #8, #9, and #10). The EEG signals were recorded from two electrodes referenced to the right ear via a 16-canal electroencephalograph (Neuron-Spectrum-2, Neurosoft, Ivanovo). Active electrodes were placed in the middle from the top of the head to forehead and midway between O1 and O2 (Fz–A2 and Oz–A2, respectively) of the International ten–twenty electrode system (Jasper, 1958). To fix the electrodes, Ten20 conductive paste was used (Nicolet Biomedical, Madison, Wisconsin, USA). The exact positions of active electrodes were preliminarily inked by a permanent marker, and the electrodes were removed after each recording session. The EEG signals were conditioned by high-pass, low-pass and notch filters (0.5 Hz, 35 Hz, and 50 Hz, respectively), sampled and stored in a hard disk with a frequency of 200 Hz. Prior to and following each EEG recording, the participants had to indicate their subjective sleepiness using the KSS. This is the 9-point verbally anchored scale with the major steps 1 = very alert, 3 = alert, 5 = neither alert nor sleepy, 7 = sleepy, but no problem to stay awake, 9 = very sleepy, great effort to stay awake, and the intermediate steps 2, 4, 6, and 8 that are not anchored verbally (Åkerstedt and Gillberg, 1990). Averaging pre- and post-session scores provided the total amount of 315 KSS scores ranging from 1 to 9 with the interval 0.5. In order to perform direct comparison of scorings on KSS with the 6-point objective alertness scale (see below), we calculated scores from 5 to 0 on a shorter (6-step) subjective alertness scale. Scores of the initial KSS between 1 and 4 were assigned to 5, scores 4.5 and 5 to 4, scores 5.5 and 6 to 3, scores 6.5 and 7 to 7, scores 7.5 and 8 to 1, and scores 8.5 to 9 to 0. Fig. 1a (left side) illustrates the time course of the mean subjective score that was calculated on the interval of 25 time points (50 h) by averaging across study participants. The EEG records were inspected visually and 2-s epochs containing artifacts were removed from further analysis. Power spectra for artifact-free 2-s epochs were computed using the FFTW package (Frigo and Johnson, 2005; see also www.fftw.org). Absolute powers (μV2) were calculated for 1-Hz frequency bandwidths ranging from 0.5 to 32.5 Hz. The spectra for artifact-free 2-s epochs were averaged on 1-min intervals of 5-min eyes closed section of each EEG recording session. All 1-min absolute single-Hz power values in the frequency range from 1 Hz to 16 Hz were converted into a natural logarithmic scale. The difference between alpha and theta powers was calculated by subtracting values averaged over theta band (5 Hz–8 Hz) from values averaged for alpha band (9 Hz–12 Hz). The sets of log-transformed 16 single-Hz powers were subjected to principal component analysis using the SPSS statistical software package (SPSS Inc., Chicago, IL, version 17.0). The two largest principal components were extracted from data on each of two derivations. Each 1-min set of 16 powers was decomposed into two principal component scores. In order to calculate a score on the 2nd component, the 16 original powers of each power set were optimally weighted in accord with their loadings on this component and then summed. More details regarding the methodology of principal component analysis of the EEG spectrum were reported earlier (Donskaya et al., 2012; Putilov, 2010, 2011, 2013; Putilov et al., 2012; Putilov and Donskaya, 2013a, b). Scores on the 2nd principal component in frontal and occipital derivations and difference between alpha and theta powers in occipital derivation were utilized for calculation of three primary objective alertness scales. To calculate a score from 5 to 0 on a primary objective
A.A. Putilov, O.G. Donskaya / International Journal of Psychophysiology 94 (2014) 69–75
71
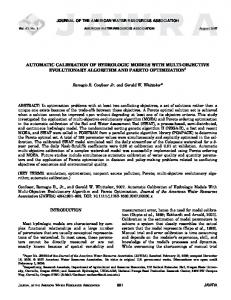
Fig. 1. Time courses of alertness scores. (a) Objective and subjective scores from the results of one-way ANOVAs with factor “Time” (points from 1st to 25th). Group-averaged time course of score on the 6-step objective alertness scale (filled squares and solid lines) ± 95% confidence interval (vertical bars and dashed lines) vs. group-averaged time course of score on the 6-step subjective alertness scale based on KSS (open circles and dotted lines) before and after correction (left and right sides, respectively). (b) Differential scores. Time course of group-averaged difference obtained by subtracting subjective score from objective score (filled diamonds and dot-dashed lines) ± 95% confidence interval (vertical bars and dashed lines) vs. group-averaged time course of score on the 6-step subjective alertness scale (open circles and dotted lines) before and after correction (left and right sides, respectively).
alertness scale, all positive values of an EEG index for 5 1-min intervals of eyes closed section of the EEG record were assigned to 1, whereas all remaining (negative) values were assigned to 0. After averaging over three primary scales, scores between 4.67 and 4 were assigned to 4, scores between 3.67 and 3 to 3, scores between 2.67 and 2 to 2, scores between 1.67 and 1 to 1, and scores below 1 to 0. Fig. 1a (left and right sides) illustrates mean scores for 25 time points and their confident intervals thus providing comparison with the time course of subjective (KSS) scores. Spearman coefficients of correlation were used for correlating time courses of objective sleepiness score with time courses of subjective (self-reported and corrected) scores. Additionally, these time courses were correlated with the time elapsed since self-reported awakening. Table 1 (left side) illustrates distribution of the sets of 315 scores (objective, subjective, and differential scores that were computed by subtracting the subjective score from the corresponding objective score). Since, generally speaking, subjective scales are used differently by different study participants, we tried to detect and account for such differences. Two-way ANOVA with “Objective alertness level” (6 steps) as a fixed factor, and “Participant” (N = 15) as a random factor was applied for examining significance of differences between 6 steps of objective scale as well as for testing differences between individuals on the extent of deviation of objective scores from subjective scores. All p-values were based on the Huynh-Feldt correction of the degrees of freedom to control for type 1 error associated with violation of the assumption of sphericity. Fig. 2a illustrates the results of differential scores
indicating that almost half of the study participants might be classified as being “sleepiness under-estimators”. Since it was expected that sleepiness is usually under-estimated in the condition of very long sustained wakefulness, we additionally tried to detect and account for changes in the mismatch between objective and subjective scores. Significance of the differences between time points on the extent of dissociation between objective and subjective scores was tested by applying one-way ANOVA with factor “Time” (N = 16 to 25). Fig. 1b illustrates the results of the time course of differential score pointing to the possibility that mismatch between objective and subjective scores gradually increased across the experiment. Such analyses of relationship between objective and subjective scorings prompted a simple way of correction of subjective scores. Starting from the 28th hour of wakefulness, each non-zero score reported by any of the “sleepiness under-estimators” was lowered in one score. Then, each non-zero score reported by each still waking participant was lowered again in one score after 56 h of wakefulness. The analyses were repeated to provide comparison of objective scores with these corrected subjective scores. The results of such analyses are illustrated in Tables 1 (right side), Fig. 1 (right side) and Fig. 2b. Additionally, the results of correction of subjective scores were examined by running two-way ANOVAs with “Measure” (objective vs. subjective, either uncorrected or corrected) as a fixed factor, and “Participant” (N = 15) as a random factor. The significance level was set at p = 0.05.
72
A.A. Putilov, O.G. Donskaya / International Journal of Psychophysiology 94 (2014) 69–75
Table 1 Distributions of alertness scores. Before correction
After correction
Subjective alertness scale score 0
1
2
Sum
13
34
49
Difference
Objective alertness scale score
−5 5 −4 4 −3 3 −2 2 −1 1 0 Sum Score
Sum
47
4
5
88
84
0
1
2
3
4
5
2 0 22 0 9 0 20 0 13 0 8 74 1.9
0 0 11 0 4 0 6 0 8 4 9 42 2.6
0 0 0 0 12 0 4 1 7 6 3 33 3.4
0 0 0 0 0 0 7 1 9 2 6 25 4.0
0 0 0 0 0 3 0 5 16 8 14 46 3.8
0 0 0 2 0 11 0 11 0 35 36 95 4.2
Subjective alertness scale score
Sum
0
1
2
3
4
5
315
36
39
43
63
81
53
Sum
Objective alertness scale score
0 0 33 2 25 14 37 18 53 55 76 315 3.3
315 Sum
0
1
2
3
4
5
0 0 3 0 18 0 8 0 21 0 24 74 1.1
0 0 6 0 5 0 6 0 10 8 7 42 2.1
0 0 0 0 2 0 11 3 8 4 5 33 2.8
0 0 0 0 0 1 3 1 12 3 5 25 3.6
0 0 0 0 0 4 0 6 10 11 15 46 3.6
0 0 0 2 0 11 0 15 0 35 32 95 4.1
0 0 9 2 25 16 28 25 61 61 88 315 2.9
Note. SAS: 6-step subjective alertness scale based on the 9-step KSS score. Score: SAS score for each step of alertness scale before and after correction of SAS (from the results of two-way ANOVA with fixed factor “Objective alertness level”, 6 steps, and random factor “Study participant”, N = 15). Difference: SAS score subtracted from objective alertness scale score.
Fig. 2. Differential scores for each of 15 participants and for each of 6 steps of objective scale. (a) and (b): Differential and subjective scores before (a) and after (b) correction of subjective scores (from the results of one-way ANOVAs). Mean difference between objective and subjective scores (filled diamonds and dot-dashed lines) ± 95% confidence interval (vertical bars and dashed lines) vs. mean score on the 6-step subjective alertness scale (open circles and dotted lines) for each of 15 participants and for each of 6 steps of objective alertness scale (left and right sides, respectively). The participants (# from 1 to 15) were ordered in accord with their mean differential score.
A.A. Putilov, O.G. Donskaya / International Journal of Psychophysiology 94 (2014) 69–75
3. Results Fig. 1a illustrates similarity between the group-averaged time courses calculated for scores in the 6-step KSS and the 6-step objective alertness scale. The correlation coefficient attained a value above 0.93. Such association between the group-averaged time courses was found to be stronger than any of 15 associations between the individual time courses (from 0.00 to 0.84). This result suggests that, in general, an individual could not accurately assess the magnitude of decline of his/her alertness. However, the random errors in sleepiness self-estimation could be averaged out, at least partially, by calculating group mean scores. Additionally, it was also noted that the time course of an objective score strongly correlated with the time course of time elapsed since awakening (≤ 0.93), but somewhat weaker correlation was shown by the time course of a subjective score (−0.82). Individual variation in correlation coefficient suggests that selfreports of some study participants were not precise. It seems that they could inaccurately report the changes in sleepiness caused by the influence of the circadian and homeostatic regulatory processes. For example, correlations were insignificant in four study participants (0.00, 0.22, 0.35, and 0.40). Visual inspection of objective and subjective time courses revealed that, although both subjective and objective scores of these participants accurately reflected the circadian variation of the level of alertness/sleepiness, each of two time courses or, at least, one of them failed to demonstrate a clear gradual increase of sleepiness level occurring in the course of accumulation of time since awakening (most probably, homeostatic sleep–wake regulating process was responsible for such an increase). When subjective scores were corrected (in 10 of 15 participants), the correlation with the time course of objective score was always strengthened. For the group-averaged curves, the correlation coefficient between the time courses of corrected subjective score and objective score attained the value 0.99 (Fig. 1a, right side). Data reported in Table 1 (left side) indicate that only small differences between objective and uncorrected subjective scores were normally distributed. This was not the case for larger differences, because with decrease of objective score the negative differences (− 5, − 4, −3, and −2) considerably over-numbered the corresponding positive differences. Such asymmetry became less prominent after correction of subjective scores (Table 1, right side). Comparison of top and bottom plots in Fig. 2 (a, b) indicates that asymmetry between positive and negative differences at the end of the experiment also became less evident for the individual scores after correction of subjective scores (Fig. 2b). However, one-way ANOVA did not reveal the effect of factor “Time” on differential score. Most probably, the reasons for insignificance of this effect were i) very large inter-individual differences in this score, ii) random errors in sleepiness self-perception, and iii) a small number of those study participants who were still able to keep awake during Sunday. Mean differential score was found to be remarkably lower than 0 before but not after correction of subjective score (−0.78 with standard error of mean or SEM = 0.12 vs. − 0.21 with SEM = 0.11, respectively). The results of two-way ANOVAs revealed significant main effect of factor “Measure” (objective vs. uncorrected subjective score: F1, 580 = 41.6, p b 0.001). This effect became insignificant after correction of subjective score (F1, 580 = 3.1, p = 0.078). However, the main effect of factor “Objective alertness level” remained significant for differential score after such correction (F5, 235 = 32.6, p b 0.001, and F5, 235 = 18.9, p b 0.001, respectively). These analyses showed that mean objective score was equal to 2.36 (SEM = 0.09), subjective score declined from 3.14 (SEM = 0.09) to 2.57 (SEM = 0.08), and mean differential score changed from −0.77 (SEM = 0.08) to −0.37 (SEM = 0.08). Thus, despite strong association between time courses of scores on the objective and KSS scales (see Fig. 1a, left side), some systematic errors in both the mean and the calibration were recognized (see Fig. 1b, left side). The relationship between objective and subjective
73
scores gradually changed in the course of the experiment (see Fig. 1b, left side). The participants did not report relatively lower subjective sleepiness at the beginning of the experiment that contrasted with a clear tendency for reporting relatively lower sleepiness in the last experimental hours (see Fig. 1a, left side). Differences between objective and subjective scores at the beginning and the end of the experiment exceeded one score (see Fig. 1b, left side). The corrected differential scores varied in a much narrower range (see Fig. 1b, right side), and correlation between objective and corrected scores was very strong (see Fig. 1a, right side). These results suggest that the vast majority of errors in the calibration were corrected through accounting for the effect of sleep deprivation on the extent of misperception of sleepiness. Most notably, almost one-to-one correspondence between scores on objective and subjective scales was achieved by simple one-score correction of non-zero scores of “sleepiness under-estimators” after 28 h of wakefulness followed by a similar correction of non-zero scores of still awake participants after 56 h of wakefulness. In terms of the corrected KSS scorings, the six consecutive steps of objective alertness scale from 5 to 0 might be regarded as reflecting a gradual change in alertness–sleepiness from alert rather than sleepy state to extremely sleepy state, i.e., from 5 = 4 (an intermediate step) and 3 (alert), through 4 = 5 (neither alert nor sleepy), 3 = 6 (an intermediate step), 2 = 7 (sleepy, but no problem to stay awake), and 1 = 8 (an intermediate step) to 0 = 9 (very sleepy, great effort to stay awake). Briefly, such six steps down from 5 to 0 can be roughly assigned to changes in the feelings of sleepiness from minimal sleepiness through mild, moderate, marked, and severe sleepiness to disabling sleepiness. 4. Discussion In spite of the extraordinary progress made by circadian and sleep science in the last decades, the quantitative measurement of sleepiness remains one of the most challenging problems (Czeisler, 2011; Mullington et al., 2011; Quan et al., 2011). Earlier we demonstrated that rather simple scales for objective measurement of alertness–sleepiness can be constructed from data on the EEG recordings obtained during 5-min eyes closed interval of KDT (Putilov and Donskaya, 2013a). The question arises as to how such scales can be calibrated. On the one hand, we know with high confidence about the discrepancy between actual and self-perceived levels of drowsiness, but on the other hand, dissociation between changes in sleepiness and objective performance measures does not allow the utilization of neurobehavioral tests for such calibration. Therefore, many researchers concluded that subjective assessments of drowsiness provide a better gauge to sleepiness compared to these objective measures (see Introduction for references). It seems that, for establishing validity of an objective scale of alertness, the researchers are always forced to somehow calibrate this objective scale by using subjective scales. Consequently, the present report was aimed at testing the suggestions that systematic errors in self-reports of sleepiness level obtained with a subjective scale (i.e., such as the KSS) can be identified, and that the corrected subjective scorings can be used for calibrating an objective scale (i.e., a scale based on the proposed EEG markers of sleepiness). More specifically, a perfectly calibrated scale is expected to have a slope of one: one additional step of objectively-measured sleepiness would predict, on average, one additional step of subjectively reported sleepiness. Therefore, we tested the particular suggestion that correction of subjective scores can reveal a one-to-one correspondence between changes in objective and subjective scorings of sleepiness during sustained wakefulness. The present results provided evidence for systematic errors in both the mean and the calibration (Fig. 1 and Table 1, left sides). First of all, we confirmed the findings indicating that the awareness of the amplifying effect of prolonged wakefulness on sleepiness levels varies between individuals (i.e., reviewed in Van Dongen and Belenky, 2009). It was found that not all study participants were able to accurately perceive their sleepiness and almost half of them demonstrated a tendency to
74
A.A. Putilov, O.G. Donskaya / International Journal of Psychophysiology 94 (2014) 69–75
overestimate their alertness level already after the first circadian through the alertness curve (Fig. 1 and Table 1). Additionally, we noted that all those who managed to successfully fight drowsiness after the second circadian through were also incapable of accurately determining how sleepy they were. Therefore, we proposed a very simple rule of correction that required one-score lowering of subjective self-reports of “sleepiness under-estimators” and all still active participants after 28 and 56 h of permanent wakefulness, respectively. This correction led to the change in correlation coefficient from 0.93 to 0.99. This and other results supported the suggestion that the calibrated scale might have a slope of one, and, hence, the consecutive steps of the objective alertness scales can be anchored to the last 6 steps of the KSS. It seems that such calibrating results are in agreement with earlier reported findings on the associations of the studied EEG indexes of sleepiness with the changes in sleepiness across wake–sleep transitions. For instance, the recently suggested revision of the sleep scoring rules considers attenuation of alpha rhythm in occipital derivation as the best EEG marker of sleep onset (Iber et al., 2007; Silber et al., 2007), and the alpha-attenuation test was invented as one of the instruments of sleepiness detection (Stampi et al., 1995). In Makeig and Jung (1995), it was demonstrated that the changes in performance are closely associated with the 2nd principal component of the EEG spectrum, and, more recently, we published the results showing that the rapid decline of this component score can serve as a marker of the borderline between wakefulness and stage 1 sleep (Putilov, 2010, 2011, 2013, 2014a,b; Putilov and Donskaya, 2013b). In fact, zero score on our alertness scale indicates initiation of sleep as early as during the first minute with eyes closed. It is likely, that zero score corresponds to disabling or severe sleepiness level, i.e., zero waking ability. We also noted that a study participant who dropped off among the first can report a KSS score lower than 7 (sleepy, but no problem to stay awake) until the very end of his/her participation in the experiment. Therefore, it is reasonable to conclude that the detected dissociation between objective and subjective scores in the second part of the experiment was caused by inability (or unwillingness) of some of study participants to recognize the dramatic decline of their alertness level. This result opens an intriguing perspective of implication of this simple method of correction of subjective scorings into applied research aimed on identifying situations or individuals that are characterized by biased self-reports of alertness–sleepiness levels. The limitations of the present analysis include the small sample size and too narrow range of ages of the study participants. Particularly, our sample does not include adolescents and older adults, patients and people with some specific features of their EEG (e.g., those without prominent alpha rhythm). Future research lacking these limitations might provide a deeper insight into intra- and inter-individual differences in scorings on the proposed objective scale as well as into the particular reasons for mismatch between objective and subjective scoring. To conclude, in order to calibrate the earlier proposed 6-step objective alertness scale, the biases in self-scoring on the 9-step KSS were analyzed. A good correspondence of the 6 steps of our objective scale with the 6 final steps of KSS was established only after applying a simple rule of correcting subjective scores that accounts for the influence of prolongation of wakefulness on the extent of misperception of alertness– sleepiness levels. A decline of score on the objective scale from 5 through 4, 3, 2, and 1 to 0 was anchored to a gradual change in physiological sleepiness levels from minimal through mild, moderate, marked, and severe to disabling. Authors' note The research was supported by the Russian Foundation for Basic Research (grants 07-06-00263-а, 10-06-00114-а, and 13-06-00042-а), and the Russian Foundation for Humanities (grants 06-06-00375-a and 12-06-18001-e). We are indebted to Dr. Evgeniy G. Verevkin for his help in the EEG recordings and analyses.
References Åkerstedt, T.,Gillberg, M., 1990. Subjective and objective sleepiness in the active individual. Int. J. Neurosci. 52, 29–37. Åkerstedt, T.,Anund, A.,Axelsson, J.,Kecklund, G., 2014. Subjective sleepiness is a sensitive indicator of insufficient sleep and impaired waking function. J. Sleep Res. 23, 240–252. Baulk, S.D., Reyner, L.A., Horne, J.A., 2001. Driver sleepiness evaluation of reaction time measurement as a secondary task. Sleep 24, 695–698. Berka, C., Levendowski, D.J., Olmstead, R.E., Popovic, M.V., Cvetinovic, M., Petrovic, M.M., Davis, G., Lumicao, M.N., Westbrook, P., 2004. Real-time analysis of EEG indices of alertness, cognition and memory with a wireless EEG headset. Int. J. Hum. Comput. Interact. 17, 151–170. Bishop, C.,Rosenthal, L.,Folkerts, M.,Nykamp, K.,Helmus, T.,Guido, P.,Syron, M.L.,Roehrs, T., Rice, M., Roth, T., 1998. The perception of sleep as a function of the level of daytime sleepiness among patients with obstructive sleep apnea. Compr. Psychiatry 39, 312–317. Brousse, E., Forget, C., Riedel, M., Marlot, M., Mechhkouri, M., Smolensky, M.H., Touitou, Y., Reinberg, A.E., 2011. 24-hour patterns in lag time of response by fireman to calls for urgent medical aid. Chronobiol. Int. 28, 275–281. Carskadon, M.A., Dement, W.C., 1981. Cumulative effects of sleep restriction on daytime sleepiness. Psychophysiology 18, 107–113. Cluydts, R., De Valck, E., Verstraeten, E., Theys, P., 2002. Daytime sleepiness and its evaluation. Sleep Med. Rev. 6, 83–96. Czeisler, C.A., 2011. Impact of sleepiness and sleep deficiency on public health: utility of biomarkers. J. Clin. Sleep Med. 7, S6–S8. Dinges, D.F., 2004. Sleep debt and scientific evidence. Sleep 27, 1050–1052. Donskaya, O.G., Verevkin, E.G., Putilov, A.A., 2012. The first and second principal components of the EEG spectrum as the indicators of sleepiness. Somnologie 16, 69–79. Filtness, A.J.,Reyner, L.A.,Horne, J.A., 2012. Driver sleepiness-comparisons between young and older men during a monotonous afternoon simulated drive. Biol. Psychol. 89, 580–583. Frey, D.J., Badia, P., Wright Jr., K.P., 2004. Inter- and intra-individual variability in performance near the circadian nadir during sleep deprivation. J. Sleep Res. 13, 305–315. Frigo, M., Johnson, S.G., 2005. The design and implementation of FFTW3. Proc. IEEE 93, 216–231. Galliaud, E., Taillard, J., Sagaspe, P., Valtat, C., Bioulac, B., Philip, P., 2008. Sharp and sleepy: evidence for dissociation between sleep pressure and nocturnal performance. J. Sleep Res. 17 (1), 11–15. Gillberg, M.,Kecklund, G.,Akerstedt, T., 1994. Relations between performance and subjective ratings of sleepiness during a night awake. Sleep 17, 236–241. Herscovitch, J., Broughton, R., 1981. Sensitivity of the Stanford sleepiness scale to the effects of cumulative partial sleep deprivation and recovery oversleeping. Sleep 4, 83–91. Hobbs, A., Williamson, A., van Dongen, H.P.A., 2010. A circadian rhythm in skill-based errors in aviation maintenance. Chronobiol. Int. 27, 1304–1316. Hoch, C.C.,Reynolds III, C.F.,Jennings, J.R.,Monk, T.H.,Buysse, D.J.,Machen, M.A.,Kupfer, D.J., 1992. Daytime sleepiness and performance among healthy 80 and 20 year olds. Neurobiol. Aging 13, 353–356. Horne, J., 2004. Is there a sleep debt? Sleep 27, 1047–1049. Horne, J.A., Baulk, S.D., 2003. Awareness of sleepiness when driving. J. Psychophysiol. 41, 161–165. Iber, C.,Ancoli-Israel, S.,Chesson, A.L.,Quan, S.F., 2007. The AASM Manual for the Scoring of Sleep and Associated Events: Rules, Terminology and Technical Specifications. American Association of Sleep Medicine, Westchester, IL. Jasper, H.H., 1958. The ten–twenty electrode system of the International Federation. Electroencephalogr. Clin. Neurophysiol. 10, 371–375. Kaida, K.,Takahashi, M.,Åkerstedt, T.,Nakata, A.,Otsuka, Y.,Haratani, T.,Fukasawa, K., 2006. Validation of the Karolinska sleepiness scale against performance and EEG variables. Clin. Neurophysiol. 117, 1574–1581. Leproult, R., Colecchia, E.F., Berardi, A.M., Stickgold, R., Kosslyn, S.M., Van Cauter, E., 2003. Individual differences in subjective and objective alertness during sleep deprivation are stable and unrelated. Am. J. Physiol. Regul. Integr. Comp. Physiol. 284, R280–R290. Makeig, S.,Jung, T.P., 1995. Changes in alertness are a principal component of the variance in the EEG spectrum. Neuroreport 7, 213–216. Marzano, C., Fratello, F., Moroni, F., Pellicciari, M.C., Curcio, G., Ferrara, M., Ferlazzo, F., De Gennaro, L., 2007. Slow eye movements and subjective estimates of sleepiness predict EEG power changes during sleep deprivation. Sleep 30, 610–616. Mitler, M.M.,Carskadon, M.A.,Czeisler, C.A.,Dement, W.C.,Dinges, D.F.,Graeber, R.C., 1988. Catastrophes, sleep, and public policy: consensus report. Sleep 11, 100–109. Mullington, J.M.,Czeisler, C.A., Goel, N.,Krueger, J.M., Balkin, T.J.,Johns, M., Shaw, P.J., 2011. Panel discussion: current status of measuring sleepiness. J. Clin. Sleep Med. 7, S22–S25. Ohayon, M.M., Smolensky, M.H., Roth, T., 2010. Consequences of shiftworking on sleepiness, and sleep attacks. Chronobiol. Int. 27, 575–589. Philip, P., Taillard, J., Sagaspe, P., Valtat, C., Sanchez-Ortuno, M., Moore, N., Charles, A., Bioulac, B., 2004. Age, performance and sleep deprivation. J. Sleep Res. 13, 105–110. Putilov, A.A., 2010. Principal component structure of wake–sleep transition: quantitative description in multiple sleep latency tests. Somnologie 14, 234–243. Putilov, A.A., 2011. Principal components of electroencephalographic spectrum as markers of opponent processes underlying ultradian sleep cycles. Chronobiol. Int. 28, 287–299. Putilov, A.A., 2013. The EEG indicators of the dynamic properties of sleep-wake regulating processes: comparison of the changes occurring across wake–sleep transition with the effects of prolonged wakefulness. Biol. Rhythm. Res. 44, 621–643.
A.A. Putilov, O.G. Donskaya / International Journal of Psychophysiology 94 (2014) 69–75 Putilov, A.A., 2014a. When does this cortical region drop off? Principal component structuring of the EEG spectrum yields yes-or-no criteria of local sleep onset. Physiol. Behav. 133, 115–121. Putilov, A.A., 2014b. Rapid changes in scores on principal components of the EEG spectrum do not occur in the course of “drowsy” sleep of varying length. Clin. EEG Neurosci. 45 (online: http://eeg.sagepub.com/content/early/2014/03/31/1550059413519079? papetoc). Putilov, A.A., Donskaya, O.G., 2013a. Construction and validation of the EEG analogues of the Karolinska sleepiness scale based on the Karolinska drowsiness test. Clin. Neurophysiol. 124, 1346–1352. Putilov, A.A., Donskaya, O.G., 2013b. Rapid changes in scores on the two largest principal components of the electroencephalographic spectrum demarcate the boundaries of drowsy sleep. Sleep Biol. Rhythms 11, 154–164. Putilov, A.A., Donskaya, O.G., Verevkin, E.G., 2012. Quantification of sleepiness through principal component analysis of the EEG spectrum. Chronobiol. Int. 29, 509–522. Quan, S.F., Shaw, P.J., Naidoo, N., Haeggström, E., Krueger, J.M., Church, G.M., 2011. Panel discussion: can there be a biomarker for sleepiness? J. Clin. Sleep Med. 7, S45–S48. Reyner, L.A., Horne, J.A., 1998. Falling asleep at the wheel: are drivers aware of prior sleepiness? Int. J. Legal Med. 111, 120–123. Silber, M.H., Ancoli-Israel, S., Bonnet, M.H., Chokroverty, S., Grigg-Damberger, M.M., Hirshkowitz, M., Kapen, S., Keenan, S.A., Kryger, M.H., Penzel, T., Pressman, M.R., Iber, C., 2007. The visual scoring of sleep in adults. J. Clin. Sleep Med. 3, 121–131. Smith, M.E., McEvoy, L.K., Gevins, A., 2002. The impact of moderate sleep loss on neurophysiologic signals during working memory task performance. Sleep 25, 784–794.
75
Smith, S., Carrington, M., Trinder, J., 2005. Subjective and predicted sleepiness while driving in young adults. Accid. Anal. Prev. 37, 1066–1073. Smith, S.S., Horswill, M.S., Chambers, B., Wetton, M.A., 2009. Hazard perception in novice and experienced drivers: the effects of sleepiness. Accid. Anal. Prev. 41, 729–733. Stampi, C., Stone, P., Michimori, A., 1995. A new quantitative method for assessing sleepiness: the alpha attenuation test. Work Stress. 9, 368–376. Tremaine, R., Dorrian, J., Lack, L., Lovato, N., Ferguson, S., Zhou, X., Roach, G., 2010. The relationship between subjective and objective sleepiness and performance during a simulated night-shift with a nap countermeasure. Appl. Ergon. 42, 52–61. van den Berg, J.,Neely, G.,Nilsson, L.,Knutsson, A.,Landström, U., 2005. Electroencephalography and subjective ratings of sleep deprivation. Sleep Med. 6, 231–240. Van Dongen, H.P.,Belenky, G., 2009. Individual differences in vulnerability to sleep loss in the work environment. Ind. Health 47, 518–526. Van Dongen, H.P., Maislin, G., Mullington, J.M., Dinges, D.F., 2003. The cumulative cost of additional wakefulness: dose–response effects on neurobehavioral functions and sleep physiology from chronic sleep restriction and total sleep deprivation. Sleep 26, 117–126. Van Dongen, H.P.A.,Baynard, M.D., Maislin, G., Dinges, D.F., 2004. Systematic interindividual differences in neurobehavioral impairment from sleep loss: evidence of trait-like differential vulnerability. Sleep 27, 423–433. Zhou, X., Ferguson, S.A., Matthews, R.W.,Sargent, C., Darwent, D., Kennaway, D.J., Roach, G. D., 2012. Mismatch between subjective alertness and objective performance under sleep restriction is greatest during the biological night. J. Sleep Res. 21, 40–49.