Can a user centred approach to designing a user interface for rural communities be successful? Delene Heukelman Durban Institute of Technology P.O.Box 953, Durban , South Africa, 4000 (+27 31) 3085562
[email protected] ABSRACT
public phones, fixed telephone lines, cellular phone and internet connections [7]. The question is, how well will all these resources be utilised?
The aim of this study is to develop a model for the design and implementation of user interfaces for rural communities. Small enterprise owners were taught computer and business management skills. The research questions concerned the involvement in the design and evaluation of user interfaces by users with low levels of user interface experiences and low levels of computer literacy, the effect of raising the level of computer literacy, and the preferred communication method of the users with the design team. Results show that users with low user interface experience could evaluate options presented, but could not design the user interface, language should be selected by the user and the preferred communication channel was face-to-face.
The first obstacle to overcome would be the general level of computer literacy of the people in the area. Merely providing the technology will not lead to a large number of people using it. Furthermore, training people to become computer literate alone would also not necessarily lead to an increased use of the technology. Technology must serve some purpose. It is a tool to be used to achieve some goal. The community must be able to identify applications that could serve to achieve some goals. Access to basic health care information and governmental services could be used as a purpose to use the technology. Studies in rural areas in Asia showed that “in the battle against poverty, microfinance has emerged as one of the most potent weapons” [5]. In these studies, Media Lab researchers used existing micro-finance practices as the basis to introduce users to the use of the software as a tool. Since many small enterprises exist in the rural areas of South Africa, this was identified as a possible vehicle to improve the computer literacy levels of people in these areas. This means that together with the provision of the technology, some kind of training had to be given.
Keywords
User centred design, rural communities, user interface language, icon evaluation. INTRODUCTION
Efforts to install information and communication technologies in rural areas have been made world wide. The Scottish Executive “is committed to closing the ‘digital divide’, aiming to support universal access to internet by 2005” [8]. At a recent Community Informatics Research Network conference in Cape Town [2], efforts from many areas all over the world were described.
Multi Purpose Communication Centres (MPCC’s), such as the one used in this research, have been established in many rural areas. Mr. David Barnard, SANGONeT (South African NGO Network) executive director, believes that telecentres could be the key to bridging the divide between those who have access to computers and those who do not. “In South Africa these initiatives have however, not yet reached their full potential” [2]. Some key issues were identified, of which local content was one of the issues. “Telecentre managers report visitors asking, if the internet was for them or for other people” [2]. Working with a user interface designed for 1st world users could make inexperienced computer users feel that it was not intended for their use. It was agreed that the documentation of local knowledge in local content projects should start sooner than later. Websites with more local content structured around local needs could be developed. What should these websites look like?
Currently there are also many initiatives to provide ICT infrastructure in the rural areas of South Africa. “Rural communities across South Africa will get new phones and internet connections from Under-Serviced Area Licencetenders” and according to Makhaye, R15 million is to be spent over a period of 3 years to install Permission to make digital or hard copies of all or part of this work for personal or classroom use is granted without fee provided that copies are not made or distributed for profit of commercial advantage and that copies bear this notice and the full citation on the first page. To copy otherwise, to republish, to post on servers or to redistribute to lists, requires prior specific permission and/or a fee. CHI-SA 2006 Cape Town, South Africa. Copyright ACM SIGCHI South Africa Chapter. 2006"
51
User interfaces for rural communities
supports this and says “most users are good at reacting to product designs and notoriously bad at identifying the sources of their reactions” [11].
The question that needs to be asked is how do we design user interfaces that will promote the utilisation of these Information and Communication Technology developments in rural areas? What are the computer user interface needs of rural communities? Are they any different from urban communities?
All of this suggests that the user is only required to review and evaluate the user interface or parts there of. The basic design of the user interface depends on the quality of the design team’s interpretation of the users’ goals and tasks. If this is the strategy to be followed, some questions arise. How will different cultures and languages influence the quality of the interpretation of the design team? If users are to review the tasks identified by the design team, the prototype and product, what skills must these users have to be able to make significant contributions? What is the best way to communicate with the users about the interface?
This study is part of a project that aims to develop small enterprises in rural areas. This component of the project aims to research issues around user interfaces to facilitate better access to and use of information and communication technology in rural areas. User centred design
To design a good user interface the Principles of Computer Human Interaction suggest a user centred approach to designing the user interface. What is a user centred design approach? Does this mean involving the users in the design process? Must they comment on the end product, help design parts or the whole user interface, or must they choose from predesigned features? Are users invited to contribute towards the final product, or are their tasks and goals analysed and incorporated in the design of the user interface? In the key principles of user centred design as described on the website of usabilitynet.org, the designer must “bear in mind the characteristics of the user population, their real-world tasks, and their working environment” [14]. Randy Stoecker asks why so many community technology centres in the United States look so much the same and concludes that it is because “community participation is promoted, but only rarely practiced” [12]. While Human Computer Interaction principles advocate a user centred design approach, it is not clear how it must be implemented, especially in rural communities.
Aims of the study
The aim of the whole study is to develop a model for the design and implementation of user interfaces for rural communities. It is clear that the users need to be involved with the design of a user interface to be used in their community, but how and to what level must they be involved? The research questions to be answered by this component of the study were: • How much involvement in the design and evaluation of user interfaces could be expected from users with low levels of user interface experiences and low levels of computer literacy? • Could users who have a very basic level of computer literacy significantly contribute towards the design of a user interface? • How would users communicate with the design team? Answers to these questions would enable designers to focus their attentions on achievable initiatives when involving users from rural areas, rather than following the easy way out of presenting users with a finished product. Designers often erroneously believe that they know what the users need, especially inexperienced computer users.
There are also many different views about what a user centred design approach means. Alan Cooper, a software author whose industry credits include the visual programming interface for Microsoft's Visual Basic, suggests the following: “Conduct a broad investigation of the users of the product” and “create personas, or virtual users, with real lives, jobs and goals who replace the elastic, faceless user and serve as design tools” [6]. The software designer must therefore interpret the needs of the users and ensure that those needs are met. When does the user see the product, during different design phases or only once the product has been completed?
RESEARCH METHODOLOGY
The research was qualitative in nature as it involved “the use of predominantly qualitative research methods to describe and evaluate the performance of programmes in their natural settings” [9]. A qualitative approach was selected to allow the research team to work within a natural setting with the limitations associated with the setting. Mutual trust had to be developed and an interpreter was extensively used, to ensure that language did not become a barrier.
Achenbach suggests that “once the team has come up with a conceptual design of the "role content" (that is, all the applications and information needed to accomplish the user's tasks), it is a good idea to have real users review it. The same applies to the user interface prototypes that are created later in the process” [1]. This suggests that the user’s tasks form the basis of the design and the user then only has to review the prototypes and product. Paul Smith
A case study
A case study combined with action research was used. The specific aspects that were studied were the level of user interface experience, whether participants with a
52
very basic level of computer literacy have the ability to evaluate a user interface, the language of the user interface, the preferred communication channels to communicate user interface needs through, and users’ ability to evaluate and design icons.
resulted in 40 small enterprise owners being selected. The sampling method therefore was judgement sampling as described by Stuwig and Stead [13]. The judgement criteria used by each Induna was unknown. Although this was not as scientific as required for an academic approach, it was regarded as acceptable in view of a second, third and fourth round of training and testing.
Research conducted in Madurai Tamil Nadu in India, on designing micro-finance software for rural areas [10], reported high interaction between designers and the community. In this study researchers were working with participants with low levels of literacy as well as computer literacy. Researchers however worked from a well known common system of tracking financial transactions and developed their system from what was already familiar to the participants in their study. The basis of the interaction was therefore a common, well known, application. To try and find a similar context, small enterprise owners in a rural area was targeted, specifically focussing on their accounting practises.
For the second, third and fourth groups, application forms were distributed throughout the area. During the first round of training it was noticed that some of the businesses owned by the participants were very small with a very informal accounting system. To address this problem the size of the business was considered. Prospective participants had to indicate their level of schooling and the types of enterprises that they owned. These two factors were used to select participants for the second, third and fourth groups. Especially the size of the business was a factor as a paper trail of some sort was required. The sampling method was therefore again judgement sampling, in this case the judgement of the research team, based on the above criteria, was applied.
The case studied was the small enterprise owners of the rural community of Umbumbulu. Umbumbulu is on the south coast of KwaZulu Natal. Some parts of the area are sparsely populated, while other parts are more densely populated. The area is subdivided into eight regions, each administered by a traditional leader, the Induna, who in turn is responsible to the area leader, the ‘Nkosi. Permission and support for the research was obtained from the ‘Nkosi by the project leader.
Gender Breakdown
Because gender is one of the key divides in rural communities the gender breakdown, which was obtained through the attendance registers were as follows: For the first group 39.4% were male and 60.6% were female. For the subsequent groups combined, the breakdown was similar: males 35.8% and females 64.2%. Why more females than males participated was not investigated.
Sample Selection
Owners of small enterprises were chosen as a population, because a clear purpose for using the technology could be found, which would encourage meaningful participation. As small enterprise owners are familiar with the practices of an enterprise, it was assumed that they would have some domain knowledge. An open source accounting package, which could assist with the activities of a small enterprise, was therefore chosen as an instrument through which participants’ ability and willingness to evaluate a user interface and involvement with changing the user interface could be assessed. The project leader, of which this study is a part, identified the sample frame for the project, using questionnaires. As many of the owners of small enterprises as possible were identified, using the help of the Indunas, who are each in charge of a section of the area.
Data Gathering
For the first group of small enterprise owners, a questionnaire was used to assess their user interface experience levels. Very little was known about their computer and business skills or what accounting systems were used. It was anticipated that the computer literacy level would be low, which was confirmed by the first questionnaire. Subsequent groups were not asked to complete this questionnaire, as this group comprised 27% of all the participants and were regarded as representative in profile of all the participants. The questionnaire tried to determine participants’ level of user interface experience in communication with devices, such as Automatic Teller Machines (ATM’s), cellular telephones and computers. This was important as the level of user interface experience could impact on the user’s ability to identify problems with the user interface. Users may assume that the difficulties they encounter are due to their lack of skill, while it may be due to a problem with the interface. Involving users with a too low level of user interface experience, without improving their experiences was considered to be useless and could prove very intimidating to the participants. As this was the first research of this
The method of selection of participants in the study, for the first round, was prescribed by the ‘Nkosi. Each of the 8 Indunas from the area had to identify the participants from his area. In an attempt to be as representative as possible within these constraints, each Induna was asked to identify 5 participants. The only constraint imposed by the researchers was that participants had be able to read but no formal school qualification was needed. The literacy level of the participants, were however not tested in any way. This 53
nature taking place in the area, it was considered to be very important to gain the trust of the community.
Thirdly, group 1 participants were interviewed to determine their preferred channel of communication about user interfaces. Semi-standardised interviews offer the opportunity to be less formal and could be more conducive to participants speaking freely, especially in an unsophisticated environment [13]. Interviews were used to get feedback from participants on preferred communication methods and other aspects of the user interfaces used. The interviews were conducted in the laboratory where the training took place. This was done to use a familiar environment and keep participants relaxed. Each participant was interviewed in front of the computer so that when questions about an application were asked, it could be activated and be visible during the interview. Where needed an interpreter was used. Although all participants were asked the same questions, the questions sometimes had to be rephrased and examples given. Where examples were given, the same were given in each case.
All participants (groups 1-4) were given 4 weeks, 2 hours per week, computer literacy training. Very basic training in the use of Windows, Microsoft Word, Microsoft Excel, Outlook Express, and Internet Explorer were offered. All of these aspects are broadly regarded as essential for basic computer literacy and were chosen for this reason. It was also regarded as important to expose participants to more than one user interface, therefore a selection of programmes rather than only one programme, was decided on. Excel was specifically included, as it would be used to illustrate some of the business and accounting skills to be taught by other members of the project. After the computer literacy training, the business management and accounting sessions commenced for each of the 4 groups. During these sessions Excel was used again to teach certain business concepts and the accounting package was introduced. There were 8 sessions of 2 hours each. The fact that a large financial institution such as ABSA recently changed ATM interfaces to allow for the selection of a preferred language, suggested that language is an important factor in understanding a user interface. Google has also recently made the option of searching in five of South Africa’s eleven official languages possible [3]. The most common language found within the geographical area of Umbumbulu is Zulu, which was used for this study. The accounting package was selected from open source software and could be adapted as required. The package was translated into Zulu. A second questionnaire was used to assess group 1 participants’ reaction to a Zulu interface as well as their understanding of some aspects of the user interface. It must be emphasised that this was not a usability test of the package as opposed to the English interfaces of the other packages. It was merely used to determine user responses and attitudes towards a Zulu user interface.
Two more rounds of training and testing took place, while the fourth round is currently underway and should be complete by the end of this year, 2005, therefore 4 groups in total were trained. Computer literacy testing for groups 2, 3 and 4 were conducted after the training. The second group of participants were asked to identify some icons that proved difficult. The third group was asked to rank different icons for the “undo” action and to design an icon for undo. A questionnaire was used to determine the expectations of the fourth group who are currently being trained and tested. RESULTS
The results, in terms of the research questions as outlined, are discussed under the headings of User Interface Experience, Raising the level of user interface experience and computer literacy, Language Perceptions and Attitudes, Icon understanding, Evaluation and design and Preferred Communication Channel. Language Perceptions and Icon understanding, Evaluation and design were used to evaluate user participation, but these resulta are not discussed in this paper.
For group 1, another questionnaire, completed by the facilitators after the computer literacy and the business skills training, determined the success of improving participants’ skills, based on the facilitators’ observations. To minimize the fear of computers and the new situation, it was decided that for the first group a questionnaire for the facilitators would be better suited to determine the success or failure of the training in raising the level of computer literacy of the participants. Although it could only measure perceptions, it could at least give an indication as to whether the training was on the right track or not. This would mean that the training was suitable to be used for all the following groups. The subsequent groups did a formal test on computer to determine the actual understanding of the participants.
User Interface Experience
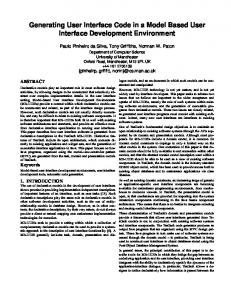
The first questionnaire was used to profile group 1 of the participants with regard to user interface experience. The percentage of participants who have used a computer, cellular telephone, an ATM before or none of these devices are shown in Figure 1. From this it was clear that almost 25% of the participants from group 1 had not used a computer, ATM or cellular telephone before. This was considered to be very high and a little unexpected. During negotiations with the Indunas, many cellular telephone kiosks were observed and cellular telephones appeared to be well supported. However, almost 25% of the participants’ user interface experience was clearly very limited. 54
Raising the level of user interface experience and computer literacy
Figure 1: Number of interfaces use
While teaching took place, three facilitators offered general support and helped with translating instructions and explanations where necessary. Although certain tasks, such as saving a file to disk, were done repeatedly in each of the sessions, it was noted at the end of the computer literacy training, that some participants still had difficulty to accomplish these tasks without help from the facilitators. This indicated that although the level of computer literacy was raised, participants were not capable of independent computer use. This may be due to lack of practice between weekly sessions.
PERCENTAGE OF RESPONDENTS
USER INTERFACE EXPERIENCE 90.0 80.0 70.0 60.0 50.0 40.0 30.0 20.0 10.0 0.0
81.8 63.6 51.5 48.5 36.4
%yes %no
18.2
Used computer
Used ATM QUESTIONS
Used cellphone
The following shows the distribution of participants from group 1 who have used one or more of the devices: Figure 2: User interface experiences
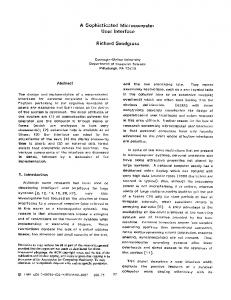
At the end of the course for group 1, each of the facilitators completed a questionnaire about their perceptions. The questionnaire tried to determine how well facilitators thought the participants understood the Excel concepts of File and Formula, and the business concepts of a Debt and an Asset. A scale of 20%, 40%, 60%, 80% and 100% of participants was provided. If a facilitator marked 20% one mark was assigned, 40% two marks etc. These marks were taken as out of 5 for each facilitator and converted to a percentage. Their observations are summarised as follows:
PERCENTAGE OF REPONDENTS
USER INTERFACE EXPERIENCE 40 35 30 25 20 15 10 5 0
INTERFACES USED
Used nothing
Used one Used two
Used three
Figure 3: Facilitators' perceptions
NUMBER OF INTERFACES USED
It was clear that these participants had a far better exposure to cellular telephones than to computers. In a study done by Hugo in 2000 it was found that “the majority of cellphone users, regardless of education level, used only a small number of the available features and functions of the cellphone” [4]. The questionnaire therefore also attempted to determine the level of user interface experience. Questions about adding a name to the phonebook, programming a reminder and calling the last missed call number were included. Of the group who had used a cellular telephone a third of them did not know how to add a name to the phonebook, program a reminder or call the last missed call number. Only 28.5% of those who had used a cellular telephone before could do all three, confirming the findings of Hugo, even though it is now 5 years later. Programming a reminder proved to be the most unknown facility.
FACILITATORS' PERCEPTIONS OF PARTICIPANTS' UNDERSTANDING 60 Percentage
50 40 30
Concepts
20 10 0 file
formula
asset
debt
Concepts Understood
Clearly, after the training the facilitators thought that the level at which participants could operate independently was below 50%. Although the levels of computer literacy and business skills were raised, it was still not at a level where participants could work without support. Because this could only give the facilitators’ perceptions, the subsequent groups were formally tested and although the computer literacy of participants had been raised, it still did not allow for fully independent computer activities. However, the training gave participants a uniform level of computer literacy, as all groups received the same training.
The answers to the ATM and computer sections of the questionnaire supported the findings for the cellular telephone. This questionnaire highlighted the fact that the level of user interface skills of the group was very limited. This group could therefore be used to determine their contributions to the design and evaluation of a user interface.
Language Perceptions and Attitudes
The second questionnaire that group 1 participants had
55
to complete, dealt with their perceptions and attitudes towards using a Zulu interface, as well as their understanding of the interface as a result of the Zulu interface.
printing the document, undoing the last action and cutting were tested. At least two of the icons, an incorrect action and the icon to undo the last action were not well recognised, although these icons are similar to the icons used widely in Micro Soft applications.
The responses in the questionnaire towards the use of a Zulu interface (Fig. 4) in the accounting package were very interesting and followed up during the interviews.
Figure 5: Undo icon
Figure 4: Language perceptions
NUMBER OF YES RESPONSES
RESPONSES TO ZULU INTERFACE 90.0 80.0 70.0 60.0 50.0 40.0 30.0 20.0 10.0 0.0
80.8
80.8
The third group of participants were given 5 icons that could represent the undo action and asked to rank these icons. The icons were:
69.2 61.5
PROMOTE UNDERSTANDING
PROMOTE REMEMBERING
KNOWLEDGE TRANSFER
CHANGE TO ENGLISH
QUESTIONS
1
More than 80% of the participants agreed that having a Zulu interface promoted their understanding of the interface and also helped them to remember better. Almost 70% thought that what they had learned could be transferred to other user interfaces, yet more than 60% indicated that they would prefer it if the interface was changed to English.
2
3
4 5 The icons were ranked as follows: Figure 6: Icon Ranking ICON RANKING PERCENTAGE SCORED
The interviews also attempted to determine preference for an English user interface or a Zulu user interface. Windows, Microsoft Word, Microsoft Excel and Outlook Express were English while the accounting package was Zulu. Participants were asked what they would like to see changed in Excel. They were prompted to consider the language, some of the icons and the colours. Only two participants chose to change the language. The two participants who wanted the language changed had to make use of an interpreter during the interview. It is therefore to be expected that they would prefer a user interface in their own language.
90.0 80.0 70.0 60.0 50.0 40.0 30.0 20.0 10.0 0.0
Score (%)
1
2
3
4
5
ICON NUMBER
From this it was clear that icon number 2, was ranked the best as an undo icon and icon 4 the second best. Both icons use arrows and the concept is similar to the Micro Soft undo icon. What is however more important is that participants had clear ideas about which icons did represent the action and could evaluate options presented to them.
Participants were also asked: What made the accounting package (which was in Zulu) difficult/easy to use? Here participants were divided as to whether the Zulu interface promoted or inhibited understanding. The criticism was that the Zulu terms were often much longer than the English and this made the menu items too long. Another was that having learned the terms that are general to most packages, like the File options, in English, they now had to relearn the Zulu version. Others indicated that the Zulu contributed towards a better understanding of the basic concepts, which could be transferred, according to the participants, to other English user interfaces.
When group 3 were asked to draw a picture to represent the undo action, 40,7% of the participants drew some kind of an arrow, 29,6% drew alternative pictures that could represent the undo action, while 29,6% drew pictures not related to the undo action. This means that once participants had seen examples of icons representing the undo action, only 29,6% presented an original representation of the action. When the members of Group 1 were asked, during the interviews, about the icons in Excel, one of the participants explained that if you only know one option and have not been exposed to other options it is
Icon understanding, ranking and design
Group 2 participants’ understanding of some icons was tested. The icons for a new document, incorrect action, 56
very difficult to evaluate or suggest improvements to the icons. It appeared that when the function of the icon was explained, it was accepted, irrespective of the picture representing the icon. This clearly indicates that a higher level of user interface experience is required for users to be able to participate in the development of a user interface. They are however able to indicate clear preferences when presented with alternatives.
independency a longer intervention is possibly needed. The training therefore only provided a uniform level of computer literacy for all the groups The third questionnaire, completed by Group 1 participants, and supported by the interviews, tested the participants’ reactions to a Zulu interface. Participants were prepared to express clear views towards the language aspects and could clearly motivate their viewpoints. The results indicate that, as with the current ABSA ATM user interface, users should be able to choose their language of preference. Designers should design user interfaces for a multilanguage user population.
Communication channels
Participants from Group 1 were asked to indicate a preferred method of communication with the research team. They were asked to indicate a best, 2nd best and 3rd option of communication. All those methods marked as first choice scored 3, those marked 2nd scored 2 and those marked 3rd scored 1 point each. Following are the results:
The icon understanding, ranking (Group 2) and design exercise (Group 3) determined the type of contribution that users with a low level of user interface experience could make. Designers should focus on usability testing at different stages of the design, rather than involving users in the design of the user interface.
Figure 7: Preferred channel of communication PREFERRED COMMUNICATION METHOD
The last aspect, preferred communication channels, was included because rural communities were the target. Some rural communities in remote areas might be difficult to reach and if email or some method of communication other than face-to-face could be found, it could make usability testing easier. The results however show that users prefer face-to-face communication. Participants had to be prompted to evaluate and criticise the interface. With limited user interface experience users are unsure of what could be changed, making it more difficult to suggest changes. In a face-to-face evaluation of the user interface the designers could suggest areas of changes and thereby, with the help of the users, identify problematic areas.
35 30
SCORE
25 20
COMMUNICATION METHOD
15 10 5 0 e-mail
telephone
face-toface
letter
3rd person
COMMUNICATION METHOD
Face-to-face and telephonic communication preferred by far. It must also be noted communication through a 3rd person was considered by those candidates whose English limited and who needed an interpreter.
was that only was
The preferred method of communication is possibly due to limited user interface experience with a variety of devices.
CONCLUSIONS
This study, although exploratory in nature, shows that the level of involvement of the users should focus on the evaluation of options presented to the users, rather than involving them with the actual design of the interface. To be able to determine whether the needs of rural communities, when contributing to the design or evaluating a user interface, are different from urban communities further research that focus on comparing the two has to be done. Possibly the literacy levels as well as the computer literacy levels of users in rural areas are lower that those of users in urban areas, presenting their own challenges. However the focus of this study was on the interaction between the users and the design team and what would encourage users to interact and make significant contributions. Other than the distance and preferred communication method, which makes usability testing more difficult, there was no indication that inexperienced computer users in rural areas require different approaches than inexperienced computer users in urban areas when designers plan to involve the users. The availability of support in rural areas could however prove to be another obstacle.
Face-to-face and telephone communication are the two methods most commonly used in the area, so it points to a much longer intervention before behaviour changes could be expected. INTERPRETATION OF RESULTS
The first questionnaire established that the user interface experience levels of Group 1 were low therefore the group was suitable to use for the study. Once word of the nature of the training spread, subsequent groups were also groups who required computer literacy training, as established during the training, so it could be assumed that their experience levels were similar. The second questionnaire, completed by the facilitators, indicated that the level of computer literacy for Group 1 had been raised although not to the level of independent work. Subsequent groups were formally tested, and confirmed this. To raise the level of computer literacy to the standard of 57
ACKNOWLEDGMENTS
7.
Support and funding from the National Research Foundation of South Africa was crucial to the research. Fellow research team members were a source of energy and support. The Department of Information Technology at Durban Institute of Technology supported the research and made it possible to carry out. Lastly the participation and support from the people of Umbumbulu was what made it all worth while. It has been an amazing experience and hopefully will continue to be an inspiring experience.
Makhaye, C. 2005. Rural areas to be put ‘on line’. Sunday Tribune, 8 may.
8.
Malina, A, and Ball, I. 2005. ICTs and community and suggestions for further research in Scotland. The Journal of Community Informatics, 1 (3), [online]. Available: http://cijournal.net. [Accessed 30 September 2005]
9.
Mouton, J. 2001. How to succeed in your Master’s & Doctoral Studies. Western Cape: Van Schaik Publishers
10.
Parikh, T., Ghosh, K., and Chavan, A. 2003. Design Studies for a Financial Management System for Micro-Credit Groups in Rural India [Online]. Available: http://www.cs.washington.edu/homes/ tapan/papers/p0314-parikh.pdf [Accessed 28 November 2005]
11.
Smith, P. 2002. Debunking the myths of UI design [online]. Available: http://www106.ibm.com/ developerworks/library/usmyth.html, [Accessed 9 March 2005].
Google Internet in Zulu. 2005. Northglen News, 25 February, p.8.
12.
Hugo, J. 2000. Human Computer Interaction: A New Challenge for the South African IT Industry [online]. Available: http://www.chisa.org.za/articles/HCIchallenge.htm, [Accessed 3 June 2003].
Stoecker, R. 2005. Is Community Informatics good for communities? The Journal of Community Informatics, 1 (3), 13-26 [online]. Available: http://ci-journal.net. [Accessed 30 September 2005]
13.
Struwig, F.W. and Stead, G.B. 2001. Planning, designing and reporting research. Cape Town: Pearson Education South Africa.
14.
UsabilityNet. 2002. Promoting Usability and User Centred Design in European Industry [online]. Available: http://www.usabilitynet.org/ 3 management/b_design.htm. [Accessed October 2005]
REFERENCES
1.
Achenbach, H. 2005. UI First – Placing Users at the Center of the Design Process. [online] Available: http://www.sapdesignguild.org/editions/ edition8/ui_first.asp, [Accessed 10 August 2005].
2.
CIRN2005. 2005. Community Informatics Research Network conference [online]. Available: www.CIRN2005.org, [Accessed 10 October 2005] .
3.
4.
5.
6.
Hisaab: Innovative Numeric Interfaces for Rural Microfinance [online]. 2002. Available: http://www.medialabasia.org/mlaShow.php?file R= 20020830132112&dir=2002/08/30&format=ht m&typeId=6&subTypeId=5 [Accessed 28 November 2005] Magyar,J, McSweeney,K and Hafey,J.2004. User Interface Design Proposal in APO [Online]. Available: http://www.sapdesignguild.org/community/read ers/reader_hafey_apo.asp
58