Can Functional Size Measures Improve Effort Estimation in SCRUM? Valentina Lenarduzzi
Davide Taibi
Dipartimento di Scienze Teoriche e Applicate Università degli Studi dell'Insubria Varese, Italy
[email protected]
Software Engineering Research Group University of Kaiserslautern Kaiserslautern, Germany
[email protected]
Abstract—In SCRUM projects, effort estimations are carried out at the beginning of each sprint, usually based on story points. The usage of functional size measures, specifically selected for the type of application and development conditions, is expected to allow for more accurate effort estimates. The goal of the work presented here is to verify this hypothesis, based on experimental data. The association of story measures to actual effort and the accuracy of the resulting effort model was evaluated. The study shows that developers’ estimation is more accurate than those based on functional measurement. In conclusion, our study shows that, easy to collect functional measures do not help developers in improving the accuracy of the effort estimation in Moonlight SCRUM.
During the Sprint Planning Meeting, the team estimates the effort for the user stories in the product backlog based on their experience on implementing similar user stories. Then, they predict the amount of user stories they believe can develop in the upcoming sprint. The consequence is that teams need to adjust their project plan, during each sprint meeting. SCRUM does not prescribe a unit of measure to estimate the effort. Common estimating methods include numeric sizing, t-shirt sizes, and story points. In this work, we investigate if it is possible to use functional measures to help developers increase the accuracy of the effort estimation in SCRUM. For this reason, we conducted an empirical study on a SCRUM project developed with Moonlighting SCRUM [7], a version of SCRUM slightly adapted for part-time developers working in non-overlapping hours. The remainder of this paper is organized as follows: Section 2 describes related work. Section 3 presents the context where we applied this study. Section 4 first introduces the research questions and derive goals and hypotheses, then elaborates on the measurement instruments and study design. Section 5 presents the results of the study. Section 6 describes the threats to validity and finally Section 7 draws conclusions and gives an outlook on future work
Keywords: Software Effort Estimation, Agile Development, SCRUM effort estimation, Functional measurement.
I.
INTRODUCTION
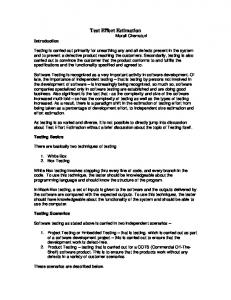
Agile methodologies call for different and possibly more complex effort estimation techniques than other methodologies [10]. This is due to the iterative nature of projects that use agile methods and the lack of detailed requirements and specifications at the beginning of the project. Several effort estimation models have been defined based on user experience or on previous project results but, due to the differences between different development methodologies, the applicability of those estimation models appears to be limited. In this work, we focus on SCRUM [13] as reference process (see Figure 1).
Figure 1: SCRUM Development Process
Requirements in SCRUM are collected in the “product backlog” and described as “user stories”.
II.
RELATED WORKS
Several empirical studies report that developers usually underestimate their effort in agile processes, compared to other methodologies [10]. Other studies analyzed the accuracy of the effort planned and spent for implementing user stories, reporting overoptimistic and sometimes unrealistic initial estimates [4][11]. Moreover, a case study run by Chao also reported that the effort estimation does not improve over time [4]. One of the first attempts to help developers improve the estimation in SCRUM has been published by Jamieson in 2005 [1]. Jamieson identified a set of estimation problems in SCRUM such as the need of budget reallocation due to the requirement volatility resulting in heavy and costly change management. Lavazza [8] identified a set of potential problems such as the different nature of the user stories, the size of a sprint and velocity. Moreover, he also highlighted the importance of choosing the correct granularity level for measures and collect historical data. Buglione et al. [6] proposed to apply functional size measurement methods in a late stage of the process, when requirements become available and are more stable.
Ziauddin et al. [14] propose an early estimation model for SCRUM based on historical data. They calculate the effort based on the number of user stories, the team velocity, the sprint duration adjusting the results based on a set of influencing factors such as the team composition, environmental factors and team dynamics. The model has been calibrated on 21 SCRUM projects and provides a good accuracy. However, the model is only suitable for projects where the requirements are clear and fixed at the beginning of the project. Fuqua [16] ran a controlled experiment with the goal of understanding if functional measurement in XP-Projects can help to produce a more accurate schedule, and if functional measurement can help to predict how long it will take to implement a story. Results show that Function Points (FP) are unable to estimate the required effort. Moreover, FP have a too fine granularity and require sizeable measurement effort due to the complexity of the FP measurement process. Finally, a recent work published by Popli and Chauhan [12], proposes to use a new unit of measure: the “sprint points”. Sprint Points are calculated combining information related to the project type, requirement quality, hardware and software requirements, requirements complexity, data transactions and number of development sites. III.
CONTEXT
In this section, we describe the development process we analyzed in our study and the application that was developed. This work is based on the development of Process Configuration Framework (PCF), an online tool to classify software technologies and identify tool chains in specific domains [15]. PCF is a relatively small application, composed of 12,500 effective lines of code, calculated without considering comment lines, empty lines, and lines containing only brackets. The development started in February 2013, based on an existing prototype, and the first version of the tool was released at the end of May 2013. PCF is developed in C#/Asp.net with a simple 3-tier architecture that allows the development of independent features among developers. This allows developers to work independently on the data layer, on the business layer and on the presentation layer. We deal with a special case of SCRUM process. In fact, special development conditions called for some changes of the SCRUM process. The development was carried out by four part-time developers (Master‟s students) with 2 to 3 years‟ experience in software development. Developers work in nonoverlapping hours and, to manage a good level of communication, an online forum is used for the daily meeting, as prescribed by Moonlight SCRUM [7]. Moreover, sprint retrospectives, planning, and retrospective discussions are led by means of an online integrated tool (http://www.rallydev.com), which allows us to record sprint reports, manage product backlog, and draw burn-down charts. The development process was organized as follows. a) The duration of each sprint is three weeks
b) Daily meeting are replaced by reporting on an online forum twice a week c) A user story can be assigned only to a single developer d) Every developer works in isolation. The work is coordinated by the SCRUM master via the weekly meetings. IV.
THE CASE STUDY
We formulate the goal for our study following the Goal Question Metric approach [5] as: analyze the development process for the purpose of evaluating the effectiveness of estimation measures from the viewpoint of the developers in the context of a moonlight SCRUM development process A. Metrics Since measures are collected to estimate effort, a characteristic of these measures is that they can be measured before development. So, in principle we expect that it is possible to build a model that, by linking the development effort to the measures, provides an estimation tool that can be used in conjunction with (and possibly even in place of) the usual agile estimation techniques. Another characteristic of the measures is that they must be fast and easy to collect, since they have to fit in an agile process, where little time and effort can be dedicated to measurement activities. Moreover, the proposed measures are easy to collect, so that any developer can perform the measurement without problems. To measure user stories, we considered the usage of traditional functional size measures, possibly adapted to the agile context. However, plain function points such as IFPUG (International Function Point User Group)[18] or COSMIC function point [19] measures could not be used. In fact, we noticed several problems, including the following: The most popular functional size measures use processes (Elementary process or Functional process) as the element to be measured. This is reasonable when the smallest development step (for instance, a sprint in a regular SCRUM process, or an iteration in a RUP process) addresses several processes. However, in our case the development of a single process could span multiple sprints. Accordingly, knowing the size of a process could hardly help estimate the work to be done in a single sprint. Several sprints involved working mainly on the Graphical User Interface (GUI) of the application. So, functional size measures would not help estimate the effort required. Implementation-level details (like the number of interactions with the server or the number of database tables involved in the operations) appeared to affect the required effort.
B. Study Procedure The measures identified are collected during each sprint meeting by the SCRUM master, in an Excel spreadsheet. After each sprint we collect the actual effort spent for each story, in order to validate results. Measures must be collected in a maximum of 5 minutes per user story, at the end of the usual SCRUM planning
game, so as to not influence the normal execution of the required SCRUM practices. Developers were informed, through an informed consent that the information is collected for research purposes and will never be used to evaluate them. V.
RESULTS
We ran the study analyzing the data for 4 months. We ran 6 sprints of three weeks each with 4 developers working part-time for the entire period. Table I reports descriptive statistics on the user stories per story type. As shown in this table, the vast majority of the user stories are related to the development of new features (65%) while only 35% on maintenance. Considering GUI impact (Table II), we can see that most of the user stories are related to the development of graphical features with high or medium complexity. Functional measures have been collected only for 55 user stories (40.4%) since the remaining user stories do not contain enough information for functional size measurement (e.g., GUI features do not deal with data transactions). As expected, the number of GUI components added or modified increase paired with the GUI impact while unexpectedly, the higher the GUI impact, the lower is the number of hours required for implementing a user story. TABLE I.
ACTUAL EFFORT PER STORY TYPE All
New Feature
Maintenance
136
99(73%)
37 (27%)
Avg
3.16
3.68
1.96
Median
2.00
2.00
2.00
Std. Dev
2.91
3.28
1.01
# User stories Effort per user story (hours)
Based on the aforementioned constraints, we defined the following measures to be collected during the planning game: Actual effort: number of hours spent per user story. This information is tracked by developers and collected at the beginning of each spring. Story Type: we collect this information so as to classify the user stories based on the type of development. o New feature: user stories that involve the creation of a new feature. o Maintenance: bug fixing or requirement changes for an existing feature. Functional measures. Since standard Function Points such as IFPUG or FISMA require a lot of effort to be collected, and most of required information is not available in our context, we opt for the Simplified Function Points (SiFP) [17] SiFP are calculated as SiFP= 7 * #DF + 4.6 * #TF where #DF is the number of data function (also known as logic data file) and #TF is the number of elementary processes (also known as transactions). We collect SiFP instead of IFPUG Function Points, since SiFP provides an “agile” and simplified measure, compatible with IFPUG Function Points [17]. Moreover, before running this study, we asked our developers what information they take into account when estimating a user story. All developers answered that they consider four pieces of information, based on the complexity of implementing the GUI and the number of functionalities to be implemented. They usually consider each GUI component as a single functionality that requires the sending or receiving of the information to the database. The complexity of the communication is related to the number of tables involved in the SQL query. For these reasons, we also consider the following measures: GUI Impact: null, low, medium, high: complexity of the GUI implementation identified by the developers. # GUI components added: number of data fields added (eg. Html input fields) # GUI components modified: number of data fields modified # database tables: number of database table used in the sql query. We can consider this last measure as a functional size measurement with a very low level of granularity, even though not directly comparable to SiFP or IFPUG Function Points.
TABLE II. EFFORT AND GUI COMPONENT ADDED OR MODIFIED (GUI_COMPONENTS) PER USER STORY PER GUI IMPACT Story Type
GUI Impact
Null
Low
Medium
High
All
New Feature
Maintenance
#User Stories
11
6
5
AVG (hours)
3.12
1.91
1.6
AVG (GUI_Comp)
5.27
3.67
0.2
#User Stories
30
26
4
AVG (hours)
3.68
2.46
1
AVG (GUI_Comp)
1.33
1.44
1
#User Stories
40
30
10
AVG (hours)
1.96
3.50
1.70
AVG (GUI_Comp)
5.02
6.13
0
#User Stories
55
37
18
AVG (hours)
1.30
4.90
2.20
AVG (GUI_Comp)
8.28
7.89
9.05
Descriptive statistics for the SiFP collected for the user stories (see Table III) show that user stories with a null GUI Impact (user stories that do not deal with the user interface) have the higher number of SiFP, followed by the stories with a high GUI impact. TABLE III.
SIFP PER USER STORY PER GUI IMPACT
GUI Impact
Story Type All
All
Null
Low
Medium
High
New Feature
Maint.
#User Stories
55
47
8
AVG (SiFP)
6.1
5.76
8.58
#User Stories
7
2
5
AVG (SiFP)
9.12
6.4
12.51
#User Stories
19
18
1
AVG (SiFP)
4.66
4.8
2.2
#User Stories
22
20
2
AVG (SiFP)
5.69
6.06
1.96
#User Stories
7
7
0
AVG (SiFP)
8.79
8.79
/
After the analysis of descriptive statistics, we investigated the correlations from actual effort and: SiFP GUI components (Added + Modified) GUI components added, modified and database tables TABLE IV.
CORRELATIONS AMONG EFFORT AND SIMPLIFIED FUNCTION POINTS GUI Impact
All Projects
Story Type
Here, we report the results for all user stories and for each GUI impact and story type, so as to understand if this information can improve the estimation accuracy. The analysis of correlations among SiFP and effort reported in all user stories does not provide any statistical significant result (Table IV – column “All Projects” and Figure 2), showing a very low goodness of fit (MMRE=81.4%, MdMRE=135.3%). The analysis was then carried out by clustering stories per story types and GUI impact. Results obtained after the clustering show the same behavior, except for stories implementing new features with a low GUI impact (Table IV – Column “GUI Impact Low – Features”). In this case, results are statistically relevant but with a very low goodness of fits. (MMRE=147%, MdMRE=111%). The correlation between the actual effort and the number of GUI components added or modified shows a similar pattern to the previous one in Table V and Figure 3. Only the analysis of stories with a medium GUI impact provides statistically significant results but, together with the analysis of the other types of stories, there is a very low correlation with a very low goodness of fit. (MMRE=71.3%, MdMRE=140.1%). Results are also confirmed by grouping user stories by story type and impact. Finally, the multivariate correlations among GUI components added, modified and database tables provides statistically significant results paired with a low correlation. Moreover, also the multivariate correlation does not increase the goodness of fit (Table VI and Figure 4).
Null
Low
Medium
High
All
Feat.
Maint.
All
Feat.
Maint.
All
Feat.
Maint.
All
Feat.
Maint.
#User Stories
55
7
2
5
19
18
1
22
20
2
7
7
0
pearson
0.065
0.391
/
0.383
0.660
0.669
0
-0.068
-0.073
/
-0.370
-0.370
0
p-value
0.320
0.193
/
0.262
0.001
0.001
0
0.382
0.380
/
0.207
0.207
0
0.004
0.153
/
0.147
0.436
0.448
0
0.005
0.005
/
0.137
0.137
0
2
R
TABLE V.
GUI Impact
All Projects
Story Type
CORRELATIONS AMONG EFFORT AND GUI COMPONENTS ADDED OR MODIFIED
Null
Low
Medium
High
All
Feat.
Maint.
All
Feat.
Maint.
All
Feat.
Maint.
All
Feat.
Maint.
11 0.138
6
5
30
25
5
40
30
10
55
36
19
0.146
-0.211
0.191
0.190
0
0.436
0.396
0.588
-0.196
-0.217
0.040
#User Stories
136
pearson
0.071
p-value
0.207
0.343
0.391
0.366
0.156
0.181
0
0.002
0.015
0.037
0.076
0.102
0.437
R2
0.005
0.019
0.021
0.045
0.037
0.036
0
0.190
0.156
0.346
0.038
0.047
0.002
Figure 2: Actual Effort vs Estimated Effort with SiFP
Figure 4: Actual Effort vs Estimated Effort with GUI components added, modified and database tables involved
p-value
Pearson
TABLE VI. MULTIVARIATE CORRELATION AMONG ACTUAL EFFORT AND GUI COMPOMENTS ADDED, MODIFIED AND DATABASE TABLES. GUI Comp Added
GUI Comp Modified
Database Tables
#Projects
138
138
138
Actual Effort
0.212
-0.033
0.130
GUI Comp Added GUI Comp Modified Database Tables
1.000
0.272
0.391
0.272
1.000
0.377
0.391
0.377
1.000
Actual Effort
0.006
0.351
0.0064
0.001
0.000
GUI Comp Added GUI Comp Modified Database Tables 2
R
0.001 0.000
0.000 0.000 0.061
Figure 3: Actual Effort vs Estimated Effort with GUI components added + modified
Figure 5: Actual Effort vs Developers‟ estimated effort
In order to understand if the results are due to errors in the effort estimation made by our developers, we finally analyze the accuracy of the effort estimation carried out by our developers. We compared the actual effort with the effort estimated before implementing the user story (see Figure 5). Results shows a very accurate estimation, with a very low average error (MMRE=13.5% MdMRE=9.35%). The low error is probably due to the nature of the user stories in Moonlight Scrum, usually smaller than common user stories in SCRUM. However, as expected, the accuracy decreases when the effort planned per user story is higher. This confirms that in our project context, expert estimation is still much better than data driven estimation, based on functional measurement.
VI.
DISCUSSION
The immediate result of this study is the low prediction power of functional size measures in SCRUM. Unexpectedly, the prediction accuracy of SiFP compared to the accuracy of experience-based predictions is dramatically low. Since SiFP can easily replace the more common IFPUG function points with a very low error [17], it appears that functional size measures are not suitable for predicting the effort in Moonlight Scrum. Moreover, no correlations are found between the effort and the information commonly used by our developers to estimate user stories (GUI components and database tables). Again, the lack of correlation is probably due to the low complexity and the small effort needed to implement a story. Results are based only on the analysis of one development process, based on a relatively small codebase (12500 effectives lines of code). Concerning internal validity of the study, developers are master students, with a limited experience (2-3 years) in software development with at least one year of experience in SCRUM. As for external validity, this study focuses on Moonlight SCRUM, a slightly modified version of SCRUM. We expect some variations in applying the same approach to a full time development team, working on a plain SCRUM process. Regarding the reliability of this study, results are not dependent by subjects or by the application developed. We expect similar results for the replication of this study with a Moonlight SCRUM process.
Future work includes the replication of this study in an industrial context with a plain SCRUM process. REFERENCES [1]
[2]
[3]
[4]
[5]
[6]
[7]
[8]
[9]
[10]
VII. CONCLUSIONS In this work, we analyzed the development of a Moonlight SCRUM process so as to understand if it is possible to introduce agile metrics to the SCRUM planning game. With this study, we contribute to the body of knowledge by providing an empirical study on the identification of measures for Agile, and in particular SCRUM, effort estimation. Therefore, we first gave an overview of the few existing empirical studies in the field agile and SCRUM effort estimation, then we introduced the context of this study and the case study we ran. Results of our study show that SiFP do not help to improve the estimation accuracy in Moonlight SCRUM. Moreover, the accuracy does not increase considering other measures usually considered by our developers when they evaluate the effort required to develop a user story. Since SiFP can easily replace the more common IFPUG function points with a very low error [17], we can conclude that, based on our case study, it appears that functional size measures are not suitable for predicting the effort in Moonlight Scrum.
[11]
[12]
[13] [14]
[15]
[16]
[17]
[18] [19]
D. Jamieson, K. Vinsen, and G. Callender, “Agile Procurement to Support Agile Software Development”, Proceedings of the 35th IEEE International Conference on Industrial Informatics, pp. 419-424, 2005. T. Sulaiman, B. Barton, and T. Blackburn, “AgileEVM Earned Value Management in SCRUM Projects”, Proceedings of AGILE Conference , pp. 10-16, 2006. N. C. Haugen, “An empirical study of using planning poker for user story estimation”, Proceedings of AGILE Conference , pp. 9-34, 2006. L. Cao. “Estimating Agile Software Project Effort: An Empirical Study” Americas Conference on Information Systems (AMCIS), paper 401, 2008 V. R. Basili, G. Caldiera, and H. D. Rombach, “The goal question metric approach.” Encyclopedia of software engineering, pp. 528–532, 1994. L. Buglione and A. Abran. “Improving Estimations in Agile Projects: Issues and avenues” Proceedings of the 4th Software Measurement European Forum (SMEF) Rome (Italy), 2007 D. Taibi, P. Diebold, and C. Lampasona. “Moonlighting SCRUM: An Agile Method for Distributed Teams with PartTime Developers Working during Non-Overlapping Hours” Proceedings of the Eighth International Conference on Software Engineering (ICSEA), pp. 318-323, 2013 L. Lavazza. “Managing Performance Impact Factors for Effort Estimation in Agile Projects”. PIFPRO'12 workshop. Collocated with IWSM/Mensura, 2012 R. Meli, “Simple Function Point: a new Functional Size Measurement Method fully compliant with IFPUG 4.x”, Software Measurement European Forum, 2011 B. Ramesh, L. Cao, and R.Baskerville. "Agile Requirements Engineering Practices and Challenges: An Empirical Study," Information Systems Journal. Vol. 20, Issue 5, pp 449–480, 2007. V. Mahnic. „A Case Study on Agile Estimating and Planning using SCRUM” Americas Conference on Information Systems (AMCIS), pp 123-128, 2008 R. Popli and N. Chauhan. ”A Sprint-Point Based Estimation Technique In SCRUM” Information Systems and Computer Networks, pp.98-103, 2013 K. Schwaber. “Agile Project Management with SCRUM” Microsoft Press, ISBN 9780735619937, 2004 K. Z. Ziauddin, K. T. Shahid, and Z. Shahrukh. “An Effort Estimation Model for Agile Software Development” Advances in Computer Science and its Applications Journal. Vol. 2, No 1, pp 314-324, 2012 P. Diebold, L. Dieudonné, and D. Taibi, “Process Configuration Framework Tool”, Euromicro Conference on Software Engineering and Advanced Applications , 2014. A. M. Fuqua. “Using function points in XP – considerations” International conference on Extreme programming and agile processes in software engineering, pp. 340-342, 2003 L. Lavazza and R. Meli, “An Evaluation of Simple Function Point as a Replacement of IFPUG Function Point”, IWSM Mensura 2014, Rotterdam, October 2014. International Function Point Users Group. “Function Point Counting Practices Manual”, 2004 COSMIC - Common Software Measurement International Consortium. “The COSMIC Functional Size Measurement Method - version 3.0 Measurement Manual” September 2007