WATER RESOURCES RESEARCH, VOL. 35, NO. 2, PAGES 589 –593, FEBRUARY 1999
Can we distinguish Richards’ and Boussinesq’s equations for hillslopes?: The Coweeta experiment revisited T. S. Steenhuis,1 J.-Y. Parlange,1 W. E. Sanford,2 A. Heilig,1 F. Stagnitti,3 and M. F. Walter1 Abstract. Previous analyses of subsurface flow down sloping, shallow soil hillsides are further simplified. Surprisingly, whether the starting point is Richards’ or Boussinesq’s equation, the derived analytical expressions for cumulative outflow are identical, and they agree very well with experimental results from the Coweeta Hydrological Laboratory [Hewlett and Hibbert, 1963]. We show that Boussinesq’s model can be improved from a theoretical point of view at a very small cost. We also solved Boussinesq’s equation numerically. However, this improved model did not fit the experimental data any better, while the numerical solution only showed a marginal agreement with the observed data.
1.
Introduction
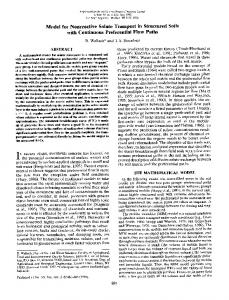
In 1963, Hewlett and Hibbert [1963] published the now highly recognized and much studied drainage data from a welldefined hillslope at the Coweeta Hydrological Laboratory. This experiment consisted of measuring the outflow from a soil-filled, concrete-lined trough (0.914 3 0.914 3 13.72 m), which had the outlet located near the surface (Figure 1). The plot was irrigated at a rate of 2.1 mm/hr until a steady state discharge was achieved. At this time the water addition was stopped and the plot was covered with plastic to prevent evaporation. The outflow rate was measured as a function of time over the next 145 days as the soil drained. A total of 1.26 m3 was collected. The duration of the experiment and quality of the data is such that their study has been used to evaluate the performance of subsurface flow models ever since. The most complete review on model testing with the Coweeta experimental data, by Sloan and Moore [1984], considered five mathematical models with increasing complexity. The most complex model developed by Nieber and Walter [1981] is based on a two-dimensional, essentially exact numerical solution of Richards’ equation, taking into account both saturated and unsaturated flow. However, this solution predicts a slower drainage than was observed. This observation was attributed by Sloan and Moore [1984] to the inability of Richards’ equation to account for macropore flow. The other four models discussed by Sloan and Moore [1984] divide the flow into saturated and unsaturated zones. The former flow is assumed to be parallel to the slope and the latter is assumed to be vertical. One of the models, in particular [Beven, 1981, 1982], uses the kinematic wave equation. All of these models require the use of numerical techniques. Later, Beven’s theory was “extended further to include the downslope flow in the unsaturated region which can be significant” [Hurley 1 Department of Agricultural and Biological Engineering, Cornell University, Ithaca, New York. 2 Department of Earth Resources, Colorado State University, Fort Collins. 3 Department of Mathematics and Computing, Deakin University, Warrnambool, Victoria, Australia.
and Pantelis, 1985, p. 821]. Stagnitti et al. [1986] simplified the kinematic wave approximation further to obtain a fully analytical but still somewhat complex solution using the method of characteristics. Steenhuis et al. [1988] also used the kinematic wave approximation but with a piece-wise linear conductivity function. Another analytical solution was developed by Zecharias and Brutsaert [1988]. Even though the two-dimensional Richards’ equation provides the most sophisticated description of the flow, the simplified models actually may fit the data better if “effective hillslope hydraulic conductivity” is used [Sloan and Moore, 1984, p. 1821]. That is, the increased effect of gravity due to the macropores can be taken into account “effectively.” It is clear from these studies that with a minimum of curve fitting, any rational model can be made to describe the Coweeta experiment adequately. In this note we will reexamine the problem to try to physically understand why the use of Richards’ or Boussinesq’s equation basically yields the same result and why great simplifications do not affect the outcome significantly. To do this, we shall start with even simpler models than those used by Stagnitti et al. [1986], Steenhuis et al. [1988], and Sanford et al. [1993] and see how omitted terms would affect the results.
2.
q5
S
K sin b K
C x
D
(1)
where x is the coordinate parallel to the slope with the origin at the top of the slope, K is the conductivity, b is the slope angle, and C is the matric potential. To be consistent, we replaced the top end of the flume by a horizontal boundary (Figure 1). Using (1) and the conservation of mass, the onedimensional Richards’ equation for a shallow sloping soil with thickness, h 0 , may be written as u 5 t x
Copyright 1999 by the American Geophysical Union. Paper number 1998WR900067. 0043-1397/99/1998WR900067$09.00
Richards’ Equation
The flux, q, along a steep and shallow slope can be expressed using the assumption of Stagnitti et al. [1986] that all properties are constant in the horizontal direction:
S
2 K sin b 1 K
C x
D
1
I h0
(2)
where I is the infiltration rate perpendicular to the slope, u ( x, t) is the moisture content, and t is the time. Stagnitti et al. 589
590
STEENHUIS ET AL.: TECHNICAL NOTE
For the Coweeta experiment the equivalent length, L e , for the soil above the outflow level is 12.58 m (Figure 1), the equivalent application rate is I 5 2.3 3 10 23 m/hr, h 0 5 0.914 m, and sin b 5 0.371. Then, according to the above argument, K L 5 0.0023 3 12.58/(0.914 3 0.37) 5 0.0855 m/hrs which is within the range of expected values for a sandy loam. If M(t) is the cumulative drainage for a trough with width, w, then the total drainage, M ` , at the time when the outflow stops and u 5 u0 is M ` 5 wh 0
E
Le
~ u ~t 5 0, x! 2 u 0! dx
(9)
0
Assuming that at the top of the hillslope the moisture content is equal to u0, M ` can be approximated as Figure 1. Schematic of the Coweeta through showing initial and boundary conditions for Richards’ and Boussinesq’s formulations. [1986] dropped the capillary term, C/ x, in (1) and (2) and replaced its effect by the assumption that drainage stops when u reached some value u0. They, however, kept K dependent on u. In this note we also drop the capillary term in (1) and (2) and assume further that dK/d u is constant between u 5 u s (saturation) and u 5 u0. Thus the true conductivity is replaced by two straight line segments given by K~ u ! 5 0
u , u0
(3a)
M ` 5 21 wh 0L e~ u L 2 u 0!
For the Coweeta experiment w 5 0.914 m, M ` 5 1.26 m3, and if we take u L 5 u 5 0.49, then, according to (10), we find that u0 5 0.25 which is close to the value of u0 5 0.28 found by Stagnitti et al. [1986]. It is this agreement and the model’s simplicity which makes this elementary solution valuable. That is, by construction, (7) insures that M(t) is accurate for early times. At the same time, using (10) makes sure that M ` is accurate for long times. The intermediary times require the solution of (2) with a rainfall I for t , 0 and I 5 0 for the remaining time. By ignoring the capillarity term and applying the chain rule on K/ x, we find, using the method of characteristics for t . 0; u . u 0 [Steenhuis et al., 1988]:
and
u 5 u0 1
u 2 u0 K~ u ! 5 K s us 2 u0
u0 # u # us
(3b)
For convenience, define: ku 5
dK du
(4)
Neglecting the capillary term, using the chain rule for K/ x (i.e., K/ x 5 dK/d u z u / x), (2) becomes u u I 5 2k u sin b 1 t x h0
(5)
The steady state solution with I constant is obtained from (5) by integration as k u~ u 2 u 0! 5
Ix h 0 sin b
(6)
IL h 0 sin b
dM 5 Iw~L e 2 tK u sin b ! dt
K L 5 k u~ u L 2 u 0!
t* 5
(7)
Defining K L as the conductivity at x 5 L, we find from (3) and (4) and trigonometry that
Le k u sin b
and for t . t* we find that dM/dt 5 0. Thus for t , t*:
S
(8)
By substitution of (8) into (7), K L can be calculated from the right-hand side of (7) when I, L, sin b, and h 0 are given.
I x 2 k u sin b t h 0 k u sin b
(11)
Conceptually, (11) can be explained as follows: The water travels down with a velocity, v (v 5 k 0 sin b). There is no rain or evaporation from time 0 to t. Thus the moisture content at x and t, u ( x, t), is the same as the moisture content (let’s say location x A at time 0) at a distance x 2 x A uphill from x. (Note that x 2 x A 5 vt, where t is the time since rainfall stops.) The moisture content at location x A is dependent on the rainfall with rate I prior to time 0 and is determined by moisture content at the top of the slope, u0, plus the amount of rainfall that fell during the time needed to travel from the top to x A . This travel time from the top to x A equals x A /v or ( x 2 vt)/v. In particular, the flux at the bottom of the slope can be found by multiplying at the outlet ( x 5 L) the velocity of the water, the height of the water, the width, and moisture content. Thus from (10) we find for t # t*:
In particular, at the bottom of the hillslope where x 5 L, we note that k u~ u L 2 u 0! 5
(10)
M 5 Iwt L 2 and for t $ t*:
t k u sin b 2
(12) (13)
D
(14)
STEENHUIS ET AL.: TECHNICAL NOTE
M 5 M`
591
(15)
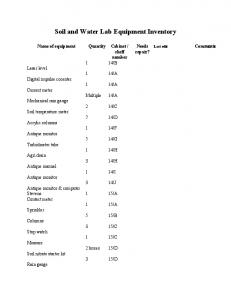
This elementary result is in surprisingly good agreement with experimental results (see Figure 2). By imposing dK/d u to be constant, we effectively ignore the slow drainage as u decreases and thus enhance the gravity effect artificially compensating for the fact that we ignored possible macropore flow. This is why our model and the others by Sloan and Moore [1984] artificially fit the Coweeta data better than the Nieber and Walter [1981] solution.
3.
Boussinesq’s Equation If flow takes place only in a saturated zone, then
s
h 52 ~h K L sin b ! 1 t x x
S
K Lh cos b
h x
D
1I
(16)
where h is the height of the water table perpendicular to the slope. If, for the moment, we ignore the term hh/ x; identify the drainable porosity, s, with ( u s 2 u 0 ); and take
u 2 u0 h 5 h0 us 2 u0
(17)
Figure 2. Predicted and actual cumulative outflow for the Coweeta experiment. The top line is the predicted outflow according to the improved Boussinesq’s model (equation (22)); the line in the middle is the predicted outflow from Richards’ equation or the simplified Boussinesq model (equations (14), (15), and (18)); the lowest line is the numerical results; and the dots are actual outflow from Hewlett and Hibbert [1963].
we find that ~ u s 2 u 0!
h0 u h0 u 5 2K L sin b 1I u s 2 u 0 t us 2 u0 x
(18)
which is identical to (5) if we replace k u by K L /( u s 2 u 0 ). Thus the solutions for the simplified Boussinesq and Richards equations are the same, and the fit in Figure 2 to the Coweeta experiment is identical if we set k u 5 K L /( u s 2 u 0 ). If we took the approach of Stagnitti et al. [1986] when dK/d u is a function of u, we could still identify it with the Boussinesq equation by postulating a similar dependence of the conductivity K( u ) on h, as done by Beven [1982]. Clearly, as t increases, the elementary Boussinesq model tells us that h at x 5 L decreases from h 0 to zero when t 5 t*. This is, of course, the same as saying in the previous section that h at x 5 L decreases from u s to u0 when t 5 t*. However, physically it is clear from the boundary condition that water content at x 5 L remains at saturation at all times. In the analysis so far, we have assumed that u is an “effective” water content which decreases with time to take into account the increasing capillary effect. Similarly, we could say that h is an “effective” cross section which decreases to zero with time. It would seem that having u , u s at x 5 L is somewhat more palatable than h , h 0 . The kinematic models of Sloan and Moore [1984] may be more complex than the present one but have that unavoidable feature as well. Is it possible to correct both features without undue work? Richards’ equation requires taking capillarity into account, but not so with Boussinesq’s equation. Then, we can impose that h 5 h 0 at x 5 L for all time if we retain the term hh/ x in (16). Note that this term is not a capillary term, and so no new physical property is required. Introducing this term modifies slightly the value of K L as (7) and (8) are replaced by KL 5 h0
S
IL h0 12 cotan b L
D
(19) sin b
Since h 0 /L is small the present K L is hardly different from the previous one as long as sin b is not too small. For the
Coweeta experiment we find that with (19) K L > 0.102 m/hr and, as expected, it is slightly higher than K L calculated previously, and the drainable porosity, s, can be calculated from the amount of water drained over the initial saturated volume in the plot or s 5 0.2636 is also slightly different from ( u L 2 u 0 5 0.24. Overall, conservation of mass for drainage is obtained by integration of (16), with I 5 0. This requires an estimate of h/ x. We take a straight line water table which is a good approximation [Sloan and Moore, 1984; Sanford et al., 1993], or h > x
h 0/L M 12 ~1/ 2!sh 0Lw
(20)
and (16) becomes dM 5 dt
S
M M` ~1/ 2!sh 0Lw M 2 M` M`
h 0K Lw sin b 1 2
D
(21)
with M ` still equal to the total volume drained or 1.26 m3. Equation (21) is integrated at once and yields M2
w 2 sh 0 cotan b ln 2
S
12
D
M 5 tK Lwh 0 sin b M`
(22)
which is almost as simple as (14) but has the advantage that M 3 M ` as t 3 ` rather than at a finite time. It is disappointing that (22) did not fit the cumulative flow better than (14), (15), and (18) (see Figure 2). Finally, the limitation of h/ x being a straight line can be examined by solving (16) numerically. The difficulty, however, is that the location of the no flux boundary condition (e.g., the water table) is changing in time, making the numerical process cumbersome. Equation (16) is therefore transformed by writing x as a function of h. We find that (16) (with I 5 0) becomes
592
STEENHUIS ET AL.: TECHNICAL NOTE
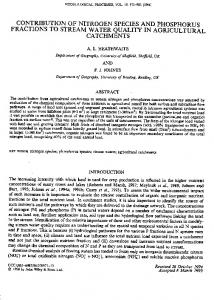
Figure 3. Water table heights simulated numerically with PDE2D.
s
x 5 t h
1
hK L sin b 2
hK L cos b x h
2
(23)
with the initial condition for the water table (Figure 1), namely, x5
h L h0
(24)
and boundary conditions x5L
h 5 h0
(25)
and the no flow boundary condition translates to x 1 52 h tan b
h50
(26)
Equation (23) was solved with a finite element program that was created using a general purpose PDE solver named PDE2D [Sewell, 1993]. The grid spacing was 1 cm. Time steps were selected, initially, 10 min, then 100 min, gradually increasing to 1000 min at the end of the simulation, for a total of 10,000 min. The numerically simulated outflow curve was almost equal to the analytical solutions (equations (14), (15), (18), and (22)) except at intermediate times when it was slightly lower and slightly closer to the experimental data than the analytical solutions. The simulated water table profiles (Figure 3) were initially linear as assumed for the analytical solution in (22) (Figure 3). However, at larger times the water table became concave leading to the small differences in cumulative outflow.
4.
Discussion and Conclusion
Kinematic models, based on either Richards’ or Boussinesq’s equation, have been first reduced to their simplest expression to predict the identical elementary drainage formula. The result is far simpler and as accurate as those obtained by similar, more complex models of the past. Kinematic models, by necessity, must require “effective” water con-
tents or water table heights which violate obvious exit boundary conditions. This of course always happens when higher spatial derivations are omitted from the governing equations. Presumably, this is the reason why kinematic models are often viewed by most engineers and scientists as being inadequate. However, we have shown that a very small improvement of the solution of Boussinesq’s equation removes this physical difficulty and leads to a result that better agrees with observations at the Coweeta Hydrological Laboratory and other more complex numerical models. Although the model presented is strictly applicable to shallow hillslopes, caution is necessary when validating watershed models with streamflow data. A fit of predicted and observed streamflow data should not be construed as a validation of the underlying physical model.
References Beven, K., Kinematic subsurface stormflow, Water Resour. Res., 17, 1419 –1424, 1981. Beven, K., On subsurface stormflow: Predictions with simple kinematic theory for saturated and unsaturated flows, Water Resour. Res., 18, 1627–1633, 1982. Hewlett, J. D., and A. R. Hibbert, Moisture and energy conditions within a sloping mass during drainage, J. Geophys. Res., 68, 1081– 1087, 1963. Hurley, D. G., and G. Pantelis, Unsaturated and saturated flow through a thin porous layer on a hillslope, Water Resour. Res., 21, 821– 824, 1985. Nieber, J. L., and M. F. Walter, Two-dimensional soil moisture flow in a sloping rectangular region: Experimental and numerical studies, Water Resour. Res., 17, 1722–1730, 1981. Sanford, W. E., J.-Y. Parlange, and T. Steenhuis, Hillslope drainage with sudden drawdown: Closed form solution and laboratory experiments, Water Resour. Res., 29, 2313–2321, 1993. Sewell, G., PDE2D: Easy-to-use software for general two-dimensional partial differential equations, Adv. Eng. Software, 17, 105–112, 1993. Sloan, P. G., and I. D. Moore, Modeling subsurface stormflow on steeply sloping forested watersheds, Water Resour. Res., 20, 1815– 1822, 1984. Stagnitti, F., M. B. Parlange, T. S. Steenhuis, and J.-Y. Parlange, Drainage from a uniform soil layer on a hillslope, Water Resour. Res., 22, 631– 634, 1986. Steenhuis, T. S., J.-Y. Parlange, M. B. Parlange, and F. Stagnitti, A
STEENHUIS ET AL.: TECHNICAL NOTE simple model for flow on hillslopes, Agric. Water Manage., 14, 153– 168, 1988. Zecharias, Y. B., and W. Brutsaert, Recession characteristics of groundwater outflow and base flow from mountainous watersheds, Water Resour. Res., 24, 1651–1658, 1988. A. Heilig, J.-Y. Parlange, T. S. Steenhuis, and M. F. Walter, Department of Agricultural and Biological Engineering, Cornell University, 216 Robb-Riley Hall, Ithaca, NY 14853-5701. (
[email protected]).
593
W. E. Sanford, Department of Earth Resources, Colorado State University, Fort Collins, CO 80523. F. Stagnitti, Department of Mathematics and Computing, Deakin University, Warrnambool, Victoria 3280, Australia.
(Received March 30, 1998; revised October 19, 1998; accepted October 20, 1998.)
594