"traditional" metrics to encompass development under the OO paradigm is ... engineering community and included in standards like the ISO 9000-3 (ISO, 1991a) ...
Originally published in Proceedings of AQUIS'93 Conference, Venice, Italy, October 1993. Selected for publication in the Journal of Systems and Software, vol. 26, no. 1, North-Holland, Elsevier Science, July 1994.
Candidate Metrics for Object-Oriented Software within a Taxonomy Framework Fernando Brito e Abreu */**
Rogério Carapuça */***
* Instituto de Engenharia de Sistemas e Computadores (INESC), Lisboa, Portugal ** Instituto Superior de Economia e Gestão (ISEG/UTL), Lisboa, Portugal *** Instituto Superior Técnico (IST/UTL), Lisboa, Portugal
Abstract This paper offers an overview of the state-of-the-art in OO metrics as well as some new contributions. The usefulness of metrics is reviewed. The inappropriateness of "traditional" metrics to encompass development under the OO paradigm is discussed. A framework for classifying metrics is suggested. Metrics are classified along two vectors: category and granularity. The usefulness and rationale behind each category are presented. Candidate metrics are suggested within the proposed framework. Finally, some research directions that require further effort are identified.
I - Introduction Object-Oriented (OO) technology has been pointed out as being one of the keys for solving the software crisis problem. For the past few years we have witnessed a burst in the availability of OO analysis and design methodologies, languages, database management systems and tools. However, little work has been done in the area of management of OO software development. One of the key issues in the management of the development process is the capability to measure and record the relevant attributes of the software products and of the process itself in a structured, coherent framework. The availability of metrics helps managers in the staffing, costing, scheduling and controlling activities of the development life cycle and contributes to the overall objective of software quality. The need for software metrics is now fully recognized by the software engineering community and included in standards like the ISO 9000-3 (ISO, 1991a). This paper is organized as follows: section II reviews the reasons why metrics are needed within the software development process, when using the OO paradigm; section III introduces a classification framework for OO software metrics; section IV analyses the need for each category and introduces one possible selection of metrics; section V attempts to draw some conclusions and to suggest some research directions.
2
II - Why Metrics in OO Development ? The factors that have been pointed out as the drivers of "traditional" initiatives in software metrics, still hold for software developments based on the OO paradigm. Software metrics allow, among other things: • the assessment of improvements, providing the most comprehensive solution to the problem of evaluating the benefits of technological migration or transition; • the reduction of the impredictability associated with software development efforts; • an effective control of quality; • an earlier identification of "hidden" problems; • the quantification of the extension and benefits of reuse; • the refinement of estimation models for predicting external software process attributes such as development time, maintenance effort and failure rate.
•
Any paper on metrics would be incomplete if Tom DeMarco's cliché was omitted at this point: "If you cannot measure it, you cannot manage it".
Most aspects of the software development process and respective products are too complex to be adequately captured by one single metric (Basili et al., 1988). However, the choice of a set of metrics exposes the well-known pitfalls of measuring: • too much, thereby getting overwhelmed by a big amount of unmanageable numeric data; • too little, thereby not gaining sufficient insight to be able to take corrective actions; • the wrong attributes, thereby deriving delusive conclusions. To avoid those traps a framework for the implementation of metrics' initiatives has to be adopted. Examples are the Goal Question Metric (GQM) (Rombach et al., 1987) and other frameworks proposed by some ECC ESPRIT projects (PYRAMID, 1991) (AMI, 1991). They suggest a step-by-step approach that starts with the identification of business objectives (goals), proceeds with the definition of intuitive and well-understood attributes of the software products and process that may represent those goals and finally derives the mapping from those attributes to a numbering system. Although the reasons for metrication in OO systems' development seem to be similar, current software metrics (LOCs, Halstead's, McCabe's, etc) are aimed at the traditional procedural-oriented languages. The OO paradigm includes new concepts and abstractions such as classes, methods, messages, inheritance, polymorphism, overloading and encapsulation, that were not addressed in previous metrics. Thereby there is an increasing need for metrics adapted to the OO paradigm to help manage and foster quality in software development. In section IV some differences between traditional metrics and OO metrics are further stressed. Some efforts have already been done to compare and evaluate those differences (Moreau et al.,
3
1989) and to define a set of mappings to enable the application of "traditional" software metrics to an OO environment through structural analogies (Stalhane, 1992).
III - Classification Framework III.i - Existing Taxonomies Several frameworks, summarized in tables 1 to 3, may be adopted for the metrics' taxonomy (Abreu, 1992) according to different perspectives such as target, structure and obtainment criterion. Type
Description
Examples
Product
quantification of attributes of the
length in words of the user manual, lines of
metrics
software development deliverables
source code, number of relations in a database
Process
quantification of attributes of the
design duration, coding effort, maintenance
metrics
software development process
cost, average effort for the application of 1 test
Hybrid
mixture of product and process
cost per function point, time to deliver n LOC,
metrics
metrics
average monthly failure rate per I/O interface Table 1: Target Taxonomy for Metrics
Type
Description
Examples
Elementary
quantification of a single attribute
requirements' specification dimension in
metrics
of the software development pro-
words, LOC, time to complete the design
cess or deliverables
phase, number of I/O screen forms
Composite
mathematical combination of se-
man.months per KLOC, average time for
metrics
veral elementary metrics
correcting one error, testing efficiency
Table 2: Structure Taxonomy for Metrics
Type
Description
Examples
Objective
precisely defined and equally ob-
number of uncommented lines of source code,
metrics
tainable on a repeatable fashion,
average number of yearly produced versions,
irrespective of the collector or time
the number of input screens
Subjective
depend on the collector's judge-
programmers' experience, average learning
metrics
ment; may lead to incoherent and
time, ease of utilization of a certain applica-
non repeatable measures
tion
Table 3: Obtainment Criterion Taxonomy for Metrics
4
The above taxonomies, although relevant, do not cover the "semantics" of metrics' usage. Neither they cover the level of abstraction within the paradigm concepts. To overcome those problems a new classification framework is needed. III.ii - The TAPROOT Framework The TAPROOT (TAxonomy PRécis for Object Oriented meTrics) is defined along two independent vectors, category and granularity. The basic underlying idea in the identification of the categories is that they correspond to the properties of the software products and processes where metrics have been used more effectively in the management process. An effort was made to find out the common denominator in the already extensive metrics' literature. A sample of 128 references was overviewed and the following categories arose: Metric's Category
No of refs.
Design
15
Size
27
Complexity
40
Reuse
5
Productivity
21
Quality
16
Generic Approach1
38
Table 4: number of references per category
The sample2 covered journal papers (57), conference or workshop papers in proceedings or journals (40), books (17), technical reports and other special publications (9), academic publications (3) and standards (2). The other vector is the granularity level. If we consider that a system built under the OO paradigm is made of interacting objects which are instances of a group of defined classes and that each object behaves according to the methods defined inside its corresponding class, then these three levels of abstraction, system, classes and methods, seem the most appropriate granules. The authors of (Rocacher, 1988) have already suggested similar levels of granularity for OO metrics.
1
- This row corresponds to the references that adopt a generic treatment, i.e. not specialized in any particular category of metrics. 2 - The complete list of references herein referred can be obtained by contacting the author. The reason why the total sum of references in table 4 is greater than the sample size, is that some of them covered more than one category.
5
Method
Class
System
Design
MD
CD
SD
Size
MS
CS
SS
Complexity
MC
CC
SC
Reuse
MR
CR
SR
Productivity
MP
CP
SP
Quality
MQ
CQ
SQ
Table 5: TAPROOT Classification framework
According to the proposed framework, eighteen different types of OO metrics can be identified. Each type is represented in table 5 by an acronym that is an aggregation of the first letter of the granularity and the first letter of the category.
IV - Metric Types Along this section, candidate metrics for each of the types will be suggested. Some of them have already been proposed by other authors (Chidamber et al., 1991) (Bieman, 1992) (Karunanithi et al., 1993), some have been adapted and others are new. Subsections have been grouped by category so that some considerations about each one can be introduced. IV.i - Design Metrics It is a well known truth that the later a problem is found in the development life-cycle, the more difficult and expensive it is to remove it. Thereby, the identification of potentially problematic modules, before the underlying design decisions are "ossified" into code, is one of the main objectives of design metrics. There is evidence that design metrics are related to a variety of quality characteristics of software products such as reliability, testability and maintainability (Shepperd, 1992a). A possible application of this kind of metrics could also be the recognition of good designers. With the increasing usage of CASE tools, with facilities for code generation, this issue is at risk of becoming more important than ever. According to (Kitchenham, 1992) there will be an increasing interest in design metrics during the 90's, mainly those that can be derived automatically from system specification notations in CASE tools. Some candidate OO design metrics follow: Method Design (MD) metrics • 3
Percentage of used instance variables 3
- instance variables are also called attributes.
6
•
Comments' density - Is the ratio of comments to code size. This percentage should be greater than a specified value. Smaller ratios indicate too little documentation, which may affect understandability.
Class Design (CD) metrics •
• •
Lack of cohesion in methods - Is the number of disjoint sets of instance variables used by the class' methods, so measures the disparate nature of methods in the class. Fewer disjoint sets imply greater similarity of methods. A greater number of disjoint sets imply lack of cohesion, so the class should be split into two or more sub-classes. Depth of inheritance - Is the longest inheritance chain. Class response - Is the number of methods available to the class, inside and outside the class. The larger this metric, then the higher requisite testing, the greater complexity of the class, and the greater understanding needed by the tester for methods outside the class.
System Design (SD) metrics • • •
Average dimension of methods - Its value should be kept low. The advised limit is language dependent. In (Lorenz, 1993) is suggested 8 LOC for Smalltalk and 24 LOC for C++. Average number of methods per class - Should be less than a specified value. Bigger averages indicate too much responsibility in too few classes. Average number of instance variables per class - Should be less than a specified value. The reasoning is similar to the previous metric. More instance variables indicate that a class is doing more than it should.
IV.ii - Size Metrics Size metrics are usually used in conjunction with complexity metrics and the distinction between them is sometimes unclear. Large classes or methods are harder to understand, to reuse, to test and to maintain. Class size metrics, for instance, reflect the effort required to build, understand and maintain a class. The same reasoning can be applied to complexity. Size metrics are an important piece of the resource estimation process. Indeed, most traditional estimation models use as input an objective size metric (LOCs) together with some subjective4 complexity measures. Size metrics also play an important part in the normalization of composite metrics. Without this normalization, it is not meaningful to compare attributes such as total effort, optimal number of test cases and number of failures among several projects. Hence, size metrics help to achieve a baseline for inter-project comparison. Some candidate size metrics follow:
4
- Because they are usually based in the answers to several questions about the system to build and the development environment.
7
Method Size (MS) metrics • •
Number of executable statements Operator and operand counts - It corresponds to the total number of tokens used as defined in the Software Science approach (Halstead, 1977)
•
Number of instance variables used
Class Size (CS) metrics • • •
number of methods Total number of instance variables - Is a dimension of the class private memory Size of class interface - Is the number of different types of messages an instance of the class can receive
System Size (SS) metrics • • •
Number of classes Total number of methods Total number of instance variables
IV.iii - Complexity Metrics Function Points Analysis (FPA) has been pointed out and used extensively for measuring the size and complexity of procedural software systems. Its touchstone is the capability of surmounting the problem of language dependencies, omnipresent when using LOC, by taking what is called the "user view", which is expressed in a function point count (Dreger, 1989). However, the items that are accounted for, such as internal files, external files and interfaces, while making sense for development using procedural languages, are far from being adaptable to OO development. In (Rains, 1991) it is argued that FPA is not suited for measuring the size and complexity of OO software. That author then proposes an alternative method for quantifying them, using the design specification (weighted sum of ADA package characteristics). This approach, however, lacks generality because it is language dependent. The Object Point Analysis is introduced in (Banker et al., 1992). According to the authors, its output measurement (productivity) metrics have the potential to yield equally accurate, yet easier to obtain, estimates than function points based measures. The drawback is that this approach was developed (and supposedly validated) only for object-based CASE environments with a centralized object repository. Very often the exhaustive inspection of code or thorough unit-testing of all modules is not feasible. The main reason for that is usually the lack of resources (time and people) needed to accomplish those tasks. Therefore, the available resources for quality control must be cleverly applied to cover at least 20% of the total modules that usually stand for more than 80% of the faults (the "old" Paretto Law) (Humphrey, 1989). Experimental data confirms that the phenomenon of
8
defect clustering still holds for object-oriented systems (Walsh, 1992). Complexity metrics can help finding those 20%. The greater the inheritance relation is, the greater the number of methods a class is likely to inherit, making it more complex and therefore requiring more testing. A method with a complex decision structure will be harder to test and maintain and is more error-prone. Complexity metrics based on the above criteria allow to pin-point potentially troublesome classes or methods, thus helping in the planning of the review and test efforts. Some candidate complexity metrics follow: Method Complexity (MC) metrics • • •
Cyclomatic complexity - as defined by Tom McCabe (McCabe, 1976) Volume metric - as defined by Maurice Halstead (Halstead, 1977) Information flow - as defined by Sallie Henry and Denis Kafura (Henry et al., 1981)
Class Complexity (CC) metrics • • • •
Children count - is the number of directly inheriting sub-classes Progeny count - is the number of sub-classes that inherit directly or indirectly Parents count - is the number of super-classes from which the class under consideration inherits directly Ascendancy count - is the number of super-classes from which the class under consideration directly or indirectly inherits
System Complexity (SC) metrics • •
Total length of inheritance chain - is the total number of edges in the inheritance hierarchy graph Coupling between objects - is the number of non-inheritance related couples with other classes, where coupling is a measure of two objects acting upon each other. This metric is detrimental to modular design and prevents reuse; it also necessitates more complex testing because of the complex interactions to other objects.
IV.iv - Reuse Metrics Reuse has been extensively identified as one of the key techniques to reduce the software "crisis". The OO paradigm is particularly suited to facilitate the adoption of reuse. Although it has only been intensively achieved in Smalltalk environments (Griss, 1991), reuse within OO software projects still remains the great hope to increased quality and productivity in software development and maintenance. No wonder, then, that a considerable share of the work in OO metrics has to do with reuse. It is a common belief that to make significant advances in software reuse, there is a need for a well-coordinated in-house program for promotion, management, education and for setting the necessary technological infrastructure. An important part of this effort has to be dedicated to the
9
creation of effective mechanisms for collection, distribution, quality assessment and refinement of reusable items. To endorse the problem of assessing the cost/benefit of such a reuse program, as a mean of justifying (to the upper management) such an investment, some companies have already started to collect and analyse reuse metrics (Griss, 1991). The mechanisms to support reuse are based on a reuse class library. If a formal paper-based or automatic "request for reuse" mechanism is in use, the metrics that can be obtained as the number of successful requests (found desired component), unsuccessful requests (searched but no component found), and actual uses of a component, can be used to decide which components should be kept in the reuse library and which components should be built or added to it. Thereby, reuse metrics can also be used to manage the reuse class library. Reuse in object oriented systems can be classified accordingly to different criteria (Bieman, 1992), as summarized in table 6: Criterion
Type
Description
Perspective
Client
view of new system or system component (user of reusable components)
Server
view of library (supplier of reusable components) or library component
Verbatim
without modification, i.e. importing code without change
Leveraged
with modifications
Internal
modules within a product are reused within the same product
External
use of externally constructed software. It can be quantified as the proportion of a product
Shape
Source
that was constructed externally Direct Extension
without going through an intermediate entity. (e.g. subroutine calls, instantiation of types or importation of modules)
Indirect
through an intermediate entity (e.g. Module A invokes Module B that invokes Module C; Module A indirectly reuses Module C) Table 6: Reuse Taxonomies
Some candidate reuse metrics follow: Method Reuse (MR) metrics • • •
Number of times the method is inherited - internal reuse (n1) Number of times the method is overloaded (n2) Method reuse efficiency (n1-n2)/n1
Class Reuse (CR) metrics • •
Percentage of inherited methods which are overloaded Number of times the library class is reused "as is" - verbatim reuse (server perspective)
10
•
Number of times the library class is reused with adaptation - leveraged reuse (server perspective)
System Reuse (SR) metrics • •
Percentage of reused "as is" classes - verbatim reuse (client perspective) Percentage of reused classes with adaptation - leveraged reuse (client perspective)
•
Library quality factor 5
IV.v - Productivity Metrics When software development organizations finally succeed, after surmounting the establishment, the "not-invented-here" syndrome and other obstacles, at putting reuse in place, programmers (designers) are then faced with tangled configuration dependencies. Deep inheritance trees are difficult to understand and an error in a "deeper" class, whose structure is inherited, is propagated. Developers working at a higher level of abstraction in a project depend on their understanding of the full problem domain and of the work of those working at lower levels of abstraction (Walsh, 1992). The final result is a need for a more thorough revision or testing process therefore reducing the overall productivity. On the other hand, some empirical studies concluded that using the OO paradigm substantially improves productivity (when compared with the procedural paradigm) although mainly because of reuse (Lewis et al., 1991). Indeed there is a need for productivity metrics to assess the cost/benefit ratio evolution due to the adoption of the OO paradigm. A common problem in productivity metrics is the misleading way in which effort is measured. Unpaid overtime is often not recorded. The apportionment, by the ongoing projects, of senior and administrative staff as well as training efforts is a difficult task. Another problem is that productivity is very much affected by technological factors (e.g. methodology, language, development environment, CASE tools) and human factors (e.g. dimension of development team, previous experience, budget and schedule pressures). Traditional productivity metrics may be inappropriate for OO systems. For example a metric in terms of new lines of code delivered per unit effort, will be lower in a OO environment due to reuse being one of the aims of the OO life cycle. The effort of class generalizing will probably further reduce the new lines of code. The effort along these lines will reduce maintenance and testing efforts, although other efforts need to be considered, such as in managing the reuse library. Several authors (Laranjeira, 1990) (Jenson et al., 1991) suggest that using an object-oriented representation of software allows an earlier estimation of development effort, when compared with "traditional" models, due to the fact that implementation of the system will correlate more directly with its specification. The way to estimate the size and complexity of an OO system starts with the p
5
- given, for instance, by
∑ ni p where p is the total number of classes in the library and ni is the number of times i =1
the class i was reused.
11
identification of object classes, methods and interfaces from a high-level natural language description of the system (requirements document). The size and complexity of each object and its methods must then be evaluated. This information is then fed into the estimation model. This estimation model must also embed the "knowledge" about the development team's productivity. However, each team is different, so each company has to refine (calibrate) its own model with productivity metrics gathered from past projects. Individual productivity is normally accepted in most business areas as a determinant factor of additional rewarding and therefore acts as a motivation agent. Strangely enough (or maybe not) this attitude is seldom found in software development teams. However, a growing number of companies (Davis, 1992) are starting metric programs with, among others, this objective. Some candidate productivity metrics follow: Method Productivity (MP) metrics • •
Effort to build an average6 method New methods developed per unit effort 7
Class Productivity (CP) metrics • •
Effort to build an average class New classes produced per unit effort
System Productivity (SP) metrics •
Average effort to build a class - It helps to estimate the overall effort for new projects
•
Reused classes adapted by unit effort
IV.vi - Quality Metrics Quality is perceived by the users through the "visible" side of software that encompasses things like reliability, usability and functionality, while the development teams are also concerned about "user invisible" quality characteristics like maintainability or portability (ISO, 1991b). Some quality attributes such as usability and functionality are highly subjective, although some effort has already been done to reduce this situation (Kirakowski et al., 1992). Learnability (a sub-characteristic of usability) can, for instance, be measured as the elapsed time for the "average" user8 to achieve a stated level of competence. Being able to measure the quality attributes, specially those that users "feel", is the ultimate measure of success of a software product. According to the IEEE terminology (ANSI/IEEE, 1988) the user comes across failures, while the developer must search for defects, which were responsible for those failures, in the code and/or 6
- "average" stands for average size and average complexity. - unit effort may be man.month, man.year, etc. 8 - provided that a convenient sample is available. 7
12
specifications . On the other hand, the developing team' manager must look for errors that cause common faults. A technique known by "Causal Analysis" can be used here as part of a global, repetitive, defect prevention process (Jones, 1985), but this is out of the scope of this paper. Before delivering a system to its final users, thorough testing (white and black-box types) must occur, specially when a system is intended to be installed in a great number of places. Some beta-test sites are usually selected to avoid wide-scale "surprises". Reliability metrics are needed to verify if the desired reliability is achieved prior to broad distribution. Some candidate quality metrics follows: Method Quality (MQ) metrics • • •
Method reliability - is the number of failures due to a method during a specified time-slot9. Number of defects found during a specified time-slot. Maintainability efficiency - is the average time to identify and correct a defect.
Class Quality (CQ) metrics •
Class reliability - is the number of failures due to a class during a specified time-slot (month, year)
• •
Average number of defects per method Average number of failures per method
System Quality (SQ) metrics • • •
Test effectiveness - it can be expresses as the ratio of defects found during testing versus total defects found. MTBF - is the medium time between (consecutive) failures. Average learning time - it can be expressed in hours.
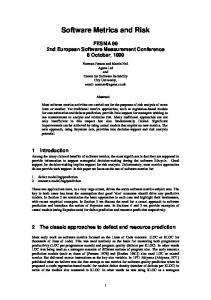
IV.vi - Some Examples Most OO analysis and design methodologies (Rumbaugh et al., 1991) (Booch, 1991) (Meyer, 1992) have their own graphical representations of inheritance mechanisms. For the sake of simplicity, inheritance will be represented here by a graph (figure 1) where nodes (rectangles) are classes and edges (arrows) are inheritance relations. Some of the candidate metrics are directly obtained from this inheritance hierarchy graph. Figure 1 represents such a graph, corresponding to a fragment of a vehicle management system.
9
- week, month, year, etc.
13
Vehicle
Maritime Vehicle
Land Vehicle
Car
Truck
Tank
Amphibian Submarine
Aeroplane
Ship
Fighter
Passenger Plane
Weapon Missile
Sword
Depth of Inheritance -> Tank (2), Aeroplane (1), Vehicle (0) Children Count -> Vehicle (3), Land Vehicle (4), Aeroplane(2) Progeny Count -> Maritime Vehicle (3), Vehicle (11), Weapon (5) Parents Count -> Submarine (1), Amphibian (2), Tank (2), Weapon (0) Ascendancy Count-> Amphibian (3), Truck (2), Fighter (3), Sword (1) Total Length of Inheritance Chain = 17
Figure 1: Some metrics derived from an inheritance hierarchy graph
V - Conclusions and Future Trends A considerable number of metrics for object-oriented software development has been suggested in this paper within a proposed classification framework (TAPROOT). This was defined across two independent vectors: category (design, size, complexity, reuse, productivity, quality) and granularity (method, class, system). The proposed metrics refer to abstractions of the object-oriented paradigm. The general inappropriateness of "traditional" metrics was pointed out, although some may still be used, particularly at the method's level. Some considerations were made about the necessity and applicability of each of the considered categories. Some overlapping between the categories proposed in TAPROOT may occur. The distinction between size and complexity metrics is sometimes unclear. Those two categories have also been combined in the past to be used as design metrics (Shepperd, 1992b). On the other hand, quality attributes of the software products are related to its design. Hence, TAPROOT cannot be considered as a final proposal. Instead, it is a starting point and we require feedback to improve it. The proposed metrics within each type must undergo a thorough revision process. First of all, some quality attributes that metrics must exhibit, have to be verified. Those will be: • measurability - they must have an unambiguous definition of the way they are calculated; • repeatability - they must take the same value, even when calculated by different people or at different times;
14
•
low obtainment cost - they must be obtained in a easy and quick fashion, preferably with the help of a tool; • validity - they must allow the objective measurement of the attributes for which they were proposed; The best way to get some insight about this, is to apply a test case. This effort is under way. Metrics should be constructed with a firm basis in theoretical concepts in measurement, while capturing empirical notions of software properties (Chidamber et al., 1991). Some interesting work has already been developed in the field of theoretical foundations of metrics (e.g. scale types, allowed transformations and meaningfulness) based on the Measurement Theory (Zuse, 1991) (Fenton, 1991). An axiomatic approach in which properties that software metrics must hold are identified, may help in the detection of flawed metrics prior the time-consuming empirical validation (Shepperd, 1991) (Weyuker, 1988) (Prather, 1984). Other promising track is the integration of the metrics' research with that of process modelling. A first effort in this direction is contained in (Shepperd, 1992a). Some research conclusions about how to apply those approaches to metrics within software development efforts using the OO paradigm will certainly bring new insights. Last, but not the least, there is a need of validation through repeatable and precise experiments as in any other engineering or scientific field. This is certainly the case for OO software metrics. References Abreu, Fernando Brito, Metrics in the Management of Information Systems Development Projects (in Portuguese), Proc. of 6th Jornadas de Qualidade no Software, APQ, Lisbon, Portugal, December 1992. AMI Consortium, Metric Users' Handbook - A Quantitative Approach to Software Management, ESPRIT Project 5494, 1991. ANSI/IEEE, Standard Dictionary of Measures to Produce Reliable Software, Std 982.1, IEEE, 1988. Banker, R. D. & Kauffman, R. J. & Kumar, R., An Empirical Test of Object-Based Output Measurement Metrics in a Computer Aided Software Engineering (CASE) Environment, Journal of Management Information Systems, vol.8, n.3, p.127-150, Winter 91-92. Basili, V. R. & Rombach, H.D., The TAME Project: Towards Improvement-Oriented Software Environments, IEEE Transactions on Software Engineering, vol.14, n.6, p.758-773, November 1988. Bieman, J., Deriving Measures of Software Reuse in Object Oriented Systems, Proc. of BCS-FACS Workshop on Formal Aspects of Measurement, Springer-Verlag, LNCS, 1992. Booch, Grady, Object Oriented Design with Applications, Benjamin / Cummings, 1991. Chidamber, S. & Kemerer, C., Towards a Metrics Suite for Object Oriented Design, Proc. of OOPSLA'91, p.197-211, 1991. Davis, D. B., Does Your Shop Measure Up?, Datamation, September 1, p.26-32, 1992 Dreger, J.Brian, Function Point Analysis, Prentice-Hall, Englewood Cliffs, NJ, 1989.
15
Fenton, N. E. (editor), Software Metrics: A Rigorous Approach, Chapman & Hall (UK) or Van Nostrand Reinhold (USA), 1991. Griss, M.L., The Economics of Software Reuse, Proc. of OOPSLA'91, p.264-270, 1991. Halstead, M. H., Elements of Software Science, Elsevier North-Holland, New York, 1977. Henry, Sallie & Kafura, Denis, Software Structure Metrics Based on Information Flow, IEEE Transactions on Software Engineering, vol.7, n.5, p.510-518, September 1981. Humphrey, Watts S., Managing the Software Process, SEI Series in Software Engineering, Addison-Wesley Publishing Company, 1989. ISO9000-3, Guidelines for the Application of ISO 9001 to the Development, Supply and Maintenance of Software, ISO/IEC, June 1991. ISO9126, Information Technology - Software Product Evaluation - Quality Characteristics and Guidelines for their use, ISO/IEC, 1991. Jenson, R. & Bartley, J., Parametric Estimation of Programming Effort: An Object-Oriented Model, Journal of Systems and Software, vol.15, n.2, p.107-114, 1991. Jones, C. L., A Process-Integrated Approach to Defect Prevention, IBM Systems Journal, vol.24, n.2, p.150-167, 1985. Karunanithi, S. & Bieman, James, Candidate Reuse Metrics For Object Oriented and Ada Software, Proc. of IEEE International Software Metrics Symposium, p.120-128, Baltimore, May 1993. Kirakowski, Jurek & Porteus, Murray & Corbett, Mary, How to Use the Software Usability Measurement Inventory: the Users' View of Software Quality, Proc. of 3rd European Conference on Software Quality, Madrid, November 1992. Kitchenham, Barbara A., Development in Software Metrics in the Last Decade, Proc. of EUROMETRICS'92, p.17-26, Brussels, April 1992. Laranjeira, L., Software Size Estimation of Object-Oriented Systems, IEEE Transactions on Software Engineering, vol.16, n. 5, p.510 - 522, May 1990. Lewis, John A. & Henry, Sallie M. & Kafura, Dennis G., An Empirical Study of the Object-Oriented Paradigm and Software Reuse, Proc. of OOPSLA'91, p.184-196, 1991. Lorenz, M., Object-Oriented Software Development: a Practical Guide, Prentice-Hall, 1993. McCabe, Tom, A Complexity Measure, IEEE Transactions on Software Engineering, vol.2, n.4, p.308-320, December 1976. Meyer, Bertrand, Eiffel: The Language, Prentice Hall International, 1992. Moreau, D. & Dominick, W., Object-Oriented Graphical Information Systems: Research Plan and Evaluation Metrics, Journal of Systems and Software, vol.10, p.23-28, 1989. Prather, R. E., An Axiomatic Theory of Software Complexity Measures, Computer J., vol.27, n.4, p.340-347, 1984. PYRAMID Consortium, Quantitative Management: Get a Grip on Software, Y91100-4, ESPRIT Project 5425, December 1991. Rains, Ernie, Function Points in an Ada Object-Oriented Design?, OOPS Messenger, vol.2, n.4, p.23-25, ACM Press, October 1991.
16
Rocacher, D., Smalltalk-80 and SMACK : Towards a Methodological Approach to Software Quality, ESPRIT 1988, Project n.1257, Metric Use in Software Engineering (MUSE), p.492-502, 1988. Rombach, H.D. & Basili, V.R., A Quantitative Assessment of Software Maintenance, Proc. of Conference on Software Maintenance, Austin, TX, September 1987. Rumbaugh, J. & Blaha, M. et al., Object-Oriented Modelling and Design, Prentice Hall, 1991. Shepperd, M., The Algebric Validation of Software Metrics, Proc. of 3rd European Software Engineering Conference, Milan, 1991. Shepperd, M., Products, Processes and Metrics, Information and Software Technology, vol.34, n.10, p.674-680, October 1992. Shepperd, M., Measurement of Structure and Size of Software Designs, Information and Software Technology, vol.34, n.11, p.756-762, November 1992. Stalhane, Tor & Coscolluela, A., Final Report on Metrics, Deliverable D1.4.B1, ESPRIT Project 5327 (REBOOT), February 1992. Weyuker, E., Evaluating Software Complexity Metrics, IEEE Transactions on Software Engineering, vol.14, n.9, p.1357-1365, September 1988. Walsh, James F., Preliminary Defect Data from the Iterative Development of a Large C++ Program (Experience Report), Proc. of OOPSLA'92, p.178-183, 1992. Zuse, H., Software Complexity: Measures and Methods, Walter de Gruyer, New York, 1991.