COMPARISON OF SOFTWARE METRICS TOOLS FOR .NET Jernej Novak University of Maribor Faculty of Electrical Engineering and Computer Science Smetanova ulica 17, 2000 Maribor, Slovenia Tel: +386 22207187; fax: +386 22207272 e-mail:
[email protected] Gordana Rakić University of Novi Sad, Faculty of Sciences, Department of Mathematics and Informatics Trg Dositeja Obradovića 4, 21000 Novi Sad, Serbia e-mail:
[email protected]
presents the results and an analysis of them. We conclude with a summary of the results and some questions for further work.
ABSTRACT In this paper we will compare tools for calculating software metrics. We will examine tools that are available free on the internet and capable of calculating software metrics for C# language. The purpose of this paper is to compare the calculations of software metrics and determine if the tools are providing the same results. We would like to discover if choosing a different tool can provide different results and consequently bring different decisions.
2 DESCRIPTION OF THE STUDY In this chapter we will describe how we performed the experiment. All experiments were performed on a standard PC which always met the minimum requirements expected for all software metrics tools. The data collected from software metric tools was stored for further processing. All results were manually migrated to an Excel file for easier further processing. First we chose tools for calculating software metrics, afterwards we selected software metrics for testing. Then we chose software on which we will performing metric calculations. At the end of this chapter, we will describe in detail how the analysis of results was carried out.
1 INTRODUCTION To make software that is good and reliable we need a suitable quality model. One of the quality models is the ISO 9126, which among other things, requires software metrics [1 ][2]. To make a reliable quality model we need tools that can provide us with software metrics calculations. To make a solid and reliable quality model we need tools that can provide us with accurate data. Software metrics are a mathematical definition for mapping the entities of a software system to numeric metric values. We also assume that software metric tools implement software metrics according to their definitions. There are quite a few available tools that can provide us with software metric values for C# language or .NET assemblies. In this paper, we will not deal with whether this information is accurate or not but whether different tools give us different results. The goal of this paper is to answer if metric tools for C# language give us different results. After a review of existing literature, we found a similar paper but this paper was testing tools for the Java language and was using a different comparison technique [3]. In the next section, we will describe what tools we used, what tools we chose for metrics calculations and we will offer a description of the analysis. The third section
2.1 Software Metrics Tool Selection First, we performed a free search on the internet to find available tools for the computation of software metrics. The first criteria was that the tool can calculate any software metrics for C# language or .NET assemblies. We found ten tools, of which five met all the required criteria. The criteria was that the tool is available for free, or that at least a trial version is available for a specific period of time, and that the tool has a graphical user interface from which we could manage the tool. In the following paragraphs we will briefly describe the five chosen tools for our experiment. CodeMetrics (Add-in for Reflector) analyses and computes several code quality metrics on .NET assemblies. This tool and its source code are freely available on the [4]. NDepend is a Visual Studio tool to manage complex .NET code and achieve high Code Quality. With NDepend,
231
software quality can be measured using Code Metrics, visualized using Graphs and Treemaps, and enforced using standard and custom Rules. Software metrics calculation is also done on .NET assemblies. The NDepend is shareware but is freely available for research projects.[5] SourceMonitor is a freeware program that lets you look inside your software source code to find out how much code you have and to identify the relative complexity of your modules. This tool runs on C# source code and it is freely available to download over the internet.[6] Visual Studio Code Metrics is a set of software measures that provide developers with a better insight into the code they are developing. This tool comes free with Visual Studio in a premium and ultimate edition.[7] Borland Together (add-in for Visual Studio) enables you to analyze, design and implement flexible and maintainable software architectures that can be easily modified as requirements change. It runs on C# source code. It is available for shareware usage for 15 days.[8]
Tool
SoftwareMetrics M a a I v v g g C C
D I T
a v g
a v g
C B O
L O C
Program name Visual Studio Borland SourceMonitor ReflectorAddin NDepend Table 1: Tools and software metrics.
L O C
a v g C O M .
In Table 1, we can see the used tools and metrics for our experiment. The fields selected with a check show that the tool supports selected metrics and the spaces marked with an X show that the tool does not support selected metrics. All tools have a solid coverage of software metrics except the Reflector addin.
2.2 Software Metrics Selection First, we made a list of all the available software metrics that the tools provided. Tools provide different set metrics. But after analyzing them, we recognized metrics with different names but with the same definition and calculating algorithms. We decided to choose seven software metrics, of which we could say that they represent the same software metrics definitions. After considering all the parameters we decided to include the following seven metrics in our research:
2.3 Choosing Software To choose testing tools, we limited ourselves to testing systems written in C# language. We performed a free search on the SourceForge.net page and randomly chose five different projects. We chose only Windows projects for easier compilation and calculation of software metrics. We were also trying to choose different sizes and projects of varying origins. In the next paragraph we will present the five programs that we chose for our experiment.
Maintainability index includes composed metrics. It is calculated with a certain formula from lines-of-code measures, McCabe measures and Halstead complexity measures[9]. Average Cyclomatic Complexity is used to indicate the complexity of the program. It measures the number of linearly independent paths through the program source code [10]. Average Depth of Inheritance Tree (DIT) is the maximum length of a path from class to root class in the inheritance structure of a system [11]. Average Coupling Between Objects (CBO) is the number of classes that a class is coupled to [11]. Lines of Code (LOC) is used to calculate the size of a software program by counting the number of lines in the text of the program or intermediate language [12]. Average Lines of Code represents the average LOC metrics per module. Average Comment Ratio is calculated from the average lines of code divided by the average comments count per module. For an unambiguous definition for software metrics please refer to the original sources defined in the references.
CompressFolders is a windows application that allows us to compress folders and files. FileManager is a Windows application that enables us to manage files, upload and download files from a server and to see the history of uploaded and downloaded files. Gammit! is a Windows application that allows us to set the gamma level for an LCD monitor. It also corrects the lighting of an LCD monitor. Palantir is a Windows application that allows us to review all remote computer connections. ZedGraphWin is a Windows controller for drawing graphs for Windows applications. 2.4 Analysis description To collect data, we installed all the chosen tools. Between tools there were no dependencies or side effects that we should consider. The tested software was saved in a dedicated space so that all tools were performing an analysis on the same source code. To avoid unwanted changes or mistakes on the source code, we stored the analyzed source code prior to testing in a read-only drive.
232
When we installed all the tools and when all the tested software was ready, we ran an analysis with each tool for each tested software. Then we exported all data to MS Excel 2007 and there conducted some further analysis, as described later on in this paper.
In Table 4, we can see a comparison of each tool with each from one tool we other with a T-test. Each vector compared to another tool. After conducting every comparison, we got metrics as seen in Table 4. For significantly different results, we will take those that are in an 80% of interval of trust. We decided on the value 80% after reviewing the existing literature review [13]. This means that two tools will be different if their values of TTest are under 0.05.
Metric k Project 2 MkV1,2
...
Tool 1
Project 1 MkV1,1
...
Project i MkV1,i
Tool 2
MkV2,1
MkV2,2
...
MkV2,i
. . . Tool j
. . . MkVj,1
. . . MkVj,2
. . . ...
Average
. . . MkVj,i
3 RESULTS AND ANALYSIS
. . .
A quick glance at the results confirmed that results can differ significantly between tools. We also calculated standard deviations for each metric. In Table 6, we can see values differing especially for LOC software metrics. The most consistent results were seen with DIT software metrics. A very significant deviation in LOC software metrics can be assigned to many different poorly defined LOC software metrics.
Table 2: Calculation of average values by tool for multiple projects. All stored data was saved to a dedicated excel file. As shown in Table 2, we calculated the average metric values for every metric. So we had seven tables with data, each for every software metric. Most data collection and data organization was manual. We calculated the average values for each tool from 1 to j. For each tool and for each software metric we got average values from to , where k is the number of software metrics and j is the number of tools. From these values we then made the vectors
until
Average standard deviation
MI
avg CC
avg DIT
CBO
avg LOC
LOC
avg com
7.5
6.9
0.8
7.6
49
3104
16
Table 5: Average standard deviations for specific metrics. 3.1 T-Test results
and with these values we made T-Tests.
We can look at the obtained results of the T-Test in Table 6 and if we accept an 80% trust interval, we can see that most of the tools give us significantly different results. . . .
TTEST Visual Studio
Table 3: T vectors.
Borland Source Monitor
Table 3 shows the average values for the software metrics for each tool. Because not all tools supported all applicable software metrics, we had to alternate some of the vectors that we could compare with the pair T-Test. Tools Tool 1 Tool 2 . . . Tool j-1
Tool 1
Tool 2 T-Test(
... )
T-Test(
)
...
T-Test( . . .
)
T-Test(
Source Monitor 0,037
Reflector Addin 0,021
Ndepend
0,038
0,039
0,037
0,056
0,038
ReflectorAddin
0,032
0,08
Ndepend
Table 6: Values of the T-Test for each tool.
Tool j
...
Visual Borland Studio 0,036
The T-Test fails only on results that give us the two pairs of tools. These are Reflector.CodeMetrics and SourceMonitor pair and Reflector.CodeMetrics and NDepend pair. And even this test failure can be assigned to the small vector . Reflector.CodeMetrics had the small vector because it only supported three of the seven tested software metrics. All other tool results were confirmed, so that we can claim that tool results differ significantly.
)
Tool j Table 4: Tool comparison table.
233
of the project. In that case, we have to be prepared to gain inconsistent and incomparable metric results. These conclusions confirm the need for new “universal” software metric tools that would provide comparable results for the whole project independent of the languages used for the development of the project.
References [1] ISO ISO/IEC 9126-1, Software engineering - Product Quality - Part 1: Quality model., 2001. [2] ISO. ISO/IEC 9126-3, Software engineering - Product Quality - Part 3: Internal metrics., 2003. [3] Jonas Lundberg and Welf Löwe Rüdiger Lincke, "Comparing Software Metrics Tools," International Symposium on Software Testing and Analysis, 2008. [4] CodeMetrics add in Reflector. [Online]. " http://reflectoraddins.codeplex.com/wikipage?title=Co deMetrics&referringTitle=Home [5] (2010) NDepend. [Online]. http://www.ndepend.com/ [6] SourceMonitor. [Online]. http://www.campwoodsw.com/ [7] Code Metrics Values. [Online]. http://msdn.microsoft.com/en-us/library/bb385914.aspx [8] Borland Together 2005. [Online]. http://www.borland.com/us/products/together/index.ht ml [9] M. Vestergren Andersson, "Object-Oriented Design Quality Metrics," Uppsala University. [10] McCabe, "A Complexity Measure," IEEE Transactions on Software Engineering, 1976. [11] C. F. Chidamber S. R. and Kemerer, "A Metrics Suite for Object Oriented Design," IEEE Trans. Softw. Eng., 1994. [12] Metrics definitions. [Online]. http://msquaredtechnologies.com/m2rsm/docs/rsm_met rics_narration.htm [13] George P. McCabe David S. Moore, Introduction to the practice of statistics.: W.H. Freeman and Company New York, 2003. [14] Rakić G., Budimac Z., Bothe K., Towards a ‘Universal’ Software Metrics Tool - Motivation, Process and a Prototype, Proceedings of the 5th International Conference on Software and Data Technologies (ICSOFT), 2010
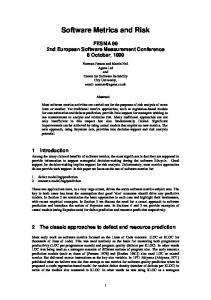
Figure 1: Polar graph with significance threshold. In Figure 1 we can see that the only values of the Reflector and NDepend did not pass the T-Test so we cannot claim that these two tools gave us different results. We showed that C# metrics tools differ from each other. So we only confirmed what was shown in the article “Comparing software metrics tools” [3] with the difference of using different tools (C# instead of Java) and by applying a different method.
4 CONCLUSION AND FUTURE WORK Developers and engineers of software must rely on scientific data and this data should be accurate. Especially when these data are the foundation for making important decisions. If we make decisions based on inaccurate data, we can change the development lifecycle and with this we can affect the quality of a software product. In this experiment we showed that the metrics tool gave us different results for the same inputs. Results can vary so much that engineers can adopt different decisions just because they chose another tool. So choosing the right tool is important. We also must know that we cannot compare metrics data given from different tools. We hope that in the future tools will get more consistent and will give us comparable results. In this paper we did not answer which tool is better and give us more accurate results. In the future maybe we should mathematically review the metrics and write test cases from which we could then determine if the metrics tool calculated the correct metrics value. Also, if we keep in mind the conclusions in this paper and the results from [14] we have to consider problems in large projects developed in several languages. In these projects, several tools have to be used to measure all the components
234