J Intell Manuf DOI 10.1007/s10845-015-1145-2
Capturing emotion reactivity through physiology measurement as a foundation for affective engineering in engineering design science and engineering practices Stephanie Balters1 · Martin Steinert1
Received: 16 December 2014 / Accepted: 22 August 2015 © The Author(s) 2015. This article is published with open access at Springerlink.com
Abstract This paper presents the theoretical and practical fundamentals of using physiology sensors to capture human emotion reactivity in a products or systems engineering context. We aim to underline the complexity of regulating (internal and external) effects on the human body and highly individual physiological (emotion) responses and provide a starting point for engineering researchers entering the field. Although great advances have been made in scenarios involving human-machine interactions, the critical elements—the actions and responses of the human—remain far beyond automatic control, because of the irrational behavior of human subjects. These (re)actions, which cannot be satisfactorily modeled, stem mostly from the fact that human behavior is regulated by emotions. The physiological measurement of the latter can thus be a potential door to future advances for the community. In this paper, following a brief overview of the foundations and ongoing discussions in psychology and neuroscience, various emotion-related physiological responses are explained on the basis of a systematic review of the autonomic nervous system and its regulation of the human body. Based on sympathetic and parasympathetic nervous system responses, various sensor measurements that are relevant in an engineering context, such as electrocardiography, electroencephalography, electromyography, pulse oximetry, blood pressure measurements, respiratory transducer, body temperature measurements, galvanic skin response measurements, and others, are explained. After providing an
B
Martin Steinert
[email protected] Stephanie Balters
[email protected]
1
Department of Engineering Design and Materials (IPM), Norwegian University of Science and Technology (NTNU), Trondheim, Norway
overview of ongoing engineering and human-computer interaction projects, we discuss engineering-specific challenges and experiment setups in terms of their usability and appropriateness for data analysis. We identify current limitations associated with the use of physiology sensors and discuss developments in this area, such as software-based facial affect coding and near-infrared spectroscopy. The key to truly understanding user experience and designing systems and products that integrate emotional states dynamically lies in understanding and measuring physiology. This paper serves as a call for the advancement of affective engineering research. Keywords Affective engineering · Emotion reactivity · Emotion coding through arousal and valence · Sympathetic and parasympathetic nervous systems · Physiological measurement sensors
The need to measure emotions—a call for affective engineering This work is targeted at engineering design researchers considering employing newly and readily available physiological sensors to better capture and incorporate the human emotional element, such as in human-centered design (HCD) or interaction studies, with the aim of identifying the best processes or user interface configurations to use, for example. We call this affective engineering. This paper is intended to explain the fundamentals and complexities of affective engineering, especially from a physiology perspective. The intent is to collect, frame, and present the state of the art of using physiology sensors to capture somatic changes in an engineering context. We seek in particular to underline the complexity of regulating internal and external effects on
123
J Intell Manuf
the human body and highly individual physiological (emotion) responses, resulting in the challenge of interpreting in situ experimental data, which, unlike in medical or cognitive science contexts, are prone to “noise” and uncontrollable in situ variables. Emotions are the keys to understand varying and sometimes irrational behavioral patterns, and the use of physiology sensors is one potential way to capture emotional responses. Considerable progress has been made in measuring and interpreting physiological responses, especially in psychology, neuroscience, and cognitive science (“Emotion and its expression in the form of physiological changes” section), as well as in human factors engineering (HFE) and ergonomics and human–computer interaction (HCI) (“Physiology sensor use in engineering and engineering design science experiments and its (future) challenges” section). However, studies that have been conducted on such topics as decoding mental stress, mental effort, and cognitive load (Chen et al. 2011; De Rivecourt et al. 2008; Desmet 2003; Hjortskov et al. 2004; Nguyen and Zeng 2014) have usually been accomplished under characteristically static and stimuli-controllable experimental conditions, whereas engineering calls for in situ setups that incorporate noise and currently unpredictable environmental contexts (“Overview of current studies using physiology sensors in engineering and human–computer interaction settings” section). The key to seeing, unlocking, comprehending, and in future interpreting the underlying complexities lies in understanding the fundamentals of the physiological processes of the autonomic nervous system of the human body (“The autonomic nervous system and its regulation of the body” section). Humans are integral parts of any engineering product or system, as stakeholders, users, or supervisors during usage or as engineers or designers during development, production, installation, maintenance, and until the end of the life of the product or system. With respect to scenarios involving human–machine interactions in particular, great advances have been made in decision support and control systems (Kouatli and Jones 1990; Albayrak and Erensal 2004; Malakooti 2010; Fontan et al. 2005; Ruderman et al. 2011). However, the critical elements, the actions and responses of humans, remain far beyond automatic control because of the irrational behavior of human subjects (Wilson and Keil 2001; Boy 2012; Sears and Jacko 2007; Cacciabue 2004). These (re)actions, which cannot be satisfactorily modeled, stem mostly from the fact that human behavior is regulated by emotions. The physiological measurement of the latter can thus be a potential door to future advances for the community, whether it is in cars or in critical user-controlled systems, or in critical user experiences. Since the early 1960s, we have come to realize that engineering should be human centered (Fitts 1951; Birmingham and Taylor 1954; McCormick 1976). This notion
123
has given rise to human- or user-centered design paradigms and sophisticated system–user interaction simulations and testing. When representing humans in engineering, both in design and in manufacturing, we resort primarily to synthesizing various data points into generic models based on certain boundary conditions. These models or agents are supposed to reflect, for example, the average “user” and her behavior. A certain general and stable stimulus– response behavior is assumed. Thus, the system and its human response are designed accordingly in a predetermined fashion. Many of today’s user experiences are designed in this “static” way. Consequently, most such systems, including decision support systems and control systems, assume a predefined (re)action of any human in a given situation. Some more advanced systems, such as expert advice systems, use learning algorithms and tailor the feedback to the individual user. However, even the behavioral responses of a single user cannot be forecasted with perfect accuracy because the (re)actions of a single user and the (re)actions between users shift at various times, sometimes greatly. Nobel prize-winning research in economics, underpinned by research in cognitive sciences (Kahneman and Tversky 1979, 1984; Kahneman 2011), points to the existence of irrational exuberance (Shiller 2000), i.e., the idea that humans behave neither fully rationally nor in stable patterns independent of contextual situations. Depending on situational, psychological, and physiological factors, such as personal life issues, excessive workload, lack of sleep, or food consumption, behavioral responses may vary greatly, from rapid action taken to mitigate a crisis to freezing when confronted with system alarms. Indeed, the physiological responses to a stress-inducing task or situation, such as a ship docking maneuver, refueling, take-off, or landing of an airplane or spaceship or crisis control in a nuclear power station, vary among individuals and are highly dependent on the individual’s appraisal of her ability to cope with the situation (Tomaka et al. 1997; Lukey and Tepe 2008; Mackie and Smith 2004; Reis and Judd 2014). One way to address this fuzziness problem is to capture and measure all circumstantial variables related to a person and an environment—which is not currently possible because of the sheer number of potential factors of influence. Another approach, which we believe is potentially better, is to measure the physiological response of an individual in a given situation to estimate and model his or her emotion reactivity at that specific point in time. Especially noteworthy in this context is the emergence and development of Kansei Engineering in Japan in the 1970s, which clearly identifies the need to include and indeed design the emotional dimension in engineering (Nagamachi 1995). Most of the existing Kansei tools, however, focus on deriving insights from triangulating external or systemic factors to, for example, lever decision support (Matsubara and Nagamachi 1997). We believe that the key
J Intell Manuf
to unlocking the individual, situation-dependent response of a human and the resulting effect on the situational user experience, with all its consequences, lies in measuring emotion reactivity, as determined from the physiological responses of the human body. In a nutshell, the unpredictability of human behavior drives us to explore ways to better understand the behavioral dimensions and the mechanisms of the black-box system that is a “human”. The keys are emotions and their moderating effects on behavior. These are crucial to understanding the response variances and occasional irrationalities of human behavior. Affect,1 the emotional dimension, is thus critical to designing and engineering human–machine interactions. Thus, transferring the relatively new human–computer interaction (HCI) paradigm of affective computing into “dirty” engineering, we call for the emergence of affective engineering as a key contributor to future product and system design and development (Balters and Steinert 2014).
Emotion and its expression in the form of physiological changes Psychology has provided the fundamental knowledge and framework of emotions and primarily tells us about the existence and great importance of emotions as part of being human. Emotions are no longer considered in relation to random types of behavior varying from individual to individual but rather as specific and repeatedly occurring patterns. In this way, psychology presents emotions or affects as sorts of moderating variables that steer human behavior. Hence, research has been focused on explaining how humans experience emotions and how emotions affect human behavior. The key driver is thought to be the underlying complex interplay of the three processes of emotion (Coan and Allen 2007; Furlong et al. 2014), namely, (1) emotion reactivity, i.e., “the type, magnitude, and duration of responses to changes in the internal and external environment” (Levenson 2007); (2) emotion regulation, i.e., “the processes by which we influence which emotions we have, when we have them, and how we experience and express them” (Gross 1998); and (3) emotion understanding, i.e., “the knowledge about whether or not we or others are experiencing emotions” (Coan and Allen 2007). Two opposing schools of thought exist concerning the discrete versus dimensional classification of emotion. The first school of thought regards (basic) emotions as discrete categories that are biologically fixed and universal to all humans (Tomkins 1962; Ekman and Friesen 1971; 1
Please note that affect goes beyond pure emotion reactivity (Russell and Feldman Barrett 1999). It also includes situational factors, such as moods and feelings, that influence actual behavioral responses.
Ekman et al. 1983; Ekman 1992). Plutchik (1962) considered acceptance, anger, anticipation, disgust, joy, fear, sadness, and surprise to be basic emotions, whereas Ekman et al. (1972) defined six basic emotions, namely, happiness, surprise, anger, sadness, disgust, and fear. In 1999, Ekman expanded this list of basic emotions by adding amusement, contempt, contentment, embarrassment, excitement, guilt, pride in achievement, relief, satisfaction, sensory pleasure, and shame (Ekman 1999). The second school of thought regards emotions, i.e., affects, as combinations along the dimensions of arousal and valence (Wundt and Pintner 1912; Russell 1980; Russell et al. 1989; Watson and Tellegen 1985; Reisenzein 1994; Lang 1995; Feldman Barrett and Russell 1998). In 1980, Russell presented his Circumplex Model of Affect, describing a two-dimensional grid ranging from arousal to sleepiness and from pleasure to misery (Russell 1980). He and his colleagues later called it The Affect Grid (Russell et al. 1989). Watson and Tellegen (1985) defined the axes of their Two-Factor Structure of Affect according to dimensions of arousal to sleepiness and pleasantness to unpleasantness, leading thereafter to their PANAS Scales (Watson et al. 1988). Feldman Barrett and Russell (1998); Russell and Feldman Barrett (1999) constructed dimensions of activation to deactivation and pleasant to unpleasant within their Schematic Structure of Affect. Psychology employs various tools, including subjective, behavioral, and physiological measures, to grasp emotions quantitatively. The subjective experience of the emotional state is typically examined using closed-question surveys in written form. Examples are the PANAS Scales (Watson et al. 1988) and the modified Differential Emotions Scale (mDES; Fredrickson et al. 2003). Research on measuring the behavioral component of emotion focuses mostly on (1) the analysis of facial expressions, using, for example, the Facial Affect Scoring Technique (FAST; Ekman et al. 1971), the Facial Action Coding System (FACS; Ekman and Friesen 1978), and the Special Affect Coding System (SPAFF; Gottman and Krokoff 1989); (2) the analysis of amplitude and pitch of voice (Kappas et al. 1991; Cowie and Cornelius 2003; Bachorowski and Owren 1995; Russell et al. 2003); and (3) the coding of body posture and gesture (Coulson 2004; Dael et al. 2012). With respect to physiological measurements of emotion, a great amount of work has been done to attempt to decode either physiological responses of distinct emotions (such as fear and anger) or physiological responses that can be sorted along dimensions of arousal and valence. For a decent overview of relevant experiments conducted in psychology, the measurement tools used, and the reasoning for either approach, we suggest reading the reviews of the measurement of emotion by Levenson (2014) and Mauss and Robinson (2009). In his Emotion Specificity Hypothesis, Levenson (2003) presents unique and distinct profiles of physiological responses based on changes
123
J Intell Manuf
in the autonomic nervous system (ANS). He proposes a variety of distinct “visible ANS-mediated changes in emotion” (Levenson 2003, 2014). Several other studies support this approach to measuring the autonomic specificity of emotion (Ax 1953; Stemmler 1989; Christie and Friedman 2004; Stemmler et al. 2001; Ekman et al. 1983). Shiota et al. (2011) proposed providing “evidence of differences in autonomic nervous system responding associated with multiple positive emotions, such as enthusiasm, love (attachment), love (nurturant), and awe.” However, the field of psychology has not reached a consensus concerning the general idea of distinct emotions being actually measurable. A meta-analysis of the psychophysiology of emotion involving 22 measures across almost two dozen studies could not confirm the distinct emotion measurement results described above (Cacioppo et al. 2000). In accordance with Cacioppo et al. (2000), Mauss and Robinson (2009) proposed “that measures of emotional responding appear to be structured along dimensions (e.g., valence, arousal) rather than distinct emotional states (e.g. sadness, fear, anger)” and that “different measures of emotion appear sensitive to different dimensional aspects of state (e.g., facial EMG is sensitive to valence, whereas skin conductance is sensitive to arousal)”. Currently, psychology still measures physiological changes due to ANS activation to decode emotions—although scholars still debate whether emotions are in fact distinctly or dimensionally measureable. Consequently, psychology has not been able to derive a universal and reliable concept of interpretation of physiological measures relating to emotion. Psychology also takes various approaches to describing and chronologically arranging the cause–effect relation between the emotion stimulus, the physiological response, and the experience of emotion. Among these approaches are the James–Lange theory (James 1884; Lange and Kurella 1887), the Cannon–Bard theory (Cannon 1927), the Schachter–Singer theory (Schachter and Singer 1962), and the Opponent–Process theory (Solomon and Corbit 1974). A forthcoming generation of neuroscientists might contribute to this fundamental question by contributing insights into the biochemical origin of emotion. Neuroscience approaches emotions by focusing primarily on changes in brain activity and on the (re)active interplay between the brain and the body. In this sense, emotions are expressed through physiological changes within the brain and body (Purves 2012; Bear et al. 2007). Damasio, one of the leading neuroscientists specializing in emotion, characterizes emotion as “a collection of changes in a body state connected to particular mental images [thoughts] that have activated a specific brain system” (Damasio 1994). Emotions are thought be a product of cerebral circuits rather than solely the functioning of one distinct area (Gray 1982; LeDoux 2000; Panksepp 1998). However, some brain regions seem to have major importance in specific (emotion) processes. The limbic system, which consists
123
of the hippocampal formation, the septal area, the amygdala, the prefrontal cortex, and the cingulate gyrus, among others, is thought to be essential in the experience and expression of emotions (Siegel and Sapru 2006; Krebs 2011; Purves 2012). For instance, the amygdala is believed to play a central role in fear response (LeDoux 2003; Whalen et al. 2001), whereas the subgenual anterior cingulate cortex is thought to be important in instances of sadness (Beauregard et al. 1998; Reiman et al. 1997). The striatal system is believed to take central part in events of happiness (Davidson and Irwin 1999; Lane et al. 1999), as it is part of the reward system (Schultz 2000; Friston et al. 2004; Gottfried 2011). The prefrontal cortex is thought to be involved in the process of regulating emotions (Goldin et al. 2008; Ochsner and Gross 2005). It should be noted, though, that there is also an ongoing discussion in neuroscience concerning the measurability of distinct emotions. Some argue for the dimensional approach (Gerber et al. 2008). Psychology and neuroscience agree that emotions include physiological components in the form of (measureable) somatic responses due to activation of the autonomic nervous system. Neither community has yet succeeded in delivering a universally accepted model to describe the nature and physiological characteristics of emotions. Still, both inside-out and outside-in approaches used in neuroscience and psychology are valid and contribute to the quest to model the nature and functioning of emotion. In our engineering context, the setup of psychology and neuroscience experiments as characteristically “white-box scenarios” are questionable in terms of validity for practical implementation and contextual fit. Engineering is particularly dependent on specific contexts and situations. Thus, when conducing engineering research involving emotions, the necessary in situ nature of experiments becomes a challenge (“Physiology sensor use in engineering and engineering design science experiments and its (future) challenges” section). The common and critical foundation lies in acknowledging and understanding the complexity of how the autonomic nervous system functions (“The autonomic nervous system and its regulation of the body” section). Only this fundamental knowledge allows us to engage in interpreting physiological responses in terms of emotions and related behaviors. The next section provides an overview of the ANS and the related measurement sensors and techniques.
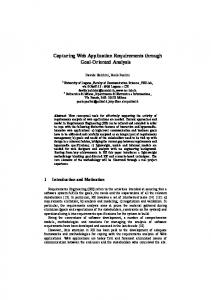
The autonomic nervous system and its regulation of the body The nervous system of the human body consists of the central nervous system (CNS), including the brain and spinal cord, and the peripheral nervous system (PNS; see Fig. 1), which connects the CNS to the rest of the body. The PNS
J Intell Manuf
Fig. 1 The central nervous system (CNS) and the peripheral nervous system (PNS) (SNS somatic nervous system, ANS autonomic nervous system, symp. sympathetic, parasymp. parasympathetic)
sends sensory information to be processed within the brain to the CNS via afferent nerve fibers and conducts “order messages” from the brain through efferent nerves to skeletal muscles and organs in the body (Purves 2012; Kumar et al. 2012; Tortora and Grabowski 2002). The PNS consists of the somatic nervous system (SNS) and the autonomic nervous system (ANS). The somatic part of the PNS conveys sensations of touch, pressure, pain, and temperature, as well as visual, auditory, gustatory, and olfactory sensory inputs, to the brain. The SNS also regulates voluntary control of body movement via contraction of skeletal muscles, leading to movement and changes in posture (Martini 2007; Noback et al. 2005). The autonomic nervous system (ANS) maintains somatic homeostasis and regulates visceral activity, such as the heart rate, digestion, respiratory rate, salivation, perspiration, pupil diameter, micturition, and sexual arousal (Rhoades and Bell 2012; Jaenig 2006; Brodal 2010). Characteristically, these impulses often do not reach our consciousness. The ANS delivers internal sensory stimuli from the blood vessels, thorax, abdomen, and pelvis to the brain and controls, based on the brain’s “order messages” via the efferent pathway, glands, cardiac muscles, and smooth muscles (Saladin 2008). The latter are found in the blood vessels, gastrointestinal tract, respiratory tract, urinary bladder, female and male reproductive tracts, and iris and ciliary body of the eye, as well as in the arrector pilorum in the skin, where they produce the phenomenon of erected hair (colloquially known as goose bumps) (Seifter et al. 2005; Sembulingam and Sembulingam 2012). The ANS consists of two major systems: the sympathetic and parasympathetic systems (Loewy and Spyer 1990; Saladin 2008). The sympathetic system recruits the body’s resources to address periods of exertion, stress, or emergency during so-called “fight or flight” states. Conversely, the parasympathetic system is dominant under resting conditions and states of relative quiescence. In these periods of “rest and digest,” the body conserves and stores energy (Rhoades and Bell 2012; Purves 2012; Kumar et al. 2012; Brodal 2010; Noback et al. 2005; Siegel and Sapru 2006). The sympathetic and parasympathetic innervations exclude each other and function in the manner of a volume control in either direction. The gastrointestinal system, for example,
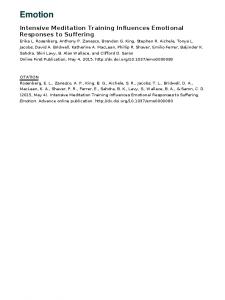
controls digestive activity via the regulation of blood flow to the intestines. In threatening situations, the “rest and digest” response is overridden by the “fight or flight” response. The sympathetic system diverts blood flow away from the gastrointestinal tract and pumps it toward the skeletal muscles to respond to the threat. In nonthreatening situations, blood flows back from the skeletal muscles to the intestines, and digestion can take place. Equally important, the heart pumps harder and faster during “fight or flight” mode. The heart pushes more blood out to supply the skeletal muscles with more “fuel” for higher performance. The heart reduces its output, beating more softly and less often, in “rest and digest” mode because less blood is needed when skeletal muscles are less active. Both the sympathetic and parasympathetic systems also act on the gland system. The sympathetic pathway activates sweat glands in our skin to secrete sweat to cool down the body to achieve greater and faster movement in threatening situations, whereas the parasympathetic system stimulates saliva glands to aid in the digestion process in nonthreatening situations. The sensory input of an internal and/or external stimulus (including an emotional trigger) is delivered to and processed by the brain. The brain sends “order messages” via sympathetic or parasympathetic nerve fibers to specific body parts to respond adequately to the stimulus. The functional differences of the efferent neurons and target tissues within this system are very diverse; only a few examples were described above. A specific “package” of physiological changes that occur in response to a stimulus expresses a specific emotion. The emotion of “anxiety,” for example, is expressed by physiological changes that include an increase in heart rate, shortness of breath, dizziness, “hot and cold” flashes, nausea-related symptoms, trembling, tensed “frozen” muscles, and dry mouth (Hering 2001; Clark and Beck 2011). In other words, an emotion expresses itself in the form of physiological changes. Emotions are thus quantifiable through technology. Physiological changes that express emotions constitute energy in motion and can thus be measured using various physiological sensors. In the next section, we take a closer look at the physiological mechanisms of specific body parts and the respective tools for measuring these mechanisms. The heart, its bloodflow, and corresponding measurement sensors All blood from the body enters the right atrium of the heart via two large veins: the anterior vena cava (blood from the upper body) and the posterior vena cava (blood from the lower body; see Fig. 2). Once this atrium is filled, the atrium contracts and pushes the blood through the atrioventricular valve into the right ventricle, which contracts after being filled. The blood is pushed through the pulmonary valve into
123
J Intell Manuf
Fig. 2 Anatomy of the heart (SA sinoatrial, AV atrioventricular)
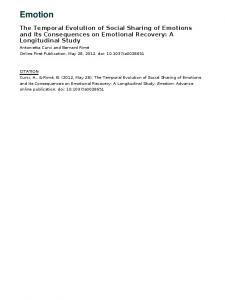
the pulmonary artery, from where the blood passes on to the lungs to absorb oxygen. Oxygenated blood leaves the lungs and runs across the pulmonary veins into the left atrium. This atrium contracts, pushing the blood through the atrioventricular valve into the left ventricle. Immediately upon being filled, the left ventricle contracts and pushes blood through the aortic valve into the aorta, from where the blood is finally sent to the rest of the body. As soon as the body’s muscles and organs absorb oxygen from the blood, the deoxygenated blood returns to the heart via the vena cava, and the cardiovascular cycle continues. In fact, filling and contraction of the heart’s right and left sides occur simultaneously. This means that the right and left ventricles fill up at the same time during so-called “diastole” and then contract at the same time during “systole,” sending blood to the lungs and to the body (Ingels et al. 1996; Sherwood 2012; Rhoades and Bell 2012; Sircar 2008; Kumar et al. 2012). Contraction of the heart is accomplished by the activation of cardiac muscle cells within the atria and ventricles. All muscle cells within the atria and ventricles are electrically connected. When an action potential (a localized change in the electrical potential) is generated by the heart’s own pacemaker, the sinoatrial (SA) node, the signal travels across the muscle cells of the right atrium and causes contraction. The atrioventricular (AV) node slows down the signal to ensure the full contraction and emptying of the atria and sends the impulse further via purkinje Fig. 3 Electrocardiography (ECG)
123
fibers (special fibers embedded in the lower cardiac walls) throughout the ventricles, from where the blood flows to the lungs and to the rest of the body (Courneya and Parker 2011; Kumar et al. 2012). These changes in the heart’s electrical potential can be measured using electrodes placed on the body’s surface and can be recorded over time. Electrocardiography (ECG) measures the electrical potential difference between two electrodes caused by cardiac potential differences (and current flows) with amplitudes up to 10 mV (Bronzino 2000; Macfarlane et al. 2010). The simplest version of ECG equipment (sufficient for qualitative evaluation in in situ engineering experiments) consists of three electrodes—positive (+), negative (−), and neutral (N)—attached to the body surface, as shown in Fig. 3. Because, by definition, current flows from high potential (+) to low potential (−), the electrodes are oriented in the direction of the cardiac current flow. A neutral electrode is needed to set a baseline that can be used to “delete” other electrical signals detectable on the body surface, such as those from the brain (measuring tool: electroencephalography, EEG), the gastrointestinal tract (measuring tool: electrogastrography, EGG), nerve potentials (measuring tool: electroneurography, ENG), and skeletal muscles (measuring tool: electromyography, EMG) (Macfarlane et al. 2010). Switching the high (+) and low (−) potential electrodes leads in this application arrangement to a negative output reading. A steadily recurring pattern is measured to monitor the electrical functioning of the heart. The P wave represents the depolarization of the atria. The SA node sends a signal through the muscles in the atria, resulting in their contraction. The QRS complex (the combination of Q, R, and S waves) represents the depolarization and therefore the contraction of the ventricles. This effect is significantly stronger than that of the P wave because the ventricles are significantly larger than the atria. Thus, when the cells in the ventricles depolarize, the depolarization has a much greater effect on the ECG signal. The subsequent T wave represents the repolarization of the ventricles (Gacek and Pedrycz 2011; Roberts 1986; Tortora and Grabowski 2002). Incidentally, the typical “lub–dup” heart sounds represent turbulence created by the rapid closure
J Intell Manuf
of the cardiac valves. The first (S1) sound is associated with the atrioventricular valves, whereas the second (S2) sound is associated with the semilunar (aortic and pulmonary) valves (Tilley 2006; Williams and Wilkins 2010). An ECG only provides information about the electrical activity of the heart; it provides no information about the heart’s mechanical activity or the amount of cardiac ejection (stroke volume). An ECG allows the detection of electrocardiac activity, particularly R peaks, and based on these signals, the heart rate can be determined. Reacting to internal or external triggers (particularly emotional stimuli), the sympathetic and parasympathetic systems have the ability to adapt the heart rhythm to a specific situation. Baroreceptors in the vascular walls measure pressure from arterial blood flow and facilitate feedback to the brain, which compares the actual physiological condition with the demand. In the case of parasympathetic response, the brain sends the neurotransmitter acetylcholine (ACh) to the SA node. This leads to a decrease in the SA node firing rate and a slower transmission velocity of the signal from the SA node to the AV node and to the ventricles. In contrast, in situations of anxiety, stress, or physical exertion, sympathetic intervention results in the neurotransmitter norepinephrine (NE) being sent to the SA node. In response, faster firing, a higher transmission velocity throughout the heart, and an increase in contractile strength, with resultant higher stroke volume, all occur. Pulse, blood pressure, and their measurement tools Rhythmic blood waves are sent out from the left ventricle of the heart and flow via arteries to muscles and organs. Despite this pulsating bloodstream, caused by the rhythmic contraction of the heart, the blood flows relatively steadily throughout the body and supplies muscles and organs continuously (the Windkessel effect; Khurana 2008; Thiriet 2007). The (peripheral) pulse can be measured manually by sensing the periodically rapid expansion of the arterial vessel wall by palpation with finger tips on a peripheral artery, such as the radial artery, brachial artery, femoral artery, common carotid artery, or dorsalis pedis artery (Cooper and Gosnell 2014). Three factors can be deduced from this measurement: (1) the pulse frequency, which is the number of impulses per minute; (2) the pulse rhythm, which is the cadence of the pulsation, including spaces between pulses; and (3) the pulse quality, i.e., the strength of the pulse, which varies based on the amount of blood leaving the heart (the stroke volume) and is roughly categorized as thready, weak, normal, or bounding (O’Sullivan et al. 2013). The pulse cadence is highly dependent on the heart rhythm and changes with sympathetic and parasympathetic innervation of the heart muscles, in response to external and internal stimuli. In addition to the innervation of the heart, the autonomic nervous system has control over the smooth muscles in the vascular walls. The release of nora-
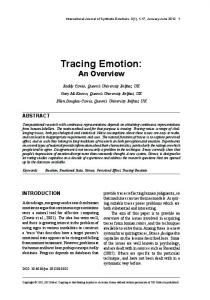
drenaline and adrenaline from sympathetic nerve fiber ends in response to an arousal stimulus causes vasoconstriction of superficial blood vessels and vasodilation of peripheral blood vessels, which supply the skeletal muscles. Blood is withdrawn from the skin tissue and pushed toward the skeletal muscles in “fight or flight” mode. An inhibition of the sympathetic innervation leads to a relaxation of the vessel walls. The parasympathetic system has no significant impact on the arterial system (Sherwood 2012; Brown et al. 2006). A pulse oximeter (see Fig. 4) is a noninvasive measurement sensor used to determine blood oxygen saturation and pulse frequency, most commonly via a finger clip or ear clip (transmission measurement) or by attachment to the forehead (reflection measurement; Webster 1997; Irwin and Rippe 2008). Two light-emitting diodes (LEDs) send red and infrared light through tissue, and these types of light are detected by a photo sensor. The measurement methodology is based on the principle that hemoglobin, the oxygen transporter in the blood, absorbs light of particular wavelengths differently because of its oxygen-dependent coloring (the more oxygen the blood contains, the brighter red the blood appears). Oxygenated hemoglobin absorbs more infrared light (in the wavelength band of 850–1000 nm) and lets red light pass, whereas deoxygenated hemoglobin absorbs more red light (in the wavelength band of 600–750 nm) and lets infrared light pass (Webster 1997). The photo sensor detects the different light intensities, and the pulse oximeter relates these values to oxygen saturation (SpO2 ). The SpO2 value, which indicates the proportion of oxygenated hemoglobin in the blood, normally varies between 97 and 100 % (Pinsky et al. 2009; Dorsch 2012; Irwin and Rippe 2008). Potential hypoxia (oxygen deprivation), caused by pathological issues or extreme exertion of the body, can be detected in this manner. In addition to oxygen saturation, a pulse oximeter can detect pulse waves and pulse frequencies. The method described previously is used to measure the intensity of transmitted or reflected infrared light, which provides information about relative changes in vascular blood volume. Light absorption changes depending on the amount of blood running through an artery. Based on this principle, these pulsations can be detected when blood waves reach the peripheral arteries. A typical pulse waveform consists of a systolic peak followed by a second peak, representing a reflection wave, rebounded from vessel walls and branches (Miller et al. 2014). The peak-to-peak interval between two systolic peaks correlates closely to the R–R interval derived from an ECG signal. The shape of the waveform differs from subject to subject, with the underlying measurement manner (transmission or reflection), and with the measurement location (e.g., finger vs. ear; Webster 1997; Irwin and Rippe 2008). Furthermore, the pattern of the pulse waveform changes with sympathetic and parasympathetic innervations
123
J Intell Manuf Fig. 4 Pulse oximeter
Fig. 5 Blood pressure measurement
of the heart, as well as vascular lumen. The blood volume or the amplitude of a measured finger pulse (see Fig. 4: difference between peak and trough) decreases with stimulation of the sympathetic nervous system, because of (1) an increase in the heart rate and (2) vasoconstriction of blood vessels (Fredrickson and Levenson 1998; Mauss et al. 2005). A flattening of the pulse wave is often associated with stress, anxiety, or pain (Walsh and King 2007). The main sources of error are polished or false finger nails, bright light sources in the surroundings, strong movements or jolts, and blood stasis due to clamping (Webster 1997; Irwin and Rippe 2008). Blood pressure is closely linked to the pulse. The blood stream applies mechanical stress continuously in the form of shear and circumferential strain on vessel walls, particular arteries (because blood pressure in afferent veins is significantly reduced; Safar et al. 2014; Lanzer and Topol 2002; Aiyagari and Gorelick 2010). Blood pressure changes first with changes in the stroke volume and second with contraction or dilation of blood vessels. Vasodilation increases blood flow, because of the decrease in resistance, and decreases blood pressure, whereas blood vessel contraction decreases blood flow, because of the increase in resistance. Blood pressure can change from moment to moment with changes in posture, exercise, stress, or relaxation (Klabunde 2011). Stress and physical activity increase blood pressure, based on sympathetic regulation of heart output (making the heart beat faster and harder), while physical and mental quiescence reduce blood pressure by means of parasympathetic intervention. Two major types of noninvasive physiological measurement techniques exist: manual auscultatory and digital
123
oscillometric techniques (see Fig. 5; Irwin and Rippe 2008; Iaizzo 2009). Blood pressure is characteristically recorded and described as a value pair, the first being the (higher) systolic number and the second being the (lower) diastolic number (Khurana 2005; Porth 2011; Irwin and Rippe 2008). Normal blood pressure is commonly defined as 120/80 mmHg (millimeters of mercury, derived from the earlier practice of measuring blood pressures with mercury barometers). Because these techniques only allow comparisons of blood pressure values at two points in time during a potential experiment and consequently do not allow continuous monitoring of blood pressure, they are of minor importance for our purposes. Respiratory system and its measurement tools The heart sends blood via the pulmonary artery to the lungs, where small balloon-like structures expand and contract with inhaled and exhaled air (Sherwood 2012; Irwin and Rippe 2008; Rhoades and Bell 2012). These alveoli structures are surrounded by a net of very thin blood vessels (the capillary bed). When air is breathed in, oxygen flows into the alveoli, from where it is taken up via the capillary bed into the bloodstream. Oxygen, in combination with glucose, is needed primarily for cell metabolism and maintenance of cell life. In addition, carbon dioxide, which is the waste product of the body’s metabolism, is transported via the pulmonary veins and capillary beds to the alveoli and is exhaled from the body. The main homeostatic function of breathing is to regulate the partial pressures of O2 and CO2 and the pH of the arterial blood (Squire 2013; Faller and Schuenke 2011).
J Intell Manuf Fig. 6 Respiratory (temperature) transducer
A decrease in the partial pressure of O2 and in pH and an increase in the partial pressure of CO2 stimulate breathing, whereas an increase in the partial pressure of O2 and in pH and a decrease in the partial pressure of CO2 lower breathing. The breathing rate is the second “clock” of the body, in addition to the heart rate. To maintain somatic homeostasis, the heart and breathing rates are adjusted to supply cells with adequate amounts of oxygen and nutrients in response to changes in the momentary demand. In fact, the two mechanisms are correlated to a great extent: the heart beats faster during inspiration and slower during expiration (see respiratory sinus arrhythmia; Conover 2004; Rhoades and Bell 2012). Whereas the heart rate and its adjustment via the autonomic nervous system remain outside of direct (voluntary) control, breathing is a physical function that is both involuntary and voluntary. For example, the breathing rate changes involuntarily with an augmented level of exertion to supply muscle cells with more oxygen. Beyond this involuntary dimension, certain voluntary breathing techniques affect the heart rate and achieve relaxation. In “fight or flight” situations caused by emotional or physical arousal, the sympathetic system stimulates breathing and influences (1) the rate of breathing, (2) the regularity of breathing, (3) the depth of breathing, and (4) the time between exhalation and inhalation (Chaitow et al. 2014; Carter 2007). Calm and positive emotions, in contrast, cause a lower breathing rate, a more regular breathing pattern, and characteristically, a longer exhalation time than inhalation time. One way to measure the breathing rate is by means of a respiratory transducer, which is a piezoelectric device integrated into a chest belt. The correct placement of the belt, directly underneath the armpits and “slightly tight at the point of maximal expiration” is crucial because of the maximum circumference. The inner charge of the piezoelectric crystal is balanced until traction or compression changes this electrical balance, depending on the variation in the circumference of the thorax. The resulting voltage is measured. A characteristic output of this signal (depicted in Fig. 6) includes the repeating pattern of inhalation, inspiratory pause time, expiration time, and expiratory pause time (Stern et al. 2000; Chan 2008; Edmonds and Tenenbaum 2011). The alteration of this pattern due to sympathetic or parasympathetic inner-
vation can be described by means of changes in the breathing rate, regularity, depth (amplitude), and pause time. A temperature transducer provides a complementary mechanism for measuring the breathing pattern. This sensor consists of a thermocouple (two twisted wires of two metals with different Seebeck constants) that is placed just underneath the nostrils (the subject is asked to breathe only through the nose). The inhalation of cold air and exhalation of warmed air through the nostrils causes a temperaturedependent thermovoltage in the thermocouple (due to the underlying “Seebeck effect”). Body temperature, sweat glands, and their measurement tools The regulation of the body’s core temperature at a constant level of approximately 37 ◦ C is crucial because most lifedependent metabolic processes are very sensitive to changes in temperature (Stanier et al. 1984; Martini 2007). Two types of thermoreceptors (peripheral and internal) send afferent sensory information to the thermoregulation center in the preoptic area of the hypothalamus, deep inside the brain. Peripheral thermoreceptors in the skin convey information about external temperature conditions, whereas internal central thermoreceptors (directly within the preoptic area of the hypothalamus) detect internal changes in the blood temperature. The hypothalamic thermoregulation center responds with a variety of somatic regulations to keep the core temperature constant at a set-point level. When the body is exposed to a cold environment, thermoreceptors detect the change in temperature (of the skin and blood), and the thermoregulation center innervates with two general responses: (1) reduction of heat loss (tissue insulation) and (2) promotion of heat gain (increase in metabolic rate; Goldstein 2008). To conserve warmth, the blood flow close to the body surface is reduced by arterial vessel constriction. This sympathetic (cold) stress response is activated via the release of adrenaline from the adrenal glands (Goldstein 2008). Because of the constricted blood flow to the skin surface, the face, hands, and feet become pale and cold. To promote heat gain, the body relies on the secretion of hormones (thyroid and epinephrine), which increase the basal metabolic rate (BMR). Additionally,
123
J Intell Manuf
the shivering center in the hypothalamus stimulates involuntary muscle contraction (trembling) for heat production via the brain stem motor center (Storey 2005; Khurana 2008). In contrast, when the body is surrounded by external heat (heat stress), the somatic temperature rises, and skin receptors and internal thermoreceptors relay this information to the thermoregulation center, which responds (in an inverse manner to the cold response) with (1) reduction of heat production and (2) promotion of heat loss. To reduce heat gain, the activity of the sympathetic nervous system is significantly reduced, resulting in the inhibition of the release of “metabolic process hormones”. Simultaneously, vasoconstriction of superficial blood vessels is suppressed. Blood is pumped to skin tissue (turning the face red) to cool down. When a certain threshold is reached, cholinergic sympathetic fibers release the neurotransmitter acetylcholine (Ach) and stimulate sweat glands (Siegel and Sapru 2006; Goldstein 2008). In addition to these adaptations based on external changes, the body temperature varies due to voluntary behavior such as exercising, which can heat the body up to 40 ◦ C, and resting, which reduces the somatic temperature, because less muscle heat is produced (Secher and Volianitis 2009). Emotions have an impact on the body temperature caused by the innervation of the sympathetic system, causing hormonal effects and increased muscle tension that result in heat production (Dreeben 2006; Coon and Mitterer 2008; Uys 1999). The increase in body temperature that can result from emotional disturbance, such as intense rage or excitement, can be up to 2 ◦ C (Khurana 2005). In fact, the temperaturerelated “cold stress” symptoms described above—turning pale, trembling, having hot and cold flashes, and sweating— can commonly be observed in states of anxiety. “Positive stress” activates beneficial somatic functions that increase our performance, whereas “negative stress” or anxiety puts the body in “frozen” survival mode, drawing away peripheral blood to maintain basic functioning of inner vital organs (Goldstein 2008). The fingertip is optimal for monitoring temperature changes, since this area is supplied with blood via arterioles (the smallest blood vessels), which underlie solely sympathetic regulation. Studies show that a decrease in skin temperature is correlated with negative emotion (e.g. sadness, disgust, fear) and that an increase in skin temperature is correlated with excitement and anger (Ekman 1993; Philippot and Feldman 2004). The slow onset and small magnitudes of temperature changes (1◦ C–2◦ C) and their high sensitivity to external factors, such as room temperature, are disadvantages to using skin temperature to assess emotion. One way to detect changes in temperature is with the aid of an electronic thermometer. An integrated semiconductor changes its resistance based on the body temperature. This resistance is measured via a Wheatstone bridge and is associated with a corresponding temperature. The relation between resistance and temperature is approximately linear in the nar-
123
row range of body temperatures (Klaassen 1996; Northrop 2014). Alternatively, an infrared thermometer can be used to measure the electromagnetic radiation (infrared light) of the human body, which varies with its temperature (the warmer the body is, the shorter the wavelength is). Although the body tries to maintain its set-point level at approximately 37 ◦ C, the somatic temperature varies during the day; it is lower in the morning and rises throughout the day. Moreover, the measurement location (mouth vs. armpit vs. ear, for example) influences the result significantly (Carter 2007; Sherwood 2012). Sweat glands are activated by thermal and emotional stimuli and are crucial for the thermoregulation of the body. Their function is to secrete fluid, which evaporates on the body’s surface and cools it down. Two main types of sweat glands are found in the body: eccrine and apocrine sweat glands (Freinkel and Woodley 2001; Krstic 1991; Singh 2008). Eccrine sweat glands are widely distributed throughout the body but are primarily located on the forehead, the palms of the hands, and the soles of the feet. They secrete a watery fluid and electrolytes when they are stimulated by the release of a cholinergic neurotransmitter by the sympathetic nervous system. Apocrine sweat glands, on the other hand, are mainly prevalent in the axillae. When stimulated by adrenergic nerve fibers, they secrete a milky fluid, which combines with dermal bacteria to produce the characteristic odor of sweat (Krstic 1991; Singh 2008). In response to a threatening stimulus, the sympathetic autonomic nervous system activates sweat glands (either via cholinergic or adrenergic excitation), and they secrete their corresponding fluids. This moisture increases the conductance of the skin tissue. The measurement sensor for galvanic skin response (GSR) captures this variation in skin conductance. In situations involving physical exertion and/or emotional arousal and enhanced dermal moisture as a response, decreased electrical resistance (and increased electrical conductance) is detected. A GSR sensor has two electrodes, most commonly attached to either the medial phalanx of the index and middle fingers or to the big toes, because these areas are thought to be most sensitive to the arousal response. A small voltage (e.g. 0.5 V) is applied to the electrodes, their resistance is measured via a Wheatstone bridge (see Fig. 7), and the conductance is determined from their reciprocal relation (Kim and Suh 2007). Zero resistance corresponds to infinite conductance. A characteristic (stochastic) GSR signal is depicted in Fig. 7. The units of conductance are microsiemens, and the typical amplitude range is 0.2–1 µS. Dry skin produces high resistance and low conductance, whereas moist skin produces low resistance and high conductance. The greater the (physical and/or emotional) arousal is, the more moisture is produced, and the higher the conductance response is. Thus, to detect changes in GSR due to emotional stimuli, the mea-
J Intell Manuf Fig. 7 Galvanic skin response (GSR)
surement is only valid under very controlled static physical conditions. At this stage, a stimulus is only accepted as “valid and significant” within a delay window of 0.8–4 s; slower responses (>4 s) are not interpreted as being related to the stimulus and must be excluded from the analysis (Dawson et al. 2007). The GSR tool is very sensitive to physiological exertion and does allow the measurement of arousal level, but it may not be able to distinguish between positive and negative arousal states. Muscle tension and its measurement tools Oxygen is taken up from the blood within the lungs and carried to the muscles, where a portion is used directly for energy production. The remainder is stored in myoglobin (Scanlon and Sanders 2010; Shaw 2005; Khurana 2008). Muscle cells, also called muscle fibers, need oxygen to produce the cellular energy molecule adenosine triphosphate (ATP) that empowers muscle cells to contract (cellular respiration). All skeletal muscle groups are attached to bones in such a way that a contraction of the muscle fibers leads to the desired movement of the corresponding bone. During exercise, for example, muscles work harder and consequently require more oxygen. Not only during these intrinsic movements but also in response to external threats do the muscles in the body tense up, preparing for “fight or flight”. At this stage, more oxygen must be supplied to the muscles, resulting in increases in the heart and breathing rates. The increase in muscular activity is facilitated by increased local blood flow, the movement of blood circulating in the inner organs to the skeletal muscles, increased cardiac output, increases in the breathing rate
and breathing intensity, and an increase in unloading of oxygen from hemoglobin (the oxygen transporter in the blood; Rhoades and Bell 2012; Whittemore 2009; Sherwood 2012). Motor neurons, which are activated by the motor cortex in the brain, stimulate the targeted muscle fibers and cause them to contract. The contraction generated by electrical impulses within the muscle cells can be measured by electromyography (EMG) electrodes (Merletti and Parker 2004; Duffy 2008). The noninvasive version of the EMG method uses electrodes that are attached to the body surface directly on the examined muscle. As in the EEG setup, the current difference between the (+) and (−) potential electrodes is measured, while a neutral electrode, placed on electrically unrelated tissue, is used for baseline definition. The exact placement of the electrodes is highly dependent on the anatomical characteristics of the observed muscle unit, including the muscle size, muscle plane, and muscle fixation points. The signal obtained must be enhanced using an amplifier. The resulting output record (electromyogram) indicates a stochastic signal in the range of 0–10 mV (similar to the ECG voltage range). Relaxed muscles show no electrical activity, while small contractions lead to an electrical potential that increases with stronger muscle movement (Fig. 8). A second method used to detect muscle activity and movement (indirectly) is by means of a three-dimensional (3-D) accelerometer belt. This system measures the magnitude and direction of proper acceleration in the x, y, and z planes. In post-processing, it is even possible to create algorithms for recognition of specific motion patterns. The best placement for the belt is at the most lateral position of the
Fig. 8 Electromyography (EMG)
123
J Intell Manuf
et al. 2008). Eye tracking devices combine a capturing camera module with infrared light to generate serial pictures with dark pupils and high contrast to the iris. The eye tracking software used with such devices includes an algorithm to measure pupil size (Bradley et al. 2008).
Brain activity and its measurement tools Fig. 9 Pupillary response
waist, closest to the center of mass and tightly attached to the body, to reduce the angles of freedom (Boerema et al. 2014). A third and equally indirect method of measuring movement involves the use of pressure sensors placed on the surface of the skin, for example under the foot soles or on the backside. This method can be used if the subject maintains a particular suitable position during the experiment, such as being seated while driving a car. Movements can be deduced from changes in the measured pressure values. Pupillary response and its measurement tools The pupil size has been shown to change with age, the level of retinal illumination, pupil adaptation based on near and distance vision (the near effect), and emotional arousal (see Fig. 9). The mechanism of widening and contraction of the pupil is controlled by the autonomic nervous system, which innervates two different muscles. The dilator pupillae muscle is a radial (smooth) muscle in the iris. When exposed to a threatening stimulus, the sympathetic system response leads to pupillary dilation, temporarily letting more light reach the iris. In contrast, parasympathetic innervation leads to pupillary constriction by activating a circular muscle that surrounds the pupil, called the sphincter pupillae (Roberts 1986; Keshav and Bailey 2012; Robertson and Biaggioni 2012; Bolis et al. 2002; Rosenberg 2008; Purves 2012). Complementary studies also suggest a task-evoked pupillary response (TEPR): in states of high workload, as in recollection of memory or intense concentration, the pupils dilate slightly and then return to their initial sizes (Klingner Fig. 10 Electroencephalography (EEG)
123
Twenty percent of the cardiac output (in the standing position) is sent to the brain (Khurana 2008), where it supplies cells with nutrients, especially oxygen and glucose for cellular energy production. Increased neuronal activity leads to increased local cerebral blood flow (Benarroch 2006; Squire 2013). Functional magnetic resonance imaging (fMRI) uses this physiological mechanism to measure local brain activity. Stimulated by the fMRI scanner, oxygenated and deoxygenated blood have different tendencies to magnetize. An (increased) activation of one brain area causes more oxygenated blood to be carried to this area, which changes the transversal relaxation time of hydrogen nuclear spin and results in signal change (Sartor and Stippich 2007). This change in signal is represented by the brain part being “alighted” in an fMRI image. Knowledge of the topography of brain parts and their functions is used together with knowledge about the interconnection of brain parts and their cause–effect relations to deduce the mental activity executed. The machine set-up only allows experimental “white room” conditions, with very low levels of freedom regarding body movement and metallic items such as additional measurement tools, which limits the applicability of this technique to in situ engineering experiments. fMRI has a very high spatial resolution (in the millimeter range) but low temporal resolution (in the second range; Cohen and Sweet 2010; Stemmer and Whitaker 2008). In contrast to fMRI, electroencephalography (EEG; see Fig. 10) has high temporal resolution (in the millisecond range) and low spatial resolution (in the centimeter range). EEG is a measurement technique used to detect electrical brain activity from the scalp structure via attached electrodes. The activation of neurons (brain cells) causes local current flow. An EEG signal is the sum of activity of all
J Intell Manuf
neurons in close vicinity. Only a proportionally large population of simultaneously firing neurons is sufficient to generate electrical activity recordable on the head surface (Niedermeyer and Lopes da Silva 2005). A characteristic EEG pattern can range between 0.5 and 100 µV (Fred et al. 2008), which is ten times lower than the ECG signal range. The common standardization for electrode positioning is the ten–twenty electrode placement system (Jasper 1958), which involves the placement of a cap with integrated electrodes on the scalp. Prominent skull landmarks (nasion, both preauricular points, and inion) are used for reference for accurate cap placement (Tyner and Knott 1983). The electrodes have holes through which conductive paste can be injected with a syringe to enhance electrical signal conductivity. The basic principle of EEG involves detecting and recording changes in neuronal (electrical) activity between the (+) potential signal electrode and its corresponding (−) potential electrode. Again, a ground electrode is needed to establish a reference level. The electrodes of the ten– twenty electrode system are gated and related to each other in such a way that the desired signal outcome is produced. As ground electrode position serves generally either the forehead (Fpz) or an ear location (Yamada and Meng 2012). The electrical signals detected by the EEG electrodes are amplified, converted from analog to digital, and finally filtered for analysis purposes. Using Fourier transformation to generate the EEG power spectrum, five levels of frequency ranges are commonly distinguished in the final brain activity analysis. Delta and theta waves usually appear to occur in unconscious states during deep sleep phases. Alpha waves are thought to represent states of conscious but relaxed brain activity with closed eyes. As soon as the eyes open or brain activity increases due to cognitive processes such as easy math calculation, beta waves ensue, which range up to concentrated thinking and states of high mental effort (Niedermeyer and Lopes da Silva 2005; Lee and Niederer 2010). Gamma waves are supposed to be associated with (sensory) perception and represent “binding of different populations of neurons together into a network for the purpose of carrying out a certain cognitive or motor function” (Singh 2014). All electrodes are situated within the range of efficacy for distinct functional brain areas. Electrode F7, for instance, is positioned near the assumed center of rational activities, while F8, T3, and T4 suppose to screen emotional impulses and processes. Electrode Fz intents to cover the intentional and motivational center, along with electrodes C3, C4, and Cz, close to the sensory and motor center. Potential areas of perception and differentiation are monitored by electrodes P3, P4, and Pz. Electrodes T5 and T6 are positioned close to the memory function area, and electrodes O1 and O2 are close to the primary visual area (Nuwer 1990). The occurrence of different frequencies in different topographic
areas is posit to provide information about the underlying functional brain activities. As noted previously, EEG measurement has high temporal resolution but low spatial resolution. This last section provided insights into the complexity of the ANS. The problem of using emotion in engineering research is more complicated still. Additionally, we have to take the engineering-specific focus on contextuality into account. Before addressing specific engineering experimental challenges (“Physiology sensor use in engineering and engineering design science experiments and its (future) challenges” section), we provide a non-exhaustive overview of related engineering and HCI research.
Overview of current studies using physiology sensors in engineering and human–computer interaction settings The study of physiology-based measurement of emotion reactivity in the field of affective engineering has been gaining traction in recent years. In 2011, the US National Science Foundation (NSF) funded early-stage research projects focused on understanding the fundamentals of this interplay (e.g., NSF grant #1153823: AnalyzeD—Analyzing Engineering Design Activities; Steinert et al. 2012). The intention of these projects has been to provide engineering design sciences and engineering practices with a foundation for addressing the affective engineering problem. In addition, the HCI community conducts various projects and publishes regularly on this subject. Additionally, several engineering research groups have been formed that are starting to push for further integration of the field into engineering and engineering design science, notably at Stanford University, Pennsylvania State University, Concordia University in Canada, and NTNU in Norway. For example the Biometric Simulator Research Lab formed at Stanford University in 2014 seeks to “record eye tracking, facial expression, EEG, and many other biometric data from the driver in sync with input events from the driving session” to improve the understanding of the individual driving experience (Biometric Car Simulator Research Lab 2015). Table 1 presents a non-exhaustive overview of research conducted in this area. The HCI/CHI community in particular has made significant inroads into the subject. However, many of the research results obtained may not be directly transferred to “heavy”/tangible mechanical engineering experiments because of their boundary conditions. HCI experiments are by nature usually limited to a single user-to-computer scenario that is often highly controlled and static.
123
Title and publisher
Exploring the neurological basis of design cognition using brain imaging: Some preliminary results. Design Studies, Volume 30, Issue 6, November 2009, pp. 623–647
Decision-making in engineering—A call for affective engineering dimensions in applied engineering design and design sciences. Proceedings of the 2014 International Conference on Innovative Design and Manufacturing (ICIDM), IEEE, pp. 11–15
Affective man–machine interface: Unveiling human emotions through biosignals. Biomedical Engineering Systems and Technologies, edited by Ana Fred, Joaquim Filipe, and Hugo Gamboa, Communications in Computer and Information Science 52. Springer Berlin Heidelberg, pp. 21–47
Eye activity as a measure of human mental effort in HCI. Proceedings of the 16th International Conference on Intelligent User Interfaces 2011, pp. 315–318
Cardiovascular and eye activity measures as indices for momentary changes in mental effort during simulated flight. Ergonomics 2008; 51(9):1295–319
Measuring emotion: development and application of an instrument to measure emotional responses to products. In Blythe, M., Overbeeke, K., Monk, A.F., Wright, P. (Eds.), Funology: From Usability to Enjoyment. Kluwer Academic Publishers, Dordrecht, pp. 111–123
Classification accuracy from the perspective of the user: Real-time interaction with physiological computing. Proceedings of the 33rd Annual ACM Conference on Human Factors in Computing Systems, pp. 3029–3038
The effect of mental stress on heart rate variability and blood pressure during computer work. European Journal of Applied Physiology, 2004; 92 (1–2):84–89
Emotion recognition using brain activity.Proceedings of the 9th International Conference on Computer Systems and Technologies and Workshop for Ph.D. Students in computing, 2008, p. 6:II.1–6:1
Engineering team performance and emotion: Affective interaction dynamics as indicators of design team performance. Doctoral dissertation, Stanford University
Displayed uncertainty improves driving experience and behavior: The case of range anxiety in an electric car. CHI 2015, April 18–23, 2015, Seoul, Republic of Korea.
A fuzzy psycho-physiological approach to enable the understanding of an engineer’s affect status during CAD activities. Computer-Aided Design, 54:19–38
A fuzzy physiological approach for continuously modeling emotion during interaction with play technologies. International Journal of Human–Computer Studies 65(4):329–347
Analysis of design activities using EEG signals. DETC2010–28477 ASME IDETC–Design Theory and Methodology, Montreal, Quebec, Canada, August 15–18, 2010
Authors
Alexiou et al. (2009)
123
Balters and Steinert (2014)
Broek et al. (2010)
Chen et al. (2011)
De Rivecourt et al. (2008)
Desmet (2003)
Fairclough et al. (2015)
Hjortskov et al. (2004)
Horlings et al. (2008)
Jung (2011)
Jung et al. (2015)
Liu et al. (2014)
Mandryk and Atkins (2007)
Nguyen and Zeng (2010)
Design, electroencephalography, signals
Emotion, affective computing, fun, games, physiology, galvanic skin response, electromyography, heart rate
Affective computing, fuzzy logic, psycho-physiological signals, CAD
Range anxiety, information display, progress bar, trust in automated systems, car, electric vehicle, ambiguity
Not available
EEG, emotion, classification, brain computing
Mental stress, heart rate variability, blood pressure, computer work, rest
Physiological computing, EEG, psychophysiology, tagging media
Not available
Mental workload, mental effort, heart rate, heart rate variability, eye activity, subjective ratings
Mental effort, cognitive load, pupillary response, eye blink, eye movement, adaptive interfaces
Not available
Engineering decision-making, affective engineering, cognitive decision, neuroscience, emotional decision
Design cognition, problem solving, design problems, research methods, cognitive neuroscience
Keywords
Table 1 Publications on use of physiology sensors in engineering settings and especially in human–computer interaction settings
J Intell Manuf
Title and publisher
A theoretical model of design creativity: Nonlinear design dynamics and mental stress–creativity relation. Journal of Integrated Design and Process Science 2012; 16(3):37–60
A physiological study of relationship between designer’s mental effort and mental stress during conceptual design.Computer-Aided Design 54:3–18
Toward computers that recognize and respond to user emotion. IBM Systems Journal 39(3.4):705–719 doi:10.1147/sj.393.0705
Toward machine emotional intelligence: analysis of affective physiological state. IEEE Transactions on Pattern Analysis and Machine Intelligence 23(10), 1175–1191
Heart rate variability: Indicator of user state as an aid to human–computer interaction. Proceedings of the Conference on Human Factors in Computing Systems (CHI 1998), pp. 480–487
Triangulating front-end engineering design activities with physiology data and psychological preferences. International Conference on Engineering Design (ICED) 2013, Aug. 19–22, Seoul, Korea
EAGER: AnalyzeD—Analyzing engineering design activities. NSF Engineering Research and Innovation Conference, sponsored by the National Science Foundation’s Division of Civil, Mechanical and Manufacturing Innovation (CMMI), Boston, MA, USA
Investigating the relation between cognitive load and creativity in the conceptual design process. Proceedings of the Human Factors and Ergonomics Society Annual Meeting 2012; 56(1):308–312
Understanding of emotions and reasoning during consumer tradeoff between function and aesthetics in product design.ASME Proceedings 23rd International Conference on Design Theory and Methodology
Measurable decision making with GSR and pupillary analysis for intelligent user interface. Proceedings of the 33rd Annual ACM Conference on Human Factors in Computing Systems
Authors
Nguyen and Zeng (2012)
Nguyen and Zeng (2014)
Picard (2000)
Picard et al. (2001)
Rowe et al. (1998)
Steinert and Jablokow (2013)
Steinert et al. (2012)
Sun and Yao (2012)
Sylcott et al. (2015)
Zhou et al. (2015)
Table 1 continued
Decision making, GSR, eye-tracking, machine learning
Product design, brain, decision making, networks, testing, magnetic resonance imaging
Not available
Electroencephalography (EEG), cognitive problem solving preference, divergent vs convergent engineering design activities
Physiology sensors, electroencephalography (EEG), cognitive problem solving preference
Heart rate variability, mental effort, user state, air traffic management, airspace complexity, free flight
Emotion recognition, physiological patterns, feature selection, fisher projection, affective computing, emotional intelligence
Not available
Electroencephalography (EEG), mental stress, heart rate variability (HRV), design activity, design creativity
Design creativity, mathematical model, environment based design (EBD), design governing equation, nonlinear dynamics, chaotic dynamics, mental stress
Keywords
J Intell Manuf
123
J Intell Manuf
Physiology sensor use in engineering and engineering design science experiments and its (future) challenges Engineering design science experiments differ from traditional psychology, neuroscience, and cognitive sciences experiments, as engineers are not necessarily looking for universal truths (such as which parts of the brain are responsible for spatial orientation). The task of engineers is to derive quasi-optimal solutions under certain boundary conditions, such as limited time, resources, and manpower. Engineering is completely context dependent by nature. Consequently, engineering experiments ought to be conducted under conditions as close to in situ as possible. Experiments in “heavy” engineering contexts, e.g. machine operations, offshore and marine operations, vehicle operation and other high-stress, high-cortisol events in civilian and military situations, and especially the direct influence of physical activity, increase the level of experimental complexity considerably. Subjects are not statically sitting in a controlled lab and responding only by triggering a mouse or button. Subjects, engineers or users, move, sweat, shout, and behave in other ways that can be difficult to monitor. This, however, forces us to consider the effects of environmental factors, such as dirt, heat, noise, and distress due peer or supervisor pressure, among others. The transfer from a simulated desk-driving experience to a real-life, in situ experiment results in tremendous issues with noise and confounding variables (Steinert et al. 2012). In a driving scenario (Jung et al. 2015) inter-subject and intra-subject data vary tremendously based on factors such as sunshine intensity and resulting heat and light differences, the time of day, and seemingly unrelated factors such as showering or not showering in the morning. These specific in situ considerations do not allow us to conduct very controlled “clean lab experiments”; instead they rather force us to engage in the specific context, experiment, and adapt, especially concerning measurement, analysis, and interpretation of the data. Concerning measurement, a variety of types of sensors and measurement techniques (see Fig. 11), including electrocardiography (ECG), electroencephalography (EEG), electromyography (EMG), pulse oximetry, blood pressure measurements, respiratory transducer, body temperature measurements, and galvanic skin response (GSR) measurements have been presented and described in the preceding sections. The engineering context and institutional review board (IRB) protocols only allow physiological measurements via noninvasive methods. Consequently, a range of medical procedures, such as taking blood samples to analyze hormonal stress levels, are typically excluded. Moreover, the signal outcomes of noninvasive measurements obtained from sensors placed on the body surface cannot be as precise as those of invasive measurements (including, for example,
123
Fig. 11 Overview of physiological measurement tools
measuring blood pressure invasively using an intra-arterial pressure transducer). In practice, the examiner faces various challenges in trying to establish a valid data gathering and analysis protocol. The exact placement of measurement sensors and the positioning of limbs and the whole body are crucial. For example, to measure blood pressure precisely, the cuff has to be placed at approximately the same vertical height as the heart, while the subject is seated and the arm is supported. A change in the arm’s position results in a significant value change due to additional hydrostatic pressure in the blood pipe. Moreover, an appropriate cuff deflation rate and cuff size must be used because oversized (undersized) cuffs lead to pressure values that are too high (low) (Irwin and Rippe 2008; Sircar 2008). A deviation from the placement of respiratory transducer belts just underneath the armpits (the area of maximal change in thorax circumference during inhaling) or from 3-D accelerometer belts closest to the center of mass may also alter the signal outcome significantly. In ECG and EMG testing, clean and gel-moist electrodes have to be properly attached to hairless skin because a disruption in contact may result in measurement inaccuracy. In general, sensors such as GSR electrodes, respiratory and accelerometer belts,
J Intell Manuf
and oximeter finger and ear clips must be attached tightly enough to establish the contact necessary to obtain accurate measurements but loosely enough to not constrict the finger, ear tissue, or thorax. After the proper placement and attachment of the sensors, the participants are asked to sit down, focus on breathing, and calm themselves to achieve a common reference “resting state”. Of course, the sensors have to be calibrated according to their respective standardization procedures prior to an experiment. The choice of a sampling rate may also affect the resulting data outcome critically. The tradeoff between accuracy and the amount of data obtained has to be optimized. A rough guide is the Nyquist rate, which proposes using at least half the sampling rate of the activity frequency (in our case) of the targeted organ or physiological system (Shenoi 2005). Data synchronization is also very important when measuring with more than one sensor or measurement tool simultaneously. All measurements need to be started at exactly the same time. Otherwise, all of the data need to be synchronized in postprocessing via tracing signals to produce valid output for further descriptive and statistical analysis. External (room) stimuli have a major impact on the measurement output and have to be taken into account, either by eliminating their influence before starting the measurement or by adjusting for their influence in the subsequent data analysis. As mentioned earlier, different daylight levels during the experiment may influence the pupil diameter and thus its baseline value significantly, even in the absence of the experimental stimuli. The room temperature, direct exposure to sunlight, and physical body movements may activate sweat glands and alter the GSR conductance level. Furthermore, the use of cosmetic and cleaning products before the measurement may reduce skin conductivity. Some participants may innately produce no signal at all. Overall, the electrical measurement tools described in this paper are intrasystematically very noise sensitive by nature. The movement of the limbs onto which electrodes are attached, as well as body movement itself, may lead to artifacts. Apart from possible disturbance due to improper attachment of electrodes, technical challenges, such as noise in cables and electrical noise in the surrounding area, are common sources of error. For example, ECG recordings are often distorted by such things as (1) baseline wander due to respiration, electrode impedance (caused by perspiration), and body movement; (2) electromagnetic radiation from other electrical devices in the surrounding area; and (3) muscle noise, especially in the case of in situ (engineering) experiments (Lu et al. 2009). Baseline wander affects the frequency range below 0.5 Hz and causes noise below the ECG frequency. Filtering out this narrow band of baseline wander can be accomplished using either cubic spline fitting (to estimate the baseline drift) or linear high-pass frequency spectrum filtering (Sörnmo and Laguna 2005; Har-
gittai 2008). Electromagnetic fields due to power lines create a narrow band of sinusoidal interference in the frequency range of 50/60 Hz (Europe/USA). Either range lies within the ECG frequency range, making it difficult to filter it out. The most effective ways to reduce this effect are to minimize the number of electrical devices nearby or shield the testing location from these signals (Sörnmo and Laguna 2005). Limb and body motion can create artifacts caused by problems in ECG electrode–skin contact and cable interference (this noise commonly lies in the low-frequency range of 0– 20 Hz). Muscle noise is the most crucial artifact because it usually overlaps the actual ECG data over its whole spectrum and thus causes severe problems. Low-pass filters are utilized to counteract these noises by reducing high-frequency components. However, muscle noise filtering remains a largely unsolved problem (Wei et al. 1999; Gacek and Pedrycz 2011). Collectively, the selection of filters and their adjustments bias the (ECG) output data significantly. With respect to interpreting data in terms of emotional dimension or context, the different types of sensors described in this paper allow, either alone or in combination, measurement of changes in heart rate, blood pressure, pulse, respiratory rate, body temperature, galvanic skin response, muscle activity, pupil size, and brain activity. However, it remains the responsibility of the researcher to interpret this data “emotionally”. Based on our practical experience, in engineering-context experiment design, we propose using the dimensional approach (arousal and valence). Thus, by measuring somatic changes induced by the ANS, we are able to capture arousal levels as they are expressed directly by physiological changes. Nonetheless, and with the dimensional approach of emotion classification in mind, it is not yet possible to precisely and reliably detect and quantify the valence level corresponding to a specific arousal value. In other words, changes in physiological conditions (e.g., changes in heart rate, breathing rate, and skin conductance) provide indications of the actual degree of arousal but leave open whether the arousal change is of a positive or negative nature. For example, “extremely happy” and “extremely angry” may produce similar sensor data. Hence, it is still recommended and indeed indispensable to include and consult complementary data inputs from various valence-focused tools, such as surveys, video analysis, and simple observation that help to interpolate along the second valence axis. In prior experiments (Jung et al. 2015; Steinert et al. 2012; Steinert and Jablokow 2013), we found the Affect Grid (see Fig. 12) to be most useful, since it involves a fast and simple inquiry of subjective emotional state requiring the subject to mark a point indicating a combination of arousal and valence coordinates. In addition to this time advantage, which makes it possible to take multiple measurements during an experiment, the Cartesian grid nature of the matrix allows metrical statistical analysis. However, it should be noted that
123
J Intell Manuf
Fig. 12 The affective grid. “The subject places one checkmark somewhere in the grid. The pleasure–displeasure (P) score is taken as the number of the square checked, with squares numbered along the horizontal dimension, counting 1–9 starting at the left. The arousal– sleepiness (A) score is taken as the number of square checked, with squares numbered along the vertical dimension, counting 1–9 starting at the bottom” (Russell et al. 1989)
survey-based tools may only be accepted as complementary measurement methods in engineering experiments. They do not generate continuous data at the required sampling rate. Furthermore, if taken during the experiment, they interrupt the interaction under investigation. Obviously, using a recall setup, even an assisted recall setup, is also questionable. Practically, we have had acceptable experiences by showing the subjects their own activity on video and letting them self-code their emotional states continuously (Jung 2011). The results are checked using FACS (Ekman and Friesen 1978), a video coding scheme that was developed for human interaction coding. Other coding schemes are the Rapid Couples Interaction Scoring System (RCISS; Krokoff et al. 1989), the Marital Interaction Coding System (MICS; Heyman et al. 1995), and the Specific Affect Coding System (SPAFF; Gottman and Krokoff 1989). All have been successfully employed in engineering research situations, but all are extremely timeand human labor-intensive, especially when controlling for inter-coder reliability, so that the same video sequence has to be coded multiple times. Recently, commercial computerbased analysis systems based on similar but simplified coding schemes have been developed. The iMOTIONS software, for example, can be used to analyze visual facial cues. It then codes valence and determines emotions based on facial expressions (iMOTIONS 2014). Of course, these types of software still require almost perfect lighting and controlled video setups. Also, the intensity of facial expressions seems to vary tremendously between contexts and cultures. Currently, the combination of input data of multiple types, such as data from video and voice analysis and physiology sensors, shows the most promise. The data combination approach allows precise measurement of arousal levels and makes it possible to obtain various sets of collectively indicative yet individually inconclusive data on the valence level. Signal noise is then the key concern.
123
Nevertheless, even if the researcher manages to eliminate all external and intra-systematic noises and artifacts, the physiological condition of an examined participant may still vary naturally throughout the day. Individual somatic states shift with psychological and physiological changes; physiological conditions thus vary from one day, hour, and minute to the next and also vary fundamentally between individuals. As a consequence, and because of the lack of definition of an individual reference level, neither an intrapersonal nor an interpersonal classical statistical analysis seems valid. Indeed, with respect to analysis, it is not yet possible to define a general “bundle” of physiological changes that code into one specific emotion or valence level and is also globally applicable to any subject at any point in time in an engineering context. The nonlinear chaotic mechanism (strong variance between subjects and for one subject between contexts) prevents the use of classical statistics to deduce a quantitative emotion score outside very controlled environments. Thus, attention has shifted to using genetic algorithms and machine learning to synthesize and analyze various data streams. Results obtained in a controlled HCI setting using EEG, GSR, and eye-tracking data, for example, have been documented (Fairclough et al. 2015; Zhou et al. 2015). However, the neural network approach does not shed light on the underlying physiology–emotion mechanisms, if such exist, as they leave us with a black box. The community is increasingly combining various sensor and valence measurement tools and deploying them with learning algorithms. Because of the strong subject and context dependency of emotion reactivity, it seems likely that each subject will require a specific coding and perhaps even specific context and environment data. More sophisticated physiology measurement techniques, such as near-infrared spectroscopy (NIRS) and analytics, may also make it possible to determine the valence dimension more precisely and directly in the future. NIRS sensor setups allow us to obtain higher-definition spatial brain activity data based on oxygenation level, similar to fMRI but limited to a depth of approximately 2–3 cm. Initial advances have been reported at CHI (Solovey et al. 2015; Maior et al. 2015) but must still be applied to more tangible engineering scenarios. In combination with very-time-sensitive EEG data, we ought to be able to develop an in situ, usable, real-time brain activity monitoring setup. This setup may allow us to look into the black box and derive emotional states without the need for very complex survey-assisted or video-coded experiment setups. Thus, the tasks for the community are to further deploy and experiment with various sensors, to combine data, and to use learning algorithms to determine emotion values (arousal and valence) in an in situ engineering context. Success may allow us to develop system–user interfaces with closed-loop cycles
J Intell Manuf
that incorporate the human emotional state dynamically. The age of affective engineering is dawning. Open Access This article is distributed under the terms of the Creative Commons Attribution 4.0 International License (http://creativecomm ons.org/licenses/by/4.0/), which permits unrestricted use, distribution, and reproduction in any medium, provided you give appropriate credit to the original author(s) and the source, provide a link to the Creative Commons license, and indicate if changes were made.
References Aiyagari, V., & Gorelick, P. B. (2010). Hypertension and stroke: Pathophysiology and management. Berlin: Springer. Albayrak, E., & Erensal, Y. C. (2004). Using analytic hierarchy process (AHP) to improve human performance: An application of multiple criteria decision making problem. Journal of Intelligent Manufacturing, 15(4), 491–503. doi:10.1023/B:JIMS.0000034112.00652. 4c. Alexiou, K., Zamenopoulos, T., Johnson, J. H., & Gilbert, S. J. (2009). Exploring the neurological basis of design cognition using brain imaging: Some preliminary results. Design Studies, 30(6), 623– 647. doi:10.1016/j.destud.2009.05.002. Ax, A. F. (1953). The physiological differentiation between fear and anger in humans. Psychosomatic Medicine. Database of the U.S. National Library of Medicine, 15(5), 433–442. Bachorowski, J.-A., & Owren, M. J. (1995). Vocal expression of emotion: Acoustic properties of speech are associated with emotional intensity and context. Psychological Science, 6(4), 219–224. doi:10.1111/j.1467-9280.1995.tb00596.x. Balters, S., & Steinert, M. (2014). Decision-making in engineering–A call for affective engineering dimensions in applied engineering design and design sciences. In Proceedings of the 2014 international conference on innovative design and manufacturing (ICIDM), IEEE (pp. 11–15). Bear, M. F., Connors, B. W., & Paradiso, M. A. (2007). Neuroscience. Philadelphia: Lippincott Williams & Wilkins. Beauregard, M., Leroux, J. M., Bergman, S., Arzoumanian, Y., Beaudoin, G., Bourgouin, P., et al. (1998). The functional neuroanatomy of major depression: An fMRI study using an emotional activation paradigm. Neuroreport, 9(14), 3253–3258. Benarroch, E. E. (2006). Basic neurosciences with clinical applications. Amsterdam: Elsevier Health Sciences. Biometric Car Simulator Research Lab @ Stanford University. (2015). Eye tracking software and solutions—iMotions. http:// imotionsglobal.com/portfolio-item/biometric-car-simulatorresearch-lab-stanford-university/. Accessed 07/02/2015. Birmingham, H. P., & Taylor, F. V. (1954). Human engineering approach to the design of man-operated continuous control systems. Washington: Naval Research Laboratory. Boerema, S. T., van Velsen, L., Schaake, L., Tonis, T. M., & Hermens, H. J. (2014). Optimal sensor placement for measuring physical activity with a 3D accelerometer. Sensors (Basel, Switzerland), 14(2), 3188–3206. doi:10.3390/s140203188. Bolis, L., Licinio, J., & Govoni, S. (2002). Handbook of the autonomic nervous system in health and sisease. Boca Raton: CRC Press. Boy, G. A. (2012). The handbook of human–machine interaction: A human-centered design approach. Farnham: Ashgate Publishing Ltd. Bradley, M. M., Miccoli, L., Escrig, M. A., & Lang, P. J. (2008). The pupil as a measure of emotional arousal and autonomic activation. Psychophysiology, 45(4), 602–607.
Brodal, P. (2010). The central nervous system. Oxford: Oxford University Press. Broek, E. L., van den, Lisý, V., Janssen, J. H., Westerink, J. H. D. M., Schut, M. H., & Tuinenbreijer, K. (2010). Affective man–machine interface: Unveiling human emotions through biosignals. In: A. Fred, J. Filipe, & H. Gamboa (Eds.), Biomedical engineering systems and technologies (pp. 21–47). Communications in computer and information science 52. Berlin: Springer. Bronzino, J. D. (2000). The biomedical engineering handbook. 1. Berlin: Springer. Brown, S. P., Miller, W. C., & Eason, J. M. (2006). Exercise physiology: Basis of human movement in health and disease. Philadelphia: Lippincott Williams & Wilkins. Cacciabue, P. C. (2004). Guide to applying human factors methods: Human error and accident management in safety-critical systems. Berlin: Springer. Cacioppo, J. T., Berntson, G. G., Klein, D. J., Poehlmann, K. M., & Ito, T. A. (2000). The psychophysiology of emotion. In M. Lewis & J. Haviland-Jones (Eds.), Handbook of emotions. New York: Guilford Press. Cannon, W. B. (1927). The James–Lange theory of emotions a critical examination and an alternative theory. Champaign, IL: University of Illinois Press. Carter, P. J. (2007). Lippincott’s textbook for nursing assistants: A humanistic approach to caregiving. Philadelphia: Lippincott Williams & Wilkins. Chaitow, L., Gilbert, C., & Morrison, D. (2014). Recognizing and treating breathing disorders. Amsterdam: Elsevier Health Sciences. Chan, A. Y. K. (2008). Biomedical device technology: Principles and design. Springfield: Charles C Thomas Publisher. Chen, S., Epps, J., Ruiz, N., & Chen, F. (2011). Eye activity as a measure of human mental effort in HCI. In Proceedings of the 16th international conference on intelligent user interfaces, IUI ’11 (pp. 315–318). New York, NY, USA: ACM. doi:10.1145/1943403. 1943454. Christie, I. C., & Friedman, B. H. (2004). Autonomic specificity of discrete emotion and dimensions of affective space: A multivariate approach. International Journal of Psychophysiology, 51(2), 143– 153. doi:10.1016/j.ijpsycho.2003.08.002. Clark, D. A., & Beck, A. T. (2011). Cognitive therapy of anxiety disorders: Science and practice. New York: Guilford Press. Coan, J. A., & Allen, J. J. B. (2007). Handbook of emotion elicitation and assessment. USA: Oxford University Press. Cohen, R. A., & Sweet, L. H. (2010). Brain imaging in behavioral medicine and clinical neuroscience. Berlin: Springer. Conover, M. B. (2004). Electrocardiography. St. Louis, MO: Mosby. Coon, D., & Mitterer, J. (2008). Introduction to psychology: Gateways to mind and behavior. Boston: Cengage Learning. Cooper, K., & Gosnell, K. (2014). Foundations of nursing. Amsterdam: Elsevier Health Sciences. Coulson, M. (2004). Attributing emotion to static body postures: Recognition accuracy, confusions, and viewpoint dependence. Journal of Nonverbal Behavior, 28(2), 117–139. doi:10.1023/B:JONB. 0000023655.25550.be. Courneya, C. A. M., & Parker, M. J. (2011). Cardiovascular physiology: A clinical approach. Philadelphia: Lippincott Williams & Wilkins. Cowie, R., & Cornelius, R. R. (2003). Describing the emotional states that are expressed in speech. Speech Communication, 40(1–2), 5– 32. doi:10.1016/S0167-6393(02)00071-7. Dael, N., Mortillaro, M., & Scherer, K. R. (2012). The body action and posture coding system (BAP): Development and reliability. Journal of Nonverbal Behavior, 36(2), 97–121. doi:10.1007/s10919012-0130-0. Damasio, A. R. (1994). Descartes’ error: Emotion, reason, and the human brain. New York: Putnam.
123
J Intell Manuf Davidson, R. J., & Irwin, W. (1999). The functional neuroanatomy of emotion and affective style. Trends in Cognitive Sciences, 3(1), 11–21. doi:10.1016/S1364-6613(98)01265-0. Dawson, M. E., Schell, A. M., Filion, D. L., & Berntson, G. G. (2007). The electrodermal system. In: Handbook of psychophysiology, 3rd edn. Cambridge University Press. De Rivecourt, M., Kuperus, M. N., Post, W. J., & Mulder, L. J. M. (2008). Cardiovascular and eye activity measures as indices for momentary changes in mental effort during simulated flight. Ergonomics, 51(9), 1295–1319. doi:10.1080/00140130802120267. Desmet, P. (2003). Measuring emotion: Development and application of an instrument to measure emotional responses to products. Funology, 2005, 111–123. Dorsch, J. A. (2012). Understanding anesthesia equipment. Philadelphia: Lippincott Williams & Wilkins. Dreeben, O. (2006). Introduction to physical therapy for physical therapist assistants. London: Jones & Bartlett Learning. Duffy, V. G. (2008). Handbook of digital human modeling: Research for applied ergonomics and human factors engineering. Boca Raton: CRC Press. Edmonds, W. A., & Tenenbaum, G. (2011). Case studies in applied psychophysiology: Neurofeedback and biofeedback treatments for advances in human performance. New York: Wiley. Ekman, P. (1999). Basic emotions. In T. Dalgleish & M. Power (Eds.), Handbook of cognition and emotion. Sussex: Wiley. Ekman, P. (1993). Facial expression and emotion. The American Psychologist, 48(4), 384–392. Ekman, P. (1992). An argument for basic emotions. Cognition and Emotion, 6(3–4), 169–200. doi:10.1080/02699939208411068. Ekman, P., Levenson, R. W., & Friesen, W. V. (1983). Autonomic nervous system activity distinguishes among emotions. Science, 221(4616), 1208–1210. doi:10.1126/science.6612338. Ekman, P., & Friesen, W. V. (1978). Facial action coding system. Palo Alto, CA: Consulting Psychologists Press. Ekman, P., Friesen, W. V., & Ellsworth, P. (1972). Emotion in the human face: Guide-lines for research and an integration of findings. New York: Pergamon Press. Ekman, P., & Friesen, W. V. (1971). Constants across cultures in the face and emotion. Journal of Personality and Social Psychology, 17(2), 124–129. doi:10.1037/h0030377. Fairclough, S. H., Karran, A.J. & Gilleade, K. (2015). Classification accuracy from the perspective of the user: Real-time interaction with physiological computing. In Proceedings of the 33rd annual ACM conference on human factors in computing systems, CHI ’15 (pp. 3029–3038). New York, NY, USA: ACM. doi:10.1145/ 2702123.2702454. Faller, A., & Schuenke, M. (2011). Human body: An introduction to structure and function. Stuttgart: Thieme. Feldman Barrett, L., & Russell, J. A. (1998). Independence and bipolarity in the structure of current affect. Journal of Personality and Social Psychology, 74(4), 967–984. doi:10.1037/0022-3514.74.4. 967. Fitts, P. M. (1951). Human engineering for an effective air-navigation and traffic-control system. Washington: National Research Council, Division of Anthropology and Psychology, Committee on Aviation Psychology. Fontan, G., Merce, C., Hennet, J.-C., & Lasserre, J. (2005). Hierarchical scheduling for decision support. Journal of Intelligent Manufacturing, 16(2), 235–242. doi:10.1007/s10845-004-5891-9. Fred, A., Filipe, J., & Gamboa, H. (2008). Biomedical engineering systems and technologies. In International joint conference, BIOSTEC 2008 Funchal, Madeira, Portugal, January 28–31, 2008, Revised Selected Papers. Springer. Fredrickson, B. L., Tugade, M. M., Waugh, C. E., & Larkin, G. R. (2003). What good are positive emotions in crisis? A prospective study of resilience and emotions following the terrorist attacks on
123
the United States on September 11th, 2001. Journal of Personality and Social Psychology, 84(2), 365–376. doi:10.1037/0022-3514. 84.2.365. Fredrickson, B. L., & Levenson, R. W. (1998). Positive emotions speed recovery from the cardiovascular sequelae of negative emotions. Cognition & Emotion, 12(2), 191–220. doi:10.1080/ 026999398379718. Freinkel, R. K., & Woodley, D. T. (2001). The biology of the skin. Boca Raton: CRC Press. Friston, K. J., Frith, C. D., Dolan, R. J., Price, C. J., Zeki, S., Ashburner, J. T., et al. (2004). Human brain function. London: Academic Press. Furlong, M. J., Gilman, R., & Scott Huebner, E. (2014). Handbook of positive psychology in schools. London: Routledge. Gacek, A., & Pedrycz, W. (2011). ECG signal processing, classification and interpretation: A comprehensive framework of computational intelligence. Berlin: Springer. Gerber, A. J., Posner, J., Gorman, D., Colibazzi, T., Yu, S., Wang, Z., et al. (2008). An affective circumplex model of neural systems subserving valence, arousal, and cognitive overlay during the appraisal of emotional faces. Neuropsychologia, 46(8), 2129–2139. doi:10. 1016/j.neuropsychologia.2008.02.032. Goldin, P. R., McRae, K., Ramel, W., & Gross, J. J. (2008). The neural bases of emotion regulation: Reappraisal and suppression of negative emotion. Biological Psychiatry, Stress, Anxiety, and Post-Traumatic Stress Disorder, 63(6), 577–586. doi:10.1016/j. biopsych.2007.05.031. Goldstein, D. S. (2008). Adrenaline and the inner world: An introduction to scientific integrative medicine. Baltimore: JHU Press. Gottfried, J. A. (2011). Neurobiology of sensation and reward. Boca Raton: CRC Press. Gottman, J. M., & Krokoff, L. J. (1989). Marital interaction and satisfaction: A longitudinal view. Journal of Consulting and Clinical Psychology, 57(1), 47–52. Gray, J. A. (1982). The neuropsychology of anxiety: An enquiry into the functions of the septo-hippocampal system. New York, Oxford: Clarendon Press, Oxford University Press. Gross, J. J. (1998). The emerging field of emotion regulation: An integrative review. Review of General Psychology, 2(3), 271–299. doi:10.1037/1089-2680.2.3.271. Hargittai, S. (2008). Efficient and fast ECG baseline wander reduction without distortion of important clinical information. Comput Cardiol Computers in Cardiology, 35, 841–844. Hering, C. (2001). Analytical repertory of the symptoms of the mind. New Delhi: B. Jain Publishers. Heyman, R. E., Weiss, R. L., & Eddy, J. M. (1995). Marital interaction coding system: Revision and empirical evaluation. Behaviour Research and Therapy, 33(6), 737–746. Hjortskov, N., Rissén, D., Blangsted, A. K., Fallentin, N., Lundberg, U., & Søgaard, K. (2004). The effect of mental stress on heart rate variability and blood pressure during computer work. European Journal of Applied Physiology, 92(1–2), 84–89. doi:10.1007/ s00421-004-1055-z. Horlings, R., Datcu, D. & Rothkrantz, L. J. M. (2008). Emotion recognition using brain activity. In Proceedings of the 9th international conference on computer systems and technologies and workshop for PhD students in computing, CompSysTech ’08 (pp. 6:II.1–6:1). New York, NY, USA: ACM. doi:10.1145/1500879.1500888. Iaizzo, P. A. (2009). Handbook of cardiac anatomy, physiology, and devices. Berlin: Springer. iMOTIONS. (2014). Attention tool—Emotient module: Facial expression analysis. Retrieved December 6, 2014 from http:// imotionsglobal.com/software/add-on-modules/attention-toolfacet-module-facial-action-coding-system-facs. Ingels, N. B., Daughters, G. T., & Baan, J. (1996). Systolic and diastolic function of the heart. Amsterdam: IOS Press.
J Intell Manuf Irwin, R. S., & Rippe, J. M. (2008). Irwin and Rippe’s intensive care medicine. Philadelphia: Lippincott Williams & Wilkins. James, W. (1884). What is an emotion? Mind, 9, 188–205 (Reprinted in W. James, Collected Essays & Reviews. New York: Russel and Russel, 1969, pp 244–275). Jaenig, W. (2006). Integrative action of the autonomic nervous system: Neurobiology of homeostasis. Cambridge: Cambridge University Press. Jasper, H. H. (1958). The ten twenty electrode system of the international federation. Electroencephalography and Clinical Neurophysiology, 10, 371–375. Jung, M. F., Leifer, L. J., Gross, J. J., Hinds, P., & Steinert, M. (2015). Displayed uncertainty improves driving experience and behavior: The case of range anxiety in an electric car. In CHI 2015, April 18–23, 2015 Seoul, Republic of Korea. Jung, M. F. (2011). Engineering team performance and emotion: Affective interaction dynamics as indicators of design team performance. Diss. Stanford University. Kahneman, D. (2011). Thinking, fast and slow. New York: Macmillan. Kahneman, D., & Tversky, A. (1984). Choices, values, and frames. American Psychologist, 39(4), 341–350. doi:10.1037/0003-066X. 39.4.341. Kahneman, D., & Tversky, A. (1979). Prospect theory: An analysis of decision under risk. Econometrica, 47(2), 263–291. doi:10.2307/ 1914185. Kappas, A., Hess, U., & Scherer, K. R. (1991). Voice and emotion. Cambridge: Cambridge University Press. Keshav, S., & Bailey, A. (2012). The gastrointestinal system at a glance. New York: Wiley. Khurana, I. (2005). Textbook of medical physiology. Noida: Elsevier India. Khurana, I. (2008). Essentials of medical physiology. Noida: Elsevier India. Kim, S. I., & Suh, T. S. (2007). World congress of medical physics and biomedical engineering 2006: August 27–Septmber 1, 2006 COEX Seoul, Korea (Vol. 14). Springer. Klaassen, K. B. (1996). Electronic measurement and instrumentation. Cambridge: Cambridge University Press. Klabunde, R. (2011). Cardiovascular physiology concepts. Philadelphia: Lippincott Williams & Wilkins. Klingner, J., Kumar, R. & Hanrahan, P. (2008). Measuring the taskevoked pupillary response with a remote eye tracker. In Proceedings of the 2008 symposium on eye tracking research & applications. ACM. Kouatli, I., & Jones, B. (1990). A guide to the design of fuzzy control systems for manufacturing processes. Journal of Intelligent Manufacturing, 1(4), 231–243. doi:10.1007/BF01471189. Krebs, C. (2011). Neuroscience. Philadelphia: Lippincott Williams & Wilkins. Krokoff, L. J., Gottman, J. M., & Hass, S. D. (1989). Validation of a global rapid couples interaction scoring system. Behavioral Assessment, 11(1), 65–79. US: Pergamon Press, Inc. Krstic, R. V. (1991). Human microscopic anatomy: An atlas for students of medicine and biology. Berlin: Springer. Kumar, V., Abbas, A. K., Fausto, N., & Mitchell, R. N. (2012). Robbins basic pathology. Amsterdam: Elsevier Health Sciences. Lane, R. D., Chua, P. M.-L., & Dolan, R. J. (1999). Common effects of emotional valence, arousal and attention on neural activation during visual processing of pictures. Neuropsychologia, 37(9), 989–997. doi:10.1016/S0028-3932(99)00017-2. Lang, P. J. (1995). The emotion probe: Studies of motivation and attention. American Psychologist, 50(5), 372–385. doi:10.1037/0003066X.50.5.372. Lange, C. G., & Kurella, H. (1887). Ueber Gemüthsbewegungen: eine psycho-physiologische Studie. Leipzig: T. Thomas.
Lanzer, P., & Topol, E. J. (2002). Pan vascular medicine: Integrated clinical management. Berlin: Springer. LeDoux, J. E. (2003). The emotional brain, fear, and the amygdala. Cellular and Molecular Neurobiology, 23(4–5), 727–738. doi:10. 1023/A:1025048802629. LeDoux, J. E. (2000). Emotion circuits in the brain. Annual Review of Neuroscience, 23, 155–184. Lee, T. C., & Niederer, P. (2010). Basic engineering for medics and biologists: An ESEM primer. Amsterdam: IOS Press. Levenson, R. W. (2014). The autonomic nervous system and emotion. Emotion Review, 6(2), 100–112. doi:10.1177/ 1754073913512003. Levenson, R. W. (2007). Emotion elicitation with neurological patients. Handbook of emotion elicitation and assessment. Oxford: Oxford University Press. Levenson, Robert W. (2003). Autonomic specificity and emotion. Oxford: Oxford University Press. Liu, Y., Ritchie, J. M., Lim, T., Kosmadoudi, Z., Sivanathan, A., & Sung, R. C. W. (2014). A fuzzy psycho-physiological approach to enable the understanding of an engineer’s affect status during CAD activities. CAD Computer Aided Design, 54, 19–38. Loewy, A. D., & Spyer, K. M. (1990). Central regulation of autonomic functions. New York: Oxford University Press. Lu, G., Brittain, J.-S., Holland, P., Yianni, J., Green, A. L., Stein, J. F., et al. (2009). Removing ECG noise from surface EMG signals using adaptive filtering. Neuroscience Letters, 462(1), 14–19. doi:10.1016/j.neulet.2009.06.063. Lukey, B. J., & Tepe, V. (2008). Biobehavioral resilience to stress. Boca Raton: CRC Press. Macfarlane, P. W., van Oosterom, A., Pahlm, O., Kligfield, P., Janse, M., & Camm, J. (2010). Comprehensive electrocardiology. Berlin: Springer. Mackie, D. M., & Smith, E. R. (2004). From prejudice to intergroup emotions: Differentiated reactions to social groups. London: Psychology Press. Malakooti, B. (2010). Decision making process: Typology, intelligence, and optimization. Journal of Intelligent Manufacturing, 23(3), 733–746. doi:10.1007/s10845-010-0424-1. Maior, H., Pike, M., Sharples, S. & Wilson, M. (2015). Examining the reliability of using fNIRS in realistic HCI settings for spatial and verbal tasks. In Proceedings of the 33rd annual ACM conference on human factors in computing systems, CHI ’15 (pp. 3029–3038). New York, NY, USA: ACM. doi:10.1145/2702123.2702454. Mandryk, R. L., & Atkins, M. S. (2007). A fuzzy physiological approach for continuously modeling emotion during interaction with play technologies. International Journal of Human–Computer Studies, 65(4), 329–347. Martini, F. H. (2007). Anatomy and physiology. Singapore: Rex Bookstore Inc. Matsubara, Y., & Nagamachi, M. (1997). Hybrid Kansei engineering system and design support. International Journal of Industrial Ergonomics, Kansei Engineering and Comfort, 19(2), 81–92. doi:10.1016/S0169-8141(96)00005-4. Mauss, I. B., & Robinson, M. D. (2009). Measures of emotion: A review. Cognition & Emotion, 23(2), 209–237. Mauss, I. B., Levenson, R. W., McCarter, L., Wilhelm, F. H., & Gross, J. J. (2005). The tie that binds? Coherence among emotion experience, behavior, and physiology. Emotion (Washington, DC), 5(2), 175–190. McCormick, E. J. (1976). Human factors in engineering and design. New York: McGraw-Hill. Merletti, R., & Parker, P. A. (2004). Electromyography: Physiology, engineering, and non-invasive applications. New York: Wiley. Miller, R. D., Eriksson, L. I., Fleisher, L. A., Wiener-Kronish, J. P., & Cohen, N. H. (2014). Miller’s anesthesia. Amsterdam: Elsevier Health Sciences.
123
J Intell Manuf Nagamachi, M. (1995). Kansei engineering: A new ergonomic consumer-oriented technology for product development. International Journal of Industrial Ergonomics, Kansei Engineering: An Ergonomic Technology for product development, 15(1), 3–11. doi:10.1016/0169-8141(94)00052-5. Nguyen, T. A., & Zeng, Y. (2014). A physiological study of relationship between designer’s mental effort and mental stress during conceptual design. Computer-Aided Design, 54, 3–18. Nguyen, T. A., & Zeng, Y. (2012). A theoretical model of design creativity: Nonlinear design dynamics and mental stress-creativity relation. Journal of Integrated Design and Process Science, 16(3), 65–88. doi:10.3233/jid-2012-0007. Nguyen, T. A., & Zeng, Y. (2010). Analysis of design activities using EEG signals. In ASME 2010 international design engineering technical conferences and computers and information in engineering conference. American Society of Mechanical Engineers. Niedermeyer, E., & Lopes da Silva, F. H. (2005). Electroencephalography: Basic principles, clinical applications, and related fields. Philadelphia: Lippincott Williams & Wilkins. Noback, C. R., Strominger, N. L., Demarest, R. J., & Ruggiero, D. A. (2005). The human nervous system: Structure and function. Berlin: Springer. Northrop, R. B. (2014). Noninvasive instrumentation and measurement in medical diagnosis. Boca Raton: CRC Press. Nuwer, M. R. (1990). Paperless electroencephalography. Seminars in Neurology, 10(2), 178–184. doi:10.1055/s-2008-1041267. Ochsner, K. N., & Gross, J. J. (2005). The cognitive control of emotion. Trends in Cognitive Sciences, 9(5), 242–249. doi:10.1016/j.tics. 2005.03.010. O’Sullivan, S. B., Schmitz, T. J., & Fulk, G. (2013). Physical rehabilitation. Philadelphia: F.A. Davis. Panksepp, J. (1998). Affective neuroscience: The foundations of human and animal emotions. Oxford: Oxford University Press. Picard, R. W. (2000). Toward computers that recognize and respond to user emotion. IBM Systems Journal, 39(3.4), 705–719. doi:10. 1147/sj.393.0705. Picard, R. W., Vyzas, E., & Healey, J. (2001). Toward machine emotional intelligence: Analysis of affective physiological state. IEEE Transactions on Pattern Analysis and Machine Intelligence, 23(10), 1175–1191. doi:10.1109/34.954607. Pinsky, M. R., Brochard, L., Mancebo, J., & Hedenstierna, G. (2009). Applied physiology in intensive care medicine. Berlin: Springer. Philippot, P., & Feldman, R. S. (2004). The regulation of emotion. London: Psychology Press. Plutchik, R. (1962). The emotions: Facts, theories, and a new model. New York: Random House. Porth, C. (2011). Essentials of pathophysiology: Concepts of altered health states. Philadelphia: Lippincott Williams & Wilkins. Purves, D. (2012). Neuroscience. Sunderland: Sinauer Associates. Reiman, E. M., Lane, R. D., Ahern, G. L., Schwartz, G. E., Davidson, R. J., Friston, K. J., et al. (1997). Neuroanatomical correlates of externally and internally generated human emotion. The American Journal of Psychiatry, 154(7), 918–925. Reis, H. T., & Judd, C. M. (2014). Handbook of research methods in social and personality psychology. Cambridge: Cambridge University Press. Reisenzein, R. (1994). Pleasure-arousal theory and the intensity of emotions. Journal of Personality and Social Psychology, 67(3), 525–539. doi:10.1037/0022-3514.67.3.525. Rhoades, R. A., & Bell, D. R. (2012). Medical phisiology: Principles for clinical medicine. Philadelphia: Lippincott Williams & Wilkins. Roberts, M. B. V. (1986). Biology: A functional approach. Cheltenham: Nelson Thornes. Robertson, D., & Biaggioni, I. (2012). Primer on the autonomic nervous system. London: Academic Press.
123
Rosenberg, R. N. (2008). The molecular and genetic basis of neurologic and psychiatric disease. Philadelphia: Lippincott Williams & Wilkins. Rowe, D. W., Sibert, J. & Irwin, D. (1998). Heart rate variability: Indicator of user state as an aid to human–computer interaction. In Proceedings of the SIGCHI conference on human factors in computing systems, CHI ’98 (pp. 480–487). New York, NY, USA: ACM Press/Addison-Wesley Publishing Co. doi:10.1145/274644. 274709. Ruderman, A. M., Choi, S.-K., & Jiao, R. J. (2011). Simulationbased conjoint ranking for optimal decision support process under aleatory uncertainty. Journal of Intelligent Manufacturing, 24(3), 641–652. doi:10.1007/s10845-011-0610-9. Russell, J. A., Bachorowski, J., & Fernández-Dols, J. M. (2003). Facial and vocal expressions of emotion. Annual Review of Psychology, 54(1), 329–349. doi:10.1146/annurev.psych.54.101601.145102. Russell, J. A., & Feldman Barrett, L. (1999). Core affect, prototypical emotional episodes, and other things called emotion: Dissecting the elephant. Journal of Personality and Social Psychology, 76(5), 805–819. doi:10.1037/0022-3514.76.5.805. Russell, J. A., Weiss, A., & Mendelsohn, G. A. (1989). Affect grid: A single-item scale of pleasure and arousal. Journal of Personality and Social Psychology, 57(3), 493–502. doi:10.1037/0022-3514. 57.3.493. Russell, J. A. (1980). A circumplex model of affect. Journal of Personality and Social Psychology, 39(6), 1161–1178. doi:10.1037/ h0077714. Safar, M. E., O’Rourke, M. F., & Frohlich, E. D. (2014). Blood pressure and arterial wall mechanics in cardiovascular diseases. Berlin: Springer. Saladin, K. S. (2008). Human anatomy. Boston: McGraw-Hill. Sartor, K., & Stippich, C. (2007). Clinical functional MRI: Presurgical functional neuroimaging. Berlin: Springer. Scanlon, V. C., & Sanders, T. (2010). Essentials of anatomy and physiology. Philadelphia: F.A. Davis. Schachter, S., & Singer, J. E. (1962). Cognitive, social, and physiological determinants of emotional state. Psychological Review, 69, 379–399. Schultz, W. (2000). Multiple reward signals in the brain. Nature Reviews Neuroscience, 1(3), 199–207. doi:10.1038/35044563. Sears, A., & Jacko, J. A. (2007). The human–computer interaction handbook: Fundamentals, evolving technologies and emerging applications (2nd ed.). Boca Raton: CRC Press. Secher, N. H., & Volianitis, S. (2009). Handbook of sports medicine and science, rowing. New York: Wiley. Seifter, J., Sloane, D., & Ratner, A. (2005). Concepts in medical physiology. Philadelphia: Lippincott Williams & Wilkins. Sembulingam, K., & Sembulingam, P. (2012). Essentials of medical physiology. New Delhi: JP Medical Ltd. Shaw, L. (2005). Anatomy and physiology. Cheltenham: Nelson Thornes. Shenoi, B. A. (2005). Introduction to digital signal processing and filter design. New York: Wiley. Sherwood, L. (2012). Human physiology: From cells to systems. Boston: Cengage Learning. Shiller, R. J. (2000). Irrational exuberance. Princeton, NJ: Princeton University Press. Shiota, M. N., Neufeld, S. L., Yeung, W. H., Moser, S. E., & Perea, E. F. (2011). Feeling good: Autonomic nervous system responding in five positive emotions. Emotion, 11(6), 1368–1378. doi:10.1037/ a0024278. Siegel, A., & Sapru, H. N. (2006). Essential neuroscience. Philadelphia: Lippincott Williams & Wilkins. Singh, M. (2008). General anatomy. New Delhi: Elsevier India. Singh, M. (2014). Introduction to biomedical instrumentation. New Delhi: PHI Learning Pvt. Ltd.
J Intell Manuf Sircar, S. (2008). Principles of medical physiology. Stuttgart: Thieme. Solomon, R. L., & Corbit, J. D. (1974). An opponent-process theory of motivation. I. Temporal dynamics of affect. Psychological Review, 81(2), 119–145. Solovey, T. E., Afergan, D., Peck, E. M., Hincks, S. W., & Jacob, R. J. K. (2015). Designing implicit interfaces for physiological computing: Guidelines and lessons learned using fNIRS. ACM Transactions on Computer–Human Interaction, 21(6), 35:1–35:27. doi:10.1145/ 2687926. Sörnmo, L., & Laguna, P. (2005). Bioelectrical signal processing in cardiac and neurological applications. Amsterdam: Elsevier Academic Press. Squire, L. R. (2013). Fundamental neuroscience. New York: Academic Press. Stanier, M. W., Mount, L. E., & Bligh, J. (1984). Energy balance and temperature regulation. Cambridge: CUP Archive. Steinert, M., & Jablokow, K. (2013). Triangulating front end engineering design activities with physiology data and psychological preferences. In Proceedings of international conference on engineering design, ICED 7 DS75-07 (pp. 109–118). Steinert, M., Leifer, L. J., & Jalbokow, K. W. (2012). EAGER: AnalyzeD—Analyzing engineering design activities. In NSF engineering research and innovation conference, sponsored by the National Science Foundation’s Division of Civil, Mechanical and Manufacturing Innovation (CMMI), Boston, USA. Stemmer, B., & Whitaker, H. A. (2008). Handbook of the neuroscience of language. New York: Academic Press. Stemmler, G., Heldmann, M., Pauls, C. A., & Scherer, T. (2001). Constraints for emotion specificity in fear and anger: The context counts. Psychophysiology, 38(2), 275–291. doi:10.1111/14698986.3820275. Stemmler, G. (1989). The autonomic differentiation of emotions revisited: Convergent and discriminant validation. Psychophysiology, 26(6), 617–632. Stern, R. M., Ray, W. J., & Quigley, K. S. (2000). Psychophysiological recording. Oxford: Oxford University Press. Storey, K. B. (2005). Functional metabolism: Regulation and adaptation. New York: Wiley. Sun, G., & Yao, S. (2012). Investigating the relation between cognitive load and creativity in the conceptual design process. Proceedings of the Human Factors and Ergonomics Society Annual Meeting, 56(1), 308–312. doi:10.1177/1071181312561072. Sylcott, B., Cagan J., & Tabibnia, G. (2015). Understanding of emotions and reasoning during consumer tradeoff between function and aesthetics in product design. Washington, DC, USA. Accessed February 12. Thiriet, M. (2007). Biology and mechanics of blood flows: Part II: Mechanics and medical aspects. Berlin: Springer. Tilley, L. P. (2006). Rapid interpretation of heart and lung sounds: A guide to cardiac and respiratory auscultation in dogs and cats. Amsterdam: Elsevier Health Sciences.
Tomaka, J., Blascovich, J., Kibler, J., & Ernst, J. M. (1997). Cognitive and physiological antecedents of threat and challenge appraisal. Journal of Personality and Social Psychology, 73(1), 63–72. doi:10.1037/0022-3514.73.1.63. Tomkins, S. S. (1962). Affect, imagery, consciousness: Vol. I. The positive affects (Vol. xv). Oxford: Springer. Tortora, G. J., & Grabowski, S. R. (2002). Principles of anatomy and physiology, illustrated notebook. New York: Wiley. Tyner, F. S., & Knott, J. R. (1983). Fundamentals of EEG technology: Basic concepts and methods. Philadelphia: Lippincott Williams & Wilkins. Uys, L. R. (1999). Fundamental nursing. Cape Town: Maskew Miller Longman. Walsh, S., & King, E. (2007). Pulse diagnosis: A clinical guide. Amsterdam: Elsevier Health Sciences. Watson, D., Clark, L. A., & Tellegen, A. (1988). Development and validation of brief measures of positive and negative affect: The PANAS scales. Journal of Personality and Social Psychology, 54(6), 1063–1070. Watson, D., & Tellegen, A. (1985). Toward a consensual structure of mood. Psychological Bulletin, 98(2), 219–235. Webster, J. G. (1997). Design of pulse oximeters. Boca Raton: CRC Press. Wei, D., Harasawa, E., & Hosaka, H. (1999). A low-distortion filter method to reject muscle noise in multi-lead electrocardiogram systems. Frontiers of Medical and Biological Engineering: The International Journal of the Japan Society of Medical Electronics and Biological Engineering, 9(4), 315–330. Whalen, P. J., Shin, L. M., McInerney, S. C., Fischer, H., Wright, C. I., & Rauch, S. L. (2001). A functional MRI study of human amygdala responses to facial expressions of fear versus anger. Emotion, 1(1), 70–83. doi:10.1037/1528-3542.1.1.70. Whittemore, S. (2009). The circulatory system. New York: Infobase Publishing. Williams, & Wilkins, (2010). Auscultation skills: Breath & heart sounds. Philadelphia: Wolters Kluwer/Lippincott Williams & Wilkins Health. Wilson, R. A., & Keil, F. C. (2001). The MIT encyclopedia of the cognitive sciences. Cambridge: MIT Press. Wundt, W., & Pintner, R. (1912). An introduction to psychology (Vol. xi). New York, NY: MacMillan Co. Yamada, T., & Meng, E. (2012). Practical guide for clinical neurophysiologic testing: EEG. Philadelphia: Lippincott Williams & Wilkins. Zhou, J., Sun, J., Chen, F., Wang, Y., Taib, R., Khawaji, A., et al. (2015). Measurable decision making with GSR and pupillary analysis for intelligent user interface. ACM Transactions on Computer–Human Interaction, 21(6), 35:1–35:27. doi:10.1145/2687926.
123