International Journal of Synthetic Emotions, 3(1), 1-17, January-June 2012 1. Copyright © 2012, IGI Global. .... moving a pointer on a scale. The fact that those.
International Journal of Synthetic Emotions, 3(1), 1-17, January-June 2012 1
Tracing Emotion: An Overview
Roddy Cowie, Queen’s University Belfast, UK Gary McKeown, Queen’s University Belfast, UK Ellen Douglas-Cowie, Queen’s University Belfast, UK
ABSTRACT Computational research with continuous representations depends on obtaining continuous representations from human labellers. The main method used for that purpose is tracing. Tracing raises a range of challenging issues, both psychological and statistical. Naive assumptions about these issues are easy to make, and can lead to inappropriate requirements and uses. The natural function of traces is to capture perceived affect, and as such they belong in long traditions of research on both perception and emotion. Experiments on several types of material provide information about their characteristics, particularly the ratings on which people tend to agree. Disagreement is not necessarily a problem in the technique. It may correctly show that people’s impressions of emotion diverge more than commonly thought. A new system, Gtrace, is designed to let rating studies capitalise on a decade of experience and address the research questions that are opened up by the data now available. Keywords:
Emotion, Emotional State, Gtrace, Perceived Effect, Tracing Emotion
INTRODUCTION A decade ago, our group used research on human emotion to argue that continuous representations were a natural tool for affective computing (Cowie et al., 2001). The idea has worn well, and there is growing interest in the problem of using signs in various modalities to construct a ‘trace’ that describes how a target person’s emotional state appears to be rising and falling from moment to moment. However, problems at the human end have been perhaps unexpectedly obstinate. Progress depends on databases that
provide traces reflecting human judgments, so that machines can use them as models. Acquiring suitable traces poses problems which are both substantial and interesting. The aim of this paper is to provide an overview of the issues involved in acquiring traces from human raters, and the techniques available to solve them. Among those is a new system for acquiring traces, Gtrace, designed to capitalise on the lessons described here. Some of the issues are well known in psychology, and are dealt with in sources such as Rosenthal (2005). Others are specific to the particular technique, and have not been dealt with in a systematic way before.
DOI: 10.4018/jse.2012010101 Copyright © 2012, IGI Global. Copying or distributing in print or electronic forms without written permission of IGI Global is prohibited.
2 International Journal of Synthetic Emotions, 3(1), 1-17, January-June 2012
BACKGROUND RESEARCH Tracing techniques emerged from a substantial body of research in psychology. Some features that people find strange at first sight are in fact grounded in long-established findings. First and simplest, traces almost always describe apparent emotion (or affect). It is naive to assume, as people sometimes seem to, that they ought to describe actual emotion (whatever that is). In the terms used by Cowie et al. (2001) they provide effect-type rather than cause-type descriptions – that is, they describe the expected effect of generating particular set of signs (facial, vocal, gestural, etc). That is a different task from describing either the signs themselves (as, for instance, FACS coding does); or the inner state that caused them to be emitted (which various self-report questionnaires are designed to do). There is nothing new or unsound about distinguishing between objective reality and subjective representations of it, and recognising that both can be important. It was established by 17th century philosophers (notably Locke). From the early 19th century, research addressed topics like colour and the mathematical relationship between objective and perceived brightness, weight, etc. It in turn made a major contribution to the emergence of psychology on one side, and technologies dealing with sound and light on the other (giving rise to tools such as the mel and sone scales, colour spaces, etc.). Given the size and sophistication of that research tradition, it is disconcerting that people still talk as if traces should be understood as more or less accurate measures of an objective ‘ground truth’ (presumably the person’s true emotion). The natural view is that their primary function is to capture the way observers perceive things. That is a different task, with its own challenges and uses. In the terms used by Rosenthal (2005), the topic is a BC link – the relationship between encoder behaviour and decoder judgment. Historically, there is a strong association between tracing and a representation that contrasts with everyday language. Day to day descriptions use categories that involve
rather complex combinations of attributes (for instance, “anger”, which Aristotle (1941, p. 1380) described elegantly as “a belief that we, or our friends, have been unfairly slighted, which causes in us both painful feelings and a desire or impulse for revenge”). It is tempting to assume that the proper way to describe emotion is in terms of categories like that: anything else is a poor substitute. However, when we study emotion in naturalistic situations, the general rule is that no one description quite fits (Cowie & Cornelius, 2003). Categories are like landmarks: most of emotional life is not exactly at any one landmark, but rather, at varying distances from several. Some recent research has used tracing in conjunction with everyday categories, and the paper considers later how successful that has been. However, most of the work that uses tracing in affective computing has followed up an implication of the idea that categories are like landmarks. It implies that beneath the categories lies a system of dimensions along which distances can be measured. Psychologists have been trying to draw out these implied dimensions since Wundt (Reisenzein, 1992), intuitively at first, but increasingly using various statistical techniques (Schlosberg, 1941). Four types of dimension have emerged with great regularity – valence, energy, power, and intensity. There have been intense debates about their status. They are clearly not simply independent. That is not a mistake, it is a fact of the way people represent emotion (see, for instance, Reisenzein (1994) on the relationship between intensity and the other dimensions). It is hotly disputed whether they should be considered bipolar or unipolar (Russell, 1979). There may be tradeoffs between valence and energy, which mean that it is impossible to be at extreme values of both simultaneously, leading to a naturally circular space (Russell, 1980). All of these issues are open to debate, but not to pronouncements based on pure intuition rather than understanding of the research from which standard positions emerged. People still tend to feel that dimensional representations of emotion are less fundamental
Copyright © 2012, IGI Global. Copying or distributing in print or electronic forms without written permission of IGI Global is prohibited.
International Journal of Synthetic Emotions, 3(1), 1-17, January-June 2012 3
than descriptions that are closer to everyday language, but there are striking counterindications. A good example is research on managing disturbing emotional memories. Pennebaker and Chung (2011) show that putting the memories into words helps to bring them under control. The implication that matters here is that the memories must originally exist in a non-verbal format. Dimensional descriptions suggest what that raw, non-verbal representation might be like. Russell and his colleagues (Feldman Barrett, & Russell, 1999) make a more specific claim about dimensional descriptions. They argue that they represent a particular component of emotional experience, the global feeling which has historically been called affect. There certainly are advantages to thinking of traces as a way of capturing affect, which pervades the person in general, rather than emotion in the philosophical sense, which attaches to a particular object (the person we are angry with, the place we regret leaving). Not the least of the advantages is that it highlights what dimensional traces cannot be expected to do. If I am interacting with somebody, then it matters to know whether his negative affect is directed at me or at my adversary. Straightforward traces not provide that kind of information, and if it is important, then they need to be supplemented in other ways. Capturing elusive dimensions of experience is a problem that arises in many areas of psychology, and a great deal is known about it. Psychometric techniques approach the problem by asking a battery of questions, and using a weighted average of responses to them as a measure of some underlying dimension. However, tracing is more closely related to a contrasting approach to measuring mental phenomena, psychophysics. Nineteenth century psychophysicists developed sophisticated experimental and mathematical techniques to measure subjective experience. They are still current, but there are mismatches between human responses and the scales they give rise to. Twentieth century psychophysicists found that direct questions about the intensity of experi-
ence gave results more in line with engineers’ experience. In a paper called “The Surprising Simplicity of Sensory Metrics”, Stevens (1962) showed that direct techniques gave robust results. There was very good agreement between reports of (for instance) apparent brightness based on question and answer techniques, and reports given by squeezing a handgrip, or moving a pointer on a scale. The fact that those techniques turn out to be effective, for all their ‘surprising simplicity’, prompted the development of trace techniques in our group. The tasks that Stevens advocated became known as ‘magnitude estimation’ tasks. The scales that they involve are not to be confused with the scales developed by questionnaire designers, who can design alternative responses to ensure that outcomes are mathematically tractable: they are dictated by the perceiver’s experience. Trace techniques also have a specific contrast with other forms of magnitude estimation, which is that responses can be emitted in a continuous stream. These characteristics produce a trade-off. The ability to record in real time has enormous advantages, not least because responses in interactions are likely to be based on instantaneous impressions of an ongoing display, and there is good reason not to assume that studying considered responses to brief extracts will reveal what those are like (Cauldwell, 2000; Sutton, 2011). The trade-off is that experimenters have less control: they have to live with the outputs that people can make in real time. Although trace techniques are an example of Stevens’ ‘surprising simplicity’ in some respects, the trade-off points to features that are anything but simple. People can externalise the subjective level of an attribute like loudness rapidly, and in various ways. They cannot do the same for an attribute like acoustic energy between 200 and 400Hz. The point is that some attributes are perceptually available in a way that others are not: and if we want to use means of reporting that people find natural, we can only learn about dimensions that they are equipped to report. One of the key problems with trace techniques is to discover the dimensions that are
Copyright © 2012, IGI Global. Copying or distributing in print or electronic forms without written permission of IGI Global is prohibited.
4 International Journal of Synthetic Emotions, 3(1), 1-17, January-June 2012
available to tap in that way. Further complexities arise when we consider more than one dimension at a time. Some combinations of dimensions function psychologically as the axes of a single space; others remain psychologically separate. In the first case, the dimensions are called integrable – the key property being that deciding where in the space a point lays is a single judgment. In the second, a separate decision is needed for each dimension (Garner, 1974). It is a clear implication of what has been said that some tracing tasks are inappropriate: they ask people to do the impossible. That poses the question of how to identify appropriate tasks. It should be clear that some seemingly obvious answers are unsatisfactory. The point has already been made that agreement with an objective ‘ground truth’ is generally an inappropriate test. If tracers uniformly agree that a display shows deepening concern, then that properly reflects the perceptual impression that such a display will generate. It is another matter whether the concern is real. If people want to know that, then they should look for other techniques (and take proper note of the reasons to doubt whether they exist, see National Research Council of the National Academies, 2003). The example highlights another criterion, which is agreement among tracers. If there is strong agreement, then there is a strong prima facie case for believing that a trace does capture a salient dimension of perceptual impressions. However, the converse does not always hold. Absence of agreement may mean that the scale is inappropriate for tracing: there is no easily available way to make the judgments being called for, and therefore people resort to various different sources in the effort to respond. However, divergence in the traces may also mean that people genuinely do respond differently to the display being traced; and differences between the traces are a faithful reflection of that fact. It would be a serious mistake to throw away tools that revealed that kind of divergence – not just a loss, but a systematic misrepresentation of the facts. The idea that people might perceive the same display of emotion differently is not
sheer speculation. On the contrary, there is good evidence that percepts vary with mood (Forgas & Bower, 1987), emotional intelligence (Mayer, Caruso, & Salovey, 1999) and culture (Sneddon, McKeown, McRorie, & Vukicevic, 2011). Those cannot be the whole story, because there is also evidence that people see different patterns in some displays even when they agree on the patterns in others (Cowie et al., 2010). The relevance of standard personality variables remains unclear. Thinking through the issues, a few options for validation stand out. One is that a trace technique should be trusted if it generates agreement when members of a relatively homogeneous group rate relatively unambiguous stimuli. Given that it is reasonable (though not failsafe) to assume that divergence elsewhere reflects genuine ambiguity in the display and/ or differences between the raters. The data summarised provide that kind of evidence for some traces. The other options depend in practice on collaboration between psychology and affective computing. One is confirmation by resynthesis. Traces can be used to generate descriptions in various modalities – emotion words, synthesised faces, schematic gestures, etc. Those can be replayed to the tracer along with the original display, for him/her to judge whether they are apt or not. Deeper, but more difficult, is looking at a user’s reactions to displays that have been synthesised using his/ her traces. For example, does he/she respond to a question asked by an avatar synthesised using his/her traces in the same way as to the display that he/she traced? That taps into the core question about traces, which is their ability to predict reactions.
THE DEVELOPMENT OF TRACE TECHNIQUES Given the background, it is not surprising that trace-like techniques emerged over a long period. The first study to report them systematically appears to have been Levenson and Gottman (1983). They asked married couples
Copyright © 2012, IGI Global. Copying or distributing in print or electronic forms without written permission of IGI Global is prohibited.
International Journal of Synthetic Emotions, 3(1), 1-17, January-June 2012 5
to rate the emotions that they had experienced during an interaction by watching a video of it, and turning a dial as they watched to indicate how positive or negative they had felt at the time. The analyses are still worth revisiting. For instance, they showed that lag in estimating the other partner’s emotion was not a constant: on the contrary, it was correlated with marital satisfaction. Research using the dial paradigm is summarised in Ruef and Levenson (2007). Although applications broadened, the main focus remained on the analysis of relationships, particularly marital relationships. More complex paradigms began to emerge in the 1990s, through teams in Australia and Ireland. Both were influenced by Russell’s (1980) argument that the bulk of variation in emotional life could be explained by two dimensions, valence and arousal/activation. Following Russell’s terminology, these will be called the core affect dimensions. The Sydney team, led by Schubert, studied affect and music, addressing questions such as which features of a musical composition or performance created particular emotional effects. Previous research had relied on a discrete emotions approach, giving people adjectives associated with keystrokes on a computer, which they pressed to indicate when each adjective applied (Namba, Kuwano, Hatoh, & Kato 1991). Problems with attention and cognitive load led Krumhansl (1997) to explore a trace methodology which asked, for instance, how the level of anger in a piece fluctuates. Krumhansl factor analysed these single dimension trace ratings of discrete adjectives and found a two factor structure with fear and tension loading positively on one factor and fear and happiness at opposite ends of the second factor—suggesting an underlying structure similar to Russell (1980). Schubert (1999) developed an interface called “two-dimensional emotionspace” or 2DES using the Russell’s core affect dimensions, and showed experimentally that it could give reliable ratings. The music research tradition is rich in methodological insights. It highlights the importance of distinguishing between the emotion
apparently expressed by a piece (which corresponds to the question asked by the Belfast team) and the emotion it evokes in a listener (which is much less stable). Music also lends itself to work on time-lag. For example, Luck et al. (2007) argue that the cognitive load involved in a two dimensional trace may result in increased lag between musical features and the corresponding participant response. With single dimensions, the lag characteristics differed according to dimension with a different pattern of lags for activity, pleasantness and strength dimensions depending on which type of musical feature they examined. The Belfast team aimed to develop tracing for more general applications. Like Schubert’s, their FEELtrace system recorded impressions on the two core affect dimensions simultaneously (Cowie et al., 2000). The technical differences reflect the different intended applications. Instead of music, where the user is attending to a purely audio input, they wanted users to report impressions evoked by audiovisual recordings. As a result, visual feedback from the device needed to be accessible at a glance. For that reason, FEELtrace incorporated multiple features designed to ensure that raters could take in the position and trajectory of the cursor effortlessly. The current position of the cursor was marked by a large disc. It was coloured in a way that related naturally to the emotion associated with its current position – red for pure negative, green for pure positive, yellow for pure active, dark blue for pure passive, with intermediate hues for intermediate positions. Its recent trajectory was marked by a ‘worm’ of gradually decreasing circles. There was a clear frame around the emotion space, with words describing extreme emotions at suitable positions on the periphery; and words describing high frequency emotional states (angry, sad, happy, etc.) were located at suitable positions within the frame to act as ‘landmarks’. Two particular concerns shaped the Belfast work. One was capturing the emotion conveyed by naturalistic material. Cowie and Cornelius (2003) argued very explicitly that traces based on dimensional theory were the most promis-
Copyright © 2012, IGI Global. Copying or distributing in print or electronic forms without written permission of IGI Global is prohibited.
6 International Journal of Synthetic Emotions, 3(1), 1-17, January-June 2012
ing way to deal with material characterised by subtle, continuously varying emotional colouring rather than clear-cut episodes of full-blown emotion. The second was with developing a database that would provide a picture of perceived emotion complete enough to be reusable for multiple purposes. Output annotated with FEELtrace has been made available, and used in a variety of studies (Cowie & Cornelius, 2003; Ioannou et al., 2005; McKeown et al., 2011; Osherenko, Andre, & Vogt, 2009; Caridakis, Karpouzis, Wallace, Kessous, & Amir, 2010). Since the early work, various systems have been developed that are conceptually similar to 2DES and FEELtrace. RTCRR was a replacement for the 2DES system (Schubert, 2007). EMuJoy (Nagel, Kopiez, Grewe, & Altenmüller, 2007) used the same two dimensional space anchored with the words positive, negative, arousing and calming, and their cursor used a worm and face smiling or frowning to signal valence with eyes more open or closed to signal arousal. The portable Audience Response Facility (pARF) (Stevens, Schubert, Morris, & Frear, 2009) offers both one and two dimensional measurement but takes the novel approach of implementing the response on Personal Digital Assistants (PDAs) with a handheld stylus as input device and collecting through communication responses using a centralized server. The portability makes it useful for audience situations.
Higher Dimensionality When completeness is an issue, it is clearly a problem that the core affect dimensions capture only some of the distinctions that people make among emotion-related states. It has long been recognised that a third dimension, related to power or control, is necessary to make quite fundamental distinctions (e.g., between fear and anger, which are both active and negative). It is incorporated in a dimensional scheme due to Mehrabian (1996) that has become wellknown in affective computing, the PleasureArousal-Dominance scheme, PAD for short (Note that the name PAD refers to measures
derived from a specific set of questions, and it is misleading to use it for measures derived in different ways – which traces certainly are.) Both Sydney and Belfast teams experimented with systems that allowed tracing in three dimensions simultaneously, but concluded that they were not satisfactory. The attempt to provide a single all-embracing device effectively ended when Fontaine, Scherer, Roesch, and Ellsworth (2007) made a strong case for considering a fourth dimension related to the expectedness or unexpectedness of events. A natural response was explored within the HUMAINE project. HUMAINE was a project, funded by the European Community, concerned with the general structure of emotion-oriented computing, and its main outcomes are reflected in the HUMAINE handbook (Petta, Pelachaud, & Cowie, 2010). As part of HUMAINE, Devillers, Cowie, and Martin (2006) used an adapted FEELtrace interface, with its strong feedback arrangements, to make traces on one dimension at a time. They used naturalistic clips taken from news broadcasts or discussions. Their tracers revisited each clip multiple times, providing traces not only for the core affect dimensions and power, but also two other types of descriptor. The first type considered descriptors concerned with the strength of the emotion rather than its identity. For example, one scale asked how intense it was; another whether the person was experiencing full-blown, or a weaker emotionrelated state, or was unemotional; another asked whether the person was masking emotion. The second type revisited a possibility which was raised in the introduction, which is to apply trace methodology to everyday category terms. For example, that kind of scale might ask how much anger the target person was feeling; how much happiness he/she was feeling; and so on. Tracing category terms was a possibility which had already been considered by a few studies. As noted earlier, Krumhansl (1997) had found that the information in trace ratings of discrete adjectives was effectively captured by two dimensions. Douglas-Cowie, Campbell, Cowie, and Roach (2003) had also compared the reliability of dimensional ratings and categorical
Copyright © 2012, IGI Global. Copying or distributing in print or electronic forms without written permission of IGI Global is prohibited.
International Journal of Synthetic Emotions, 3(1), 1-17, January-June 2012 7
Table 1. Distribution of inter-trace correlations for frequently used scales in Devillers et al. (2006) Scale
Proportion of trace pairs whose correlations were very –ve (r < – 0.5)
weakly –ve (–0.5< r 0.5)
intensity
0.00
0.03
0.08
0.89
true emotion/not
0.01
0.04
0.16
0.79
valence
0.13
0.00
0.17
0.70
activation
0.11
0.15
0.19
0.55
power
0.12
0.25
0.29
0.34
masking
0.11
0.24
0.32
0.33
acted
0.15
0.26
0.35
0.24
anxiety
0.00
0.25
0.25
0.50
sadness
0.19
0.06
0.25
0.50
anger
0.06
0.31
0.13
0.50
shock
0.00
0.50
0.00
0.50
helplessness
0.13
0.13
0.38
0.38
serenity
0.38
0.25
0.13
0.25
descriptions, and found the categorical descriptors gave less robust agreement. Such findings suggest that dimensional representations are the natural way to achieve a general-purpose, economical summary of the way emotion varies with time. But once it is clear that there are significant discriminations that are not captured by tracing the core affect dimensions, it is logical to ask how they can best be supplemented. Tracing categories may be as useful as tracing less robust dimensions. Table 1 shows the agreement between raters on the various scales reported by Devillers, Cowie, and Martin (2006). The format is designed to reveal patterns that standard formats mask. The unit of analysis is a correlation between the traces made by two raters viewing the same clip. The figures show how often the correlation indicated that the raters in questions formed similar impressions of the rise and fall of emotion in a clip, and how often they indicated contrasting pictures. Two levels of comment can be made. The first level of comment is that tracing clearly can be extended beyond the core affect
dimensions for affective interactions as well as music. The strongest agreement is on the intensity of emotion and whether it is full-blown. There is clearly better agreement on those and the core affect dimensions than on any of the everyday categories, but nevertheless, there is quite robust agreement on anxiety, and perhaps sadness and anger. The second of level of comment concerns the pattern of agreement and disagreement. Intensity and quality of emotion show the pattern one would hope for: almost all of the correlations are positive. But for many other items, a third or more of the correlations are negative, and substantial proportion strongly negative. The implication is that where one rater feels the person is (for example) most serene, the other feels s/he is least serene. It seems very likely that the very weak agreement on acting yields part of the explanation: one rater will judge signs of serenity to be real when another judges them to be an act, concealing quite the opposite. It is tempting to conclude that tracing should be confined to core affect and intensity, because the reliability of other traces is low. In
Copyright © 2012, IGI Global. Copying or distributing in print or electronic forms without written permission of IGI Global is prohibited.
8 International Journal of Synthetic Emotions, 3(1), 1-17, January-June 2012
the light of what was said earlier, that would be a mistake. It may be that people simply cannot use a trace methodology (or at least the methodology in this study) to report their impressions of (for instance) shock. However, it may also be that the traces reveal genuine divergence: where one person perceives shock, another perceives surface gestures with no great bearing on the person’s internal state. If so, affective computing needs to consider whose interpretation it will use as a model. It is worth noting an implication for research on individual differences in the perception of emotion. Research on individual differences using traces has almost always looked at valence and intensity, where the data suggest there is quite strong agreement, rather than traces that the data show are subject to large individual differences. The same study considered a third type of descriptor, drawn from appraisal theory as formulated by Scherer’s group (Sander, Grandjean, & Scherer, 2005), though not in a trace context (users made a binary decision as to whether a descriptor applied or not). Agreement on most of the appraisal constructs was low, with one notable exception: agreement on conduciveness to the individual’s goals was higher than on the valence-like constructs considered in the same exercise. The Devillers et al. (2006) study laid the groundwork for a paradigm that was developed in HUMAINE and later in its successor project, SEMAINE. It was concerned with building a system that could conduct emotionally coloured interactions. Its most relevant outcomes of are reflected in Schroeder et al. (2011) and McKeown et al. (2011). Douglas-Cowie et al. (2007) give details for the (smaller) HUMAINE study of tracing, and McKeown et al. (2011) describe the work on tracing in SEMAINE. To summarise the latter briefly, all raters were asked to trace the dimensions for which there was strong agreement here (intensity, valence and arousal) plus the other two that theory suggests are on a similar footing (power and conformity with expectation). In addition, for each clip, each rater identified at least four other descriptors that
s/he felt were appropriate from a list of options based partly on results from previous tracing exercises and partly on potential usefulness to affective computing. Data from the SEMAINE tracings are examined shortly, but before that, questions about analysis need to be considered.
Analysis Techniques Trace data is a mix of meaningful and effectively random events, and ways of separating them are clearly critical. That presents a range of problems. The main aim here is simply to make it clear that the topic is far from closed. The default techniques are correlation and averaging. Correlation (and its derivatives such as Cronbach’s alpha) provide a straightforward way of establishing that traces are not pure noise, and Sneddon et al. (2011) have shown that with large enough samples, averaging can reveal a remarkably stable average profile. Rosenthal (2005) provides a satisfying description of multiple statistical techniques which are common ground between tracing and other methods of studying judgment. For example, Kappa (Cohen, 1960, 1968) is widely used to evaluate categorical measures, and can be applied to categorical descriptions derived from traces, such as the quadrant measures used by Ioannou et al. (2005). The formation of composite variables is also a standard issue, and affects any attempt to form a more compact description from a number of raw traces. However, there are issues that are less standard. One set of issues surrounds temporal resolution. Ideally, the interval between points in a trace should be chosen so that meaningful responses by the tracer are captured, and uninformative activity between them is filtered out. Finding suitable intervals is not simple. Research on music suggests that the fastest emotion-related responses there take rather less than a second, and so Schubert (2010) recommends a sampling rate of at least 2Hz. It is not clear, though, to what extent that depends on the material and the dimension being traced:
Copyright © 2012, IGI Global. Copying or distributing in print or electronic forms without written permission of IGI Global is prohibited.
International Journal of Synthetic Emotions, 3(1), 1-17, January-June 2012 9
visual stimuli can evoke fear-related responses in the amygdala in about 12ms (LeDoux, 1998). Cowie and McKeown (2010) took a statistical approach to traces from SEMAINE, where raters watched audiovisual recordings of interactions. Their raw traces were sampled above 20Hz. Processed traces consisted of series of values, each of which was the average of the raw trace values during a particular time interval (which they called a bin). They reasoned that so long as variation within a ‘bin’ was effectively random, binning would remove noise, and therefore increase agreement between raters. For most dimensions, they found no effect of bin size in the range 0.1-3sec, which suggests that information is present at quite fine granularity. However, for expectation, reliability peaked strongly with bins in the region of about 2 seconds. Like the research on lag in music, that suggests we should not expect to find a single granularity that fits all scales: they have different natural time-constants. A related issue is the effect on correlations of the fact that traces are time series (Schubert, 2010). It is commonly said that correlations between time series inflate their relationship. In the case of smooth curves, that is clearly true, and it makes sense to downsample and make comparisons between smaller numbers of genuinely independent points. However, traces are often quite far from smooth. The largest available set of traces is due to Sneddon et al. (2011), and reanalysing those, the picture is that average inter-tracer correlations increase with downsampling up to intervals as large as 6secs (Cowie & Sawey, 2011). This reinforces the point that simple generalisations should be treated with caution. A different set of issues involves identifying informative features rather than considering traces as a whole. A promising approach is suggested by the ‘stylisation’ techniques used in phonetics (Shriberg, Stolcke, Hakkani-Tur, & Tur, 2000), where a pitch contour is reduced to rises, falls, and level stretches. Successful stylisation would have various uses, including locating significant features and distinguishing emotions which show different time courses,
such as swinging abruptly between high and low or building gradually (Hanratty, 2010). Rudimentary stylisation techniques were applied to the SEMAINE data, and they suggest that the distribution of rises and falls extracted by stylisation may contribute to distinguishing intensity traces in particular (Cowie & McKeown, 2010) (Table 2). A related idea is to ask about features that are either agreed by most tracers, or that occur more often than would be expected by chance. The two criteria suit different types of feature. The first, ‘consensus’ criterion has been applied to the possible relationships between pairs of points in a trace (A>B,A≈B, A0.6 – the lowest value commonly considered acceptable; ** indicates alpha>0.7 – almost always considered acceptable) Intensity
Valence
Activation
Power
Expectation
mean all
0.74
**
0.92
**
0.73
**
0.68
*
0.71
**
sd bins
0.83
**
0.75
**
0.65
*
0.61
*
0.68
*
max bin
0.74
**
0.92
**
0.73
**
0.68
*
0.71
**
median bin
0.72
**
0.91
**
0.72
**
0.67
*
0.68
*
min bin
0.23
0.9
**
0.43
0.43
0.43
AveMagnRise
0.74
**
0.49
0.53
0.39
0.58
SDMagnRise
0.74
**
0.6
0.63
*
0.32
0.59
MaxMagnRise
0.75
**
0.56
0.64
*
0.25
0.63
MedMagnRise
0.49
-0.02
0.26
0.3
0.47
MinMagnRise
0.07
0.08
0.3
0.24
0.16
AveMagnFall
0.68
*
0.45
0.55
0.55
0.51
SDMagnFall
0.66
*
0.45
0.63
MaxMagnFall
0.34
0.13
0.01
0.23
0.24
MedMagnFall
0.52
0.14
0.18
0.31
0.38
MinMagnFall
0.6
0.46
0.59
0.6
*
*
outlined above, though others are mentioned where it seems useful to do so. Table 2 displays the Cronbach’s alpha coefficients assessing the inter-rater reliability in each of the five main dimensions using functionals derived automatically from traces of SEMAINE database of clips (for example, mean, standard deviation, average magnitude of continuous rises, etc.). The robustness of the major dimensions seems increasingly hard to doubt, though work is clearly needed on the statistical methods that are best suited to make the most of the information. Note, for instance, that agreement on temporal features (particularly rises) seems to be quite strong in intensity, but weak in valence: that is potentially important for continuous modelling. It is much less clear how much is to be gained from extending tracing to non-dimensional descriptors (i.e., those that are derived by asking how much of a certain discrete emotion is observed).
*
0.6
*
*
*
0.49
0.41
Some things can be learned from the SEMAINE database. In the SEMAINE project raters were asked to choose four from a range of twenty-seven categories that best described people interacting with four conversational agents. These categories included discrete emotions and communication related categories. The major question about categories with a strong affective component is how often they apply particularly well. Table 3 shows that in the SEMAINE material, only amusement applies at all often across the board. The qualification is that the frequency of discrete emotions rises in certain contexts. SEMAINE varies context by using four agents: Obadiah, who is gloomy; Poppy, who is happy-go-lucky; Prudence, who is steadily sensible; and Spike, who is angry. Quite substantial numbers of people show something that is categorised as happiness in response to Poppy, and sadness in response to Obadiah. Even so, the data reinforce the point made earlier that category words like these function as landmarks, and most of emotional
Copyright © 2012, IGI Global. Copying or distributing in print or electronic forms without written permission of IGI Global is prohibited.
International Journal of Synthetic Emotions, 3(1), 1-17, January-June 2012 11
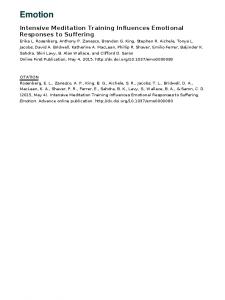
Figure 1. Time course of perceived Intensity for the same clip rated by groups displaying contrasting rating styles: phasic and tonic
life occupies ground that lies some distance from any landmark. The communication-related categories were used more regularly, as Table 4 shows. Even so, the numbers are low. The practical issue is whether it is useful to set raters to trace qualities which, if this evidence is representative, are absent around 90% of the time. The answer depends partly on agreement between raters about the shape of traces. That is hard to gauge from SEMAINE data, because any given category was not always applied to the same clip. Hence a follow-up study asked seven raters to identify a subset of the SEMAINE categories that they would all use for clips showing confrontations. Table 5 summarises the averages of the correlations between each rater’s traces and
each other rater’s for three selected items. Tension, which Krumhansl (1997) studied in the context of music, is rather consistently rated, and it is another candidate for routine integration into trace descriptions of interactions. But although people agree that amusement occurs frequently, rater agreement on it is quite low. That suggests either that impressions of amusement are not amenable to tracing, or that people’s impressions of amusement differ substantially – at least with the material that was traced here. The study provides a striking illustration of the reason for taking the possibility of individual differences seriously. The traces in Figures 1 and 2 are for intensity, which in general is among the most consistently rated dimensions, on one of the clips. With this material, though, raters divide into two groups,
Copyright © 2012, IGI Global. Copying or distributing in print or electronic forms without written permission of IGI Global is prohibited.
12 International Journal of Synthetic Emotions, 3(1), 1-17, January-June 2012
Table 3. Most frequently chosen discrete emotion descriptors, and the % of clips for which they were chosen (figures are % of time chosen; the categories are not exhaustive) Character
Obadiah
Poppy
Prudence
Spike
Amusement
8
14
13
12
At Ease
5
6
7
9
Happiness
2
15
5
1
Sadness
13
1
1
0
Anger
1
0
2
8
which it is natural to interpret in terms of two styles of responding: ‘phasic’, where response is to relatively short-lived bursts of expression; and ‘tonic’, where response is to an inferred state that changes relatively slowly (Figure 1). A similar tonic/phasic distinction appeared to be present for other clips and dimensions, though not always as clear-cut. Once that kind of difference is identified, it is easy to imagine various techniques that might be used to explore it, and perhaps to obtain not one, but two useful types of information from traces. Reviewing the material that currently exists, the natural conclusion is that research on trace techniques is placed to move to a new level. There is a degree of consensus across studies on dimensions that can be traced relatively reliably with relatively unambiguous material. That opens up the way to address a range of subtler issues, involving traceability of more specific descriptors, the ambiguities associated with some material, and inter-rater differences. Addressing the last two depends on statistical
techniques that are not concerned solely with inter-rater agreement.
Response Modalities The issue of response modality has been touched upon at various points, but it is worth pulling the issues together explicitly. Various interfaces have been used. There are two main issues - the extent to which they divert attention from the material to be traced, and the extent to which they promote consistency. When the task is to report the emotional content of music, it makes sense to use interfaces which require sustained visual attention. For example, the ‘dynamic judgment’ techniques of Grandjean et al. (2011) ask users to trace a curve which reflects one dimension of the emotional content of music. Schubert and his team (1999, 2007) have used two-dimensional interfaces that presuppose sustained visual attention. At the other extreme, some devices have been used to provide responses without
Table 4. The most frequently chosen communication-related categories, and the % of clips for which they were chosen (figures are % time chosen; the categories are not exhaustive) Character
Obadiah
Poppy
Prudence
Spike
Gives Information
10
20
19
9
Agreeing
15
11
15
15
Gives Opinion
12
7
9
11
Thoughtful
10
9
8
4
Certain
4
5
9
4
Interested
3
3
2
2
Copyright © 2012, IGI Global. Copying or distributing in print or electronic forms without written permission of IGI Global is prohibited.
International Journal of Synthetic Emotions, 3(1), 1-17, January-June 2012 13
Table 5. Average correlations between rater traces Rater
Amusement
Antagonism
Tension
1
0.18
0.05
0.26
2
0.22
0.37
0.54
3
0.17
0.4
0.47
4
0.27
0.24
0.47
5
0.19
0.32
0.35
6
0.34
0.34
0.4
7
0.28
0.36
0.55
Average of rater correlations
0.23
0.3
0.43
encroaching on visual attention at all. The dial format used by Levenson and Gottman (1983) is an early example. Cowie et al. (2011) carried the principle to a logical conclusion by using a slider with force feedback, in which complete emotional engagement was signalled by no pressure on the slider, and complete disengagement by maximum pressure. The logic was that people who were totally engaged would ignore the secondary task anyway, so that the instructions worked with natural inclinations rather than against them. Between the two, a variety of interfaces have tried to provide visual feedback, but in a form accessible enough for users to register where they were on the scale at a glance, and therefore not to interfere with attention to the material to be rated – particularly (but not only) if it is visual. That category includes FEELtrace and its decendants, including Gtrace, which is described below. It also includes the system described by Messinger et al. (2008), in which raters use a joystick to move a cursor over a colour-coded scale. It seems fair to say that very little is known about the relative merits of the various styles of interface. Certainly interfaces of the last type produce very reliable ratings of some dimensions, particularly valence. That is true whether the stimulus is purely auditory, purely visual, or audiovisual (Savvidou, 2011). It would seem to follow that if ratings of other dimensions are
less reliable; it is not because of the interface. On the other hand, it is possible that the cues need to make judgments on other dimensions are more easily disrupted by demands on visual attention. The issue invites research.
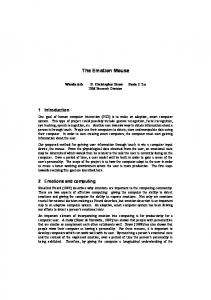
Towards a Standard Platform Until recently, one of the obstacles to development has been lack of standard instrumentation. Because the methods developed through HUMAINE and SEMAINE are relatively well tested and well known, they are a potential standard. Gtrace (for General trace) was developed with that in mind. Gtrace is designed to be the successor to FEELtrace and related programs (Cowie et al., 2000, 2010). The package includes the scales that were used in SEMAINE, on which information is available, but it is designed to let people create their own scales with minimum effort, much as they could create their own items for a questionnaire. The basic form of Gtrace rating is illustrated in Figure 2. On one side of the computer screen, raters see a recording that shows the video to be rated. On the other, they see a cursor that they can manipulate. In FEELtrace style, it takes the form of a coloured disc, which they can move on a left-right dimension. Cursor position is recorded as fast as the machine allows, leaving decisions about appropriate sampling intervals to the user.
Copyright © 2012, IGI Global. Copying or distributing in print or electronic forms without written permission of IGI Global is prohibited.
14 International Journal of Synthetic Emotions, 3(1), 1-17, January-June 2012
Figure 2. Screen shot from Gtrace
The cursor moves within a clearly marked rectangle, which has markers associated with it. There are usually light vertical lines dividing the rectangle into equal parts (halves, thirds, quarters, etc.). All the scales provided with Gtrace have text at each end of the rectangle, to indicate what the extremes of the scale mean. They usually also have a label associated with each dividing line. They may also have a caption that defines the attribute under consideration. The colour of the cursor usually changes as it moves along the scale, in a way that goes naturally with the meaning of the scale. For example, in the valence scale included with Gtrace, the cursor is pure red at the negative extreme, and pure green at the positive extreme. It leaves a ‘tail’ behind it, in the form of circles that show where it was recently, and shrink away over time. Again, as in FEELtrace, the point of all these devices is to help raters to understand the scale in the way that was intended. It should be clear from previous sections that useful new scales probably remain to be discovered. That is why Gtrace allows for the construction of new scales. However, there is a strong argument for using preformed scales and procedures where they do exist. Scales that are nominally the same, but use different definitions of the endpoints and internal landmarks, can produce materially different results – and therefore procedures developed on traces made with one set may not transfer well to traces made with another. The preformed scales that come with the Gtrace program include the dimen-
sions considered in Table 2, and the category terms considered in Tables 3, 4, and 5. Data on the others is available in (Cowie & McKeown, 2010). The experimenter can either determine in advance which scales are to be used (as in the confrontation study described in Table 5) or allow raters choice, partial (as in the SEMAINE study) or complete. Gtrace runs under current versions of Windows, and the code is available to allow customising and updates. It is one of the labelling tools in the HUMAINE toolbox (http:// emotion-research.net/toolbox), and can be downloaded from there.
PROSPECTS Comparisons were made earlier between tracing and numerical questionnaire techniques. The differences were emphasised, but nevertheless, the two are parallel in interesting respects – methods of eliciting numerical descriptions of people’s impressions, with potentially a very wide range of applications. One of the interesting parallels is that questionnaire users quickly developed a very substantial body of research on their properties, psychological and mathematical. Because of the differences, conclusions do not transfer directly from questionnaire research. The parallel is that similar developments are needed if the potential of tracing is to be realised. The development has not taken place partly because focusing on areas with relatively
Copyright © 2012, IGI Global. Copying or distributing in print or electronic forms without written permission of IGI Global is prohibited.
International Journal of Synthetic Emotions, 3(1), 1-17, January-June 2012 15
specific needs – such as marriage guidance or music – does not obviously demand it. Providing traces for use in affective computing brings a broader range of challenges to the fore. Even so, it has only recently become apparent that the challenges define a substantial research area rather than simply obstacles to be overcome. This paper is the first to articulate that understanding. Carrying the development forward depends on a partnership between psychology per se and application areas, of which affective computing is currently the most challenging. Psychologists need the spur of practical demands to meet: computing needs insight into what the material available to it actually means, and the refinements that are and are not possible. It promises to be a lively partnership.
REFERENCES Aristotle. (1941). Rhetoric. In McKeon, R. (Ed.), The basic works of Aristotle. New York, NY: Random House. Caridakis, G., Karpouzis, K., Wallace, M., Kessous, L., & Amir, N. (2010). Multimodal user’s affective state analysis in naturalistic interaction. Journal on Multimodal User Interfaces, 3, 49–66. doi:10.1007/ s12193-009-0030-8 Cauldwell, R. T. (2000). Where did the anger go? The role of context in interpreting emotion in speech. In Proceedings of the ISCA Workshop on Speech and Emotion, Newcastle, Northern Ireland. Cowie, R., Camurri, A., & Glowinski, D. (2011). SIEMPRE deliverable D4.1 - Results from the first series of experiments and first evaluation report. Retrieved from http://www.siempre.infomus.org/ assets/Deliverables/WP4/SIEMPRE-D41.pdf Cowie, R., & Cornelius, R. (2003). Describing the emotional states that are expressed in speech. Speech Communication, 40(1-2), 5–32. doi:10.1016/S01676393(02)00071-7 Cowie, R., Cox, C., Martin, J.-C., Batliner, A., Heylen, D., & Karpouzis, K. (2010). Issues in data labelling. In Cowie, R., Pelachaud, C., & Petta, P. (Eds.), Emotion-oriented systems: The humaine handbook (pp. 213–241). Berlin, Germany: Springer-Verlag.
Cowie, R., Douglas-Cowie, E., Savvidou, S., McMahon, E., Sawey, M., & Schroder, M. (2000). “FEELTRACE”: An instrument for recording perceived emotion in real time. In Proceedings of the ISCA Workshop on Speech and Emotion, Newcastle, Northern Ireland. Cowie, R., Douglas-Cowie, E., Tsapatsoulis, N., Votsis, G., Kollias, S., Fellenz, W., & Taylor, J. G. (2001). Emotion recognition in human-computer interaction. IEEE Signal Processing Magazine, 18(1), 32–80. doi:10.1109/79.911197 Cowie, R., & McKeown, G. (2010). Statistical analysis of data from initial labelled database and recommendations for an economical coding scheme. Retrieved from http://www.semaine-project.eu/ Cowie, R., & Sawey, M. (2011). GTrace [Software Manual]. Retrieved from The HUMAINE Portal website: http://emotion-research.net/toolbox/toolboxlabellingtool.2011-07-08.0084929013 Devillers, L., Cowie, R., & Martin, J. (2006). Real life emotions in French and English TV video clips: an integrated annotation protocol combining continuous and discrete approaches. In Proceedings of the 5th International Conference on Language Resources and Evaluation, Genoa, Italy. Douglas-Cowie, E., Campbell, N., Cowie, R., & Roach, P. (2003). Emotional speech: Towards a new generation of databases. Speech Communication, 40, 33–60. doi:10.1016/S0167-6393(02)00070-5 Douglas-Cowie, E., Cowie, R., Sneddon, I., Cox, C., Lowry, O., McRorie, M., et al. (2007). The HUMAINE database: Addressing the collection and annotation of naturalistic and induced emotional data. In A. C. R. Paiva, R. Prada, & R. W. Picard (Eds.), Proceedings of the Second International Conference on Affective Computing and Intelligent Interaction (LNCS 4738, p. 450-488). Feldman Barrett, L., & Russell, J. A. (1999). The structure of current affect: Controversies and emerging consensus. Current Directions in Psychological Science, 8(1), 10–14. doi:10.1111/1467-8721.00003 Fontaine, J. R., Scherer, K. R., Roesch, E. B., & Ellsworth, P. (2007). The world of emotions is not two-dimensional. Psychological Science, 18(2), 1050–1057. doi:10.1111/j.1467-9280.2007.02024.x Forgas, J., & Bower, G. H. (1987). Mood effects on person-perception judgments. Journal of Personality and Social Psychology, 53(1), 53–60. doi:10.1037/0022-3514.53.1.53
Copyright © 2012, IGI Global. Copying or distributing in print or electronic forms without written permission of IGI Global is prohibited.
16 International Journal of Synthetic Emotions, 3(1), 1-17, January-June 2012
Garner, W. R. (1974). The processing of information and structure. Mahwah, NJ: Lawrence Erlbaum. Grandjean, D., Torres-Eliard, K., & Labbe, C. (2011). SIEMPRE deliverable D2.1 - First series of experiments. Retrieved from http://www.linkedheritage. eu/getFile.php?id=229 Hanratty, J. M. (2010). Individual and situational differences in emotional expression (Unpublished doctoral dissertation). Queen’s University, Belfast, UK. Ioannou, S., Raouzaiou, A., Tzouvaras, V., Mailis, T., Karpouzis, K., & Kollias, K. (2005). Emotion recognition through facial expression analysis based on a neiurofuzzy network. Neural Networks, 18, 423–436. doi:10.1016/j.neunet.2005.03.004 Krumhansl, C. (1997). An exploratory study of musical emotions and psychophysiology. Canadian Journal of Experimental Psychology, 51(4), 336–353. doi:10.1037/1196-1961.51.4.336 LeDoux, J. E. (1998). The emotional brain: the mysterious underpinnings of emotional life. New York, NY: Touchstone. Levenson, R. W., & Gottman, J. M. (1983). Marital interaction: physiological linkage and affective exchange. Journal of Personality and Social Psychology, 45(3), 587–597. doi:10.1037/0022-3514.45.3.587 Luck, G., Toiviainen, P., Erkkila, J., Lartillot, O., Riikkila, K., & Makela, A. (2007). Modelling the relationships between emotional responses to, and musical content of, music therapy improvisations. Psychology of Music, 36(1), 25–45. doi:10.1177/0305735607079714 Mayer, J., Caruso, D., & Salovey, P. (1999). Emotional intelligence meets traditional standards for an intelligence. Intelligence, 27(4), 267–298. doi:10.1016/ S0160-2896(99)00016-1 McKeown, G., Valstar, M., Cowie, R., Pantic, M., & Schröder, M. (2012). The SEMAINE database: annotated multimodal records of emotionally coloured conversations between a person and a limited agent. IEEE Transactions on Affective Computing, 3(1). doi:10.1109/T-AFFC.2011.20 Mehrabian, A. (1996). Pleasure-arousal-dominance: A general framework for describing and measuring individual differences in temperament. Current Psychology (New Brunswick, N.J.), 14(4), 261–292. doi:10.1007/BF02686918
Messinger, D. S., Cassel, T., Acosta, S., Ambadar, Z., & Cohn, J. F. (2008). Infant smiling dynamics and perceived positive emotion. Journal of Nonverbal Behavior, 32, 133–155. doi:10.1007/s10919-0080048-8 Nagel, F., Kopiez, R., Grewe, O., & Altenmüller, E. (2007). EMuJoy: Software for continuous measurement of perceived emotions in music. Behavior Research Methods, 39(2), 283–290. doi:10.3758/ BF03193159 National Research Council of the National Academies. (2003). The polygraph and lie detection. Washington, DC: National Academies Press. Osherenko, A., Andre, E., & Vogt, T. (2009). Affect sensing in speech: Studying fusion of linguistic and acoustic features. In Proceedings of the IEEE International Conference on Affective Computing and Intelligent Interfaces, Amsterdam, The Netherlands. Pennebaker, J. W., & Chung, C. K. (2011). Expressive writing connections to physical and mental health. In Friedman, H. S. (Ed.), Oxford handbook of health psychology (pp. 1–31). New York, NY: Oxford University Press. Petta, P., Pelachaud, C., & Cowie, R. (Eds.). (2010). Emotion-oriented systems: The humaine handbook. Heidelberg, Germany: Springer-Verlag. Reisenzein, R. (1992). A structuralist reconstruction of Wundt’s three-dimensional theory of emotion. In Westmeyer, H. (Ed.), The structuralist program in psychology: Foundations and applications (pp. 141–189). Toronto, ON, Canada: Hogrefe & Huber. Reisenzein, R. (1994). Pleasure-arousal theory and the intensity of emotions. Journal of Personality and Social Psychology, 67(3), 525–539. doi:10.1037/0022-3514.67.3.525 Rosenthal, R. (2005). Conducting judgment studies: Some methodological issues. In Harrigan, J., Rosenthal, R., & Scherer, K. (Eds.), New handbook of methods in nonverbal behavior research. Oxford, UK: Oxford University Press. Ruef, A. M., & Levenson, R. W. (2007). Continuous measurement of emotion: The affect rating dial. In Coan, J. A., & Allen, J. J. B. (Eds.), Handbook of emotion elicitation and assessment. Oxford, UK: Oxford University Press. Russell, J. (1979). Affective space is bipolar. Journal of Personality and Social Psychology, 37(3), 345–356. doi:10.1037/0022-3514.37.3.345
Copyright © 2012, IGI Global. Copying or distributing in print or electronic forms without written permission of IGI Global is prohibited.
International Journal of Synthetic Emotions, 3(1), 1-17, January-June 2012 17
Russell, J. A. (1980). A circumplex model of affect. Journal of Personality and Social Psychology, 39(6), 1161–1178. doi:10.1037/h0077714 Sander, D., Grandjean, D., & Scherer, K. (2005). A systems approach to appraisal mechanisms in emotion. Neural Networks, 18(4), 317–352. doi:10.1016/j.neunet.2005.03.001 Savvidou, S. (2011). Validation of the FEELtrace tool for recording impressions of expressed emotion (Unpublished doctoral dissertation). School of Psychology, Queen’s University, Belfast, UK. Schlosberg, H. (1941). A scale for the judgment of facial expressions. Journal of Experimental Psychology. General, 29(6), 497–510.
Schubert, E. (2010). Continuous self-report methods. In Juslin, P. N., & Sloboda, J. (Eds.), Handbook of music and emotion (pp. 223–253). New York, NY: Oxford University Press. Shriberg, E., Stolcke, A., Hakkani-Tur, D., & Tur, G. (2000). Prosody-based automatic segmentation of speech into sentences and topics. Speech Communication, 32, 127–154. doi:10.1016/S01676393(00)00028-5 Sneddon, I., McKeown, G., McRorie, M., & Vukicevic, T. (2011). Cross-cultural patterns in dynamic ratings of positive and negative natural emotional behaviour. PLoS ONE, 6(2), e14679. doi:10.1371/ journal.pone.0014679
Schröder, M., Bevacqua, E., Cowie, R., Eyben, F., Gunes, H., Heylen, D., Maat, M. T., et al. (2012). Building autonomous sensitive artificial listeners. IEEE Transactions on Affective Computing doi:10.1109/T-AFFC.2011.34
Stevens, C., Schubert, E., Morris, R., & Frear, M. (2009). Cognition and the temporal arts: Investigating audience response to dance using PDAs that record continuous data during live performance. International Journal of Human-Computer Studies, 67, 800–813. doi:10.1016/j.ijhcs.2009.06.001
Schubert, E. (1999). Measuring emotion continuously: Validity and reliability of the two-dimensional emotion-space. Australian Journal of Psychology, 51(3), 154–165. doi:10.1080/00049539908255353
Stevens, S. (1962). The surprising simplicity of sensory metrics. The American Psychologist, 17(1), 29–39. doi:10.1037/h0045795
Schubert, E. (2007). Real time cognitive response recording. In Proceedings of the International Conference on Music Communication Science, Sydney, Australia.
Sutton, J. (2011). An emotional snapshot. The Psychologist, 24(8), ii–iii.
Copyright © 2012, IGI Global. Copying or distributing in print or electronic forms without written permission of IGI Global is prohibited.