Capturing, Indexing, Clustering, and Retrieving System History Ira Cohen, Steve Zhang1, Moises Goldszmidt, Julie Symons, Terence Kelly, Armando Fox1 Internet Systems and Storage Laboratory HP Laboratories Palo Alto HPL-2005-158 August 30, 2005*
system performance, Bayesian networks, information retrieval, problem signatures
We present a method for automatically extracting from a running system an indexable signature that distills the essential characteristic from a system state and that can be subjected to automated clustering and similarity-based retrieval to identify when an observed system state is similar to a previously-observed state. This allows operators to identify and quantify the frequency of recurrent problems, to leverage previous diagnostic efforts, and to establish whether problems seen at different installations of the same site are similar or distinct. We show that the naive approach to constructing these signatures based on simply recording the actual "raw" values of collected measurements is ineffective, leading us to a more sophisticated approach based on statistical modeling and inference. Our method requires only that the system's metric of merit (such as average transaction response time) as well as a collection of lower-level operational metrics be collected, as is done by existing commercial monitoring tools. Even if the traces have no annotations of prior diagnoses of observed incidents (as is typical), our technique successfully clusters system states corresponding to similar problems, allowing diagnosticians to identify recurring problems and to characterize the "syndrome" of a group of problems. We validate our approach on both synthetic traces and several weeks of production traces from a customer-facing geoplexed 24 X 7 system; in the latter case, our approach identified a recurring problem that had required extensive manual diagnosis, and also aided the operators in correcting a previous misdiagnosis of a different problem.
* Internal Accession Date Only Computer Science Department, Stanford University, Palo Alto, CA 94305, USA Published in and presented at Symposium on Operating Systems Principles 2005 (SOSP 2005), 23-26 October 2005, Brighton, UK Approved for External Publication © Copyright 2005 ACM 1
Capturing, Indexing, Clustering, and Retrieving System History Ira Cohen1
[email protected]
Steve Zhang2
[email protected]
Julie Symons1
[email protected]
Terence Kelly1
[email protected]
1
Hewlett-Packard Laboratories 1501 Page Mill Road Palo Alto, CA 94304 USA
2
Moises Goldszmidt1
[email protected] Armando Fox2
[email protected]
Computer Science Department Stanford University Palo Alto, CA 94305 USA
ABSTRACT
Categories and Subject Descriptors
We present a method for automatically extracting from a running system an indexable signature that distills the essential characteristic from a system state and that can be subjected to automated clustering and similarity-based retrieval to identify when an observed system state is similar to a previously-observed state. This allows operators to identify and quantify the frequency of recurrent problems, to leverage previous diagnostic efforts, and to establish whether problems seen at different installations of the same site are similar or distinct. We show that the naive approach to constructing these signatures based on simply recording the actual “raw” values of collected measurements is ineffective, leading us to a more sophisticated approach based on statistical modeling and inference. Our method requires only that the system’s metric of merit (such as average transaction response time) as well as a collection of lower-level operational metrics be collected, as is done by existing commercial monitoring tools. Even if the traces have no annotations of prior diagnoses of observed incidents (as is typical), our technique successfully clusters system states corresponding to similar problems, allowing diagnosticians to identify recurring problems and to characterize the “syndrome” of a group of problems. We validate our approach on both synthetic traces and several weeks of production traces from a customer-facing geoplexed 24 × 7 system; in the latter case, our approach identified a recurring problem that had required extensive manual diagnosis, and also aided the operators in correcting a previous misdiagnosis of a different problem.
C.4 [Performance of Systems]: Modeling Techniques
Permission to make digital or hard copies of all or part of this work for personal or classroom use is granted without fee provided that copies are not made or distributed for profit or commercial advantage and that copies bear this notice and the full citation on the first page. To copy otherwise, to republish, to post on servers or to redistribute to lists, requires prior specific permission and/or a fee. SOSP’05, October 23–26, 2005, Brighton, United Kingdom. Copyright 2005 ACM 1-59593-079-5/05/0010 ...$5.00.
General Terms Algorithms, Performance, Experimentation
Keywords Bayesian networks, clustering, information retrieval, performance objectives, signatures “Those who cannot remember the past are condemned to repeat it.” — George Santayana
1.
INTRODUCTION
When complex software systems misbehave—whether they suffer a partial failure, violate an established service-level objective (SLO), or otherwise respond in an unexpected way to workload—understanding the likely causes of the problem can speed repair. While a variety of problems can be solved by simple mechanisms such as rebooting [3], many cannot, including problems related to a misallocation or shortage of resources that leads to a persistent performance problem or other anomaly that can be addressed only by a nontrivial configuration change. Understanding and documenting the likely causes of such problems is difficult because they often emerge from the behavior of a collection of low-level metrics such as CPU load, disk I/O rates, etc., and therefore simple “rules of thumb” focusing on a single metric are usually misleading [5]. Furthermore, today there is no systematic way to leverage past diagnostic efforts when a problem arises, even though such efforts may be expensive and are on the critical path of continued system operation. To that end we would like to be able to recognize and retrieve similar problem instances from the past. If the problem was previously resolved, we can try to justify the diagnosis and perhaps even apply the repair actions. Even if the problem remained unresolved, we could gather statistics regarding the frequency or even periodicity of the recurrence of that problem, accumulating necessary information for prioritizing or escalating diagnosis
(a) How can we determine that our signatures are indeed capturing the system state, that is, that the information contained in them effectively serves as a “fingerprint” of a high-level system condition of interest such as a performance anomaly? (b) How can we verify that clustering (based on these signatures) is meaningful, that is, that signatures that are similar according to some similarity metric are fingerprints of problems whose diagnoses are similar? (c) How can we evaluate the quality of retrieval, that is, how can we verify that a query to retrieve similar signatures is returning a high percentage of actual matches with a low false positive rate?
and repair efforts. In order to do these things, we must be able to extract from the system an indexable description that both distills the essential system state associated with the problem and that can be formally manipulated to facilitate automated clustering and similarity based search. Meeting these requirements would enable matching an observed behavior against a database of previously observed ones both for retrieval and determining whether the problem is a recurrent one. Our contributions are as follows: 1. A formal representation or signature that captures the essential state of an enterprise system and is effective for clustering and similarity based retrieval using known techniques from pattern recognition and information retrieval [6]. We show that the construction of an effective signature is nontrivial—the naive approach yields poor clustering and retrieval behaviors, but good results are obtained with an approach based on our prior successful use of statistical methods to capture relationships between low-level system metrics and high-level behaviors [22, 5]. 2. The use of this representation to cluster and identify performance problems, and compute statistics about the frequency of their occurrence. This in turn lets an operator distinguish a recurrent condition from a transient or first-time condition, and even annotate the corresponding signature(s) with a repair procedure or other explanation for future reference when the same problem recurs. 3. A demonstration of how the representation and clustering can be used across different sites to aid diagnosis. Our experimental validation is conducted on a realistic testbed with injected performance faults, and on production traces from several weeks of operation of a real customerfacing Web application in our organization. The rest of the paper is organized as follows. Section 2 outlines our approach and methodology and provides some background on the statistical modeling technique used. Section 3 describes both our controlled testbed and the production traces used in our experiments. Section 4 presents our results. Specifically, Section 4.1 compares three methods of signature construction. Section 4.2 illustrates the use of our method for identifying recurrent problems in a real production environment. Section 4.3 shows that signatures can be leveraged across sites. In Section 5 we review related work. We discuss some caveats and ramifications in Section 6 and offer concluding remarks in Section 7.
2. PROBLEM STATEMENT, APPROACH, AND METHODOLOGY We address three problems: 1. Signature construction: What representation should we use to capture the essentials of the system state and enable clustering (grouping) and retrieval? 2. Discovery and exploration: How do we facilitate the identification of recurrent issues and the retrieval of similar problems? 3. Evaluation methodology:
The evaluation in particular has high practical importance: since our intent is to facilitate the exploration of the past history of the system to identify recurrent problems and similar situations in different systems, the users of our technology (system operators) must be confident that problem instances reported as belonging to the same group or cluster are indeed related. This is why our evaluation criteria are defined operationally, e.g., to say that clustering is “meaningful” is to say that similar signatures do indeed identify problems with similar root-cause diagnoses in practice. Without loss of generality, when we refer to an “Internet service” in the following discussion, we mean an externalrequest-driven, interactive application based on the standard three-tier architecture [7] of a stateless Web server, a tier containing application logic possibly running on top of a middleware platform, and a persistence tier containing one or more databases.
2.1
Sketch of the Approach
We assume the system’s operational policy defines one or more reference metrics (average response time, request throughput, etc.) and a threshold on each of these metrics (or a threshold over a collection of metrics). These reference metrics and the thresholds define a service level objective or SLO. We say the system is in violation of its SLO if the metric(s) exceed the policy threshold, and in compliance with its SLO otherwise. The SLO may be defined as an aggregate, for example, “at least 60% of requests during a 5-minute interval have a response time less than T ”.1 Our ultimate objective is to understand the underlying causes of high-level system behavior and how these causes manifest as SLO violation or compliance. We concentrate on the questions stated above of identifying recurrent performance issues, and the automatic retrieval of similar problems. We begin by evaluating several candidates for representations of the essentials of the system state, which we call signatures. We then evaluate the use of automated clustering [6] for grouping SLO violations in terms of their signatures, identifying recurrent problems, and exposing collections of metrics that together can become a syndrome of a performance problem. We then evaluate information retrieval techniques for finding signatures based on similarity [20]. This ability will enable an operator to search 1 Note that even SLOs expressed in terms of performance are deeply connected to availability, because availability problems often manifest early as performance problems and because understanding how different parts of the system affect availability is a similar problem to understanding how different parts of the system affect high-level performance.
databases indexed with signatures and find past occurrences of similar problems. This in turn will allow the operator to leverage past diagnoses and repair efforts. In our evaluation we will use data from traces collected from both a realistic testbed and workload, and from a production system that has suffered several SLO violations over a period of three months. In the case of the testbed we run the system and periodically inject specific faults in order to trigger SLO violations. The testbed enables us to annotate each SLO violation with its root cause, providing ground truth for verifying the results of the automated clustering and of similarity retrieval. For the real application, we have annotations for only a subset of the instances of SLO violations, and therefore it is only in these instances that we will verify the use of information retrieval techniques. We will define in Section 2.3 a notion called purity that will enable us to evaluate the use clustering even in cases with partial annotations. Note that whether annotations are available or not, clustering enables us to group SLO violations in terms of similar signatures, and discover different types of SLO violation instances, recurrent problems, etc. Similarly, retrieval enables us to find and leverage past diagnoses and repairs. For example, as we report in Sections 4.2 and 4.3, we find that if the operators of the production system had had access to our technology, a problem that was initially identified as unique but later found to be a recurrence of a prior problem could have been immediately identified as such. Also, one incident that was initially classified as a recurring problem exhibited a very dissimilar signature (using our method) than the alleged original problem; manual rediagnosis showed that our method was correct, and indeed the second problem was not a repeated manifestation of the first problem.
2.2 Signatures: Capturing System State The first issue we address is that of a representation that captures those aspects of system state that serve as a “fingerprint” of a particular system condition. Our goal is to capture the essential system state that contributes to SLO violation or compliance, and to do so using a representation that provides information useful in the diagnosis of this state, in clustering (grouping) of this state with similar states, and in the retrieval process. We will call such a representation a signature of the system state. We make the following assumptions: 1. We assume that we can continuously measure whether the system is in violation or compliance at any given time with respect to the SLO. This can be done, for example, by examining server logs containing timing information or by running probes. 2. We assume that we can continuously measure a collection of metrics that characterize the “low level” operation of the system, such as CPU utilization, queue lengths, I/O latencies, etc. This information can come from OS facilities, from commercial operations tools such as HP OpenView, from instrumented middleware (as was done in [4]), from server logs, etc. Since we can by assumption collect low-level system metrics, it would seem reasonable as a starting point to simply use these raw values as the signature. As will be seen in Section 4.1, our experiments allow us to conclude that signatures based on using raw values are not as effective as
an approach that builds on our prior work on metric attribution [22, 5]. In that work we automatically build models that identify the set of low-level system and application metrics that correlate with each particular instance of the SLO state. We hypothesize that this attribution information is the key to constructing signatures that correctly characterize and distinguish different causes of SLO violations. We therefore spend the rest of this section reviewing the relevant aspects of that work and how it relates to signature construction. The metric attribution process goes as follows. The in~ of low-level system put is a data log containing vectors M and application metrics and the state Y (compliance or violation) of the system. We divide time into regular epochs (e.g., five-minute intervals) and we have one such vector for ~ for an epoch contains each epoch. Each element mi of the M the average value of the specific metric over the epoch, and Y contains a discrete value depending on whether the SLO was violated or not. Relying on pattern classification techniques and probabilistic modeling, the algorithms in [22, 5] yield as output an ensemble of probabilistic models characterizing the behavior of the metrics during intervals of both compliance and violation. Each one of these models essentially represents the relationship between the metrics and the SLO state as a joint probability distribution. We use the Tree-Augmented Naive Bayes models (TAN) to represent the joint probability distribution. Out of this distribution we can extract a characterization of each metric and its contribution to the SLO state. Let the term P (mi |mpi , s− ) represent the resulting probabilistic model for metric mi under violations (s− ), and let P (mi |mpi , s+ ), represent a probabilistic model for the same metric under an SLO state of compliance. The term mpi represents a metric directly correlated with metric mi in the Bayesian network representation; interested readers should consult [5]. Using these models we can identify for a ~ , which metrics (because of their values) given instance of M are more likely to come from their characteristic distribution during violation. This process is called metric attribution. Formally, for a given instance, a metric is flagged as “attributable” if: P (mi |mpi , s− ) > P (mi |mpi , s+ ),
(1)
that is, mi ’s value is closer to its characteristic value for the “violation” distribution than to its characteristic value for the “compliance” distribution. The interpretation is that the observed value of mi is more likely to come from the distribution where the SLO state Y is that of violation. In addition, the methods in [5, 22] are able to identify metrics that yield no information on the SLO state. We call such metrics irrelevant. The process of constructing signatures is as follows. Given a system trace, we follow the procedure detailed in [22] to continuously learn an ensemble of models; for every epoch, a subset of models from the ensemble is selected by choosing models with a high accuracy score in estimating the SLO state over a window in the past (the particular score we use is called the Brier score, which is defined and explained in [22]). From those models we extract a list of metrics whose values are “abnormal” (resp. “normal”), that is, the values are identified as being closer to their characteristic
values during periods of SLO violation (resp. compliance).2 We then extract the signatures, by yielding a transformed ~ where: data log containing a set of vectors S • entry si = 1 if metric i is selected by the models and its value is deemed abnormal. We say the metric is attributed; • entry si = −1 if the metric is selected by the subset of models but is not found to be “abnormal”. We say that the metric is not attributed; • entry si = 0 if the metric is not selected by any of the models at all—we say that the metric is irrelevant to the SLO state. ~ is then a signature for that epoch. Note Each vector S that we produce a signature for every epoch including those in which the SLO was not violated. The intended semantics of a signature are as follows. A metric receives a value of 1 if its raw value is more likely to come from the distribution of values associated with SLO violation (i.e., Inequality 1 is true). These semantics hold for both periods of violation and compliance. As will become apparent, these signatures are useful both for characterization of the behavior of the system in compliance periods, and in violation periods. Thus, given system traces collected on an Internet service, our approach generates a database consisting of the signatures describing the system state, coupled with the SLO state.
2.3 Clustering Signatures The objective when applying clustering to a database of signatures is to find the natural groupings or clusters of these signatures that characterize different performance problems and normal operation regimes. The output of clustering is a set of clusters, plus a characterization of each cluster center. By inspecting the actual elements of the signature database in each cluster we can identify different regions of normality as well as recurrent problems. In addition, the centroid of a cluster of problem behaviors can be used as a syndrome for the problem, since it highlights the metrics that are in a sense characteristic of a set of manifestations of the same problem. In order to render the description above operational, we need to specify a distance metric and a clustering algorithm that minimizes the distortion (sum of distances of each signature to its nearest cluster center). In this paper we explored p both L1 and L2 norms as distance metP the i rics (Lp = p − xi2 |p ). As our basic clustering al|x 1 i gorithm we will use the standard iterative algorithms [6]: k-medians for the L1 norm, and k-means for the L2 norm. These algorithms find k cluster centers (medians and mean respectively) that minimize the distortion as defined above. We will report only on the results based on the L1 norm. Although the results for the L2 norm were quantitatively different, they were qualitatively similar and offered no new insight as far as making decisions about the signature representation. In addition the centers of the clusters in the k-medians case are represented by actual signatures that are members of the cluster.3 2 Mechanisms for fusing the information from different models are described in detail in [22]. 3 A complete analysis of these norms is well beyond the scope of this paper and will be explored in future work.
Ideally, we would like each cluster to contain signatures belonging to a single class of performance problems (SLO violations), or else signatures belonging only to periods of SLO compliance. We introduce a score determining the purity of a clustering to formalize this intuition. In the case where we have no annotations, we distinguish signatures only in terms of their corresponding SLO state (compliance or violation). We count the number of signatures in each cluster that describe epochs of compliance and the number that describe epochs of violations. These counts are then normalized by the total number of signatures (the sum of the two), to produce probability estimates pc and pv (pc + pv = 1). These are used in turn to score “purity” of each cluster. A cluster is pure if it contains signatures of only compliance or only violation epochs, i.e., if either pc or pv are 1. With these probabilities, we compute the entropy of each cluster, given as: H = −pc log2 (pc ) − pv log2 (pv ). For a pure cluster, entropy is 0, which is the best result. The entropy is 1 when the cluster is evenly split between the two types of signatures (pc = pv = 0.5). It is straightforward to generalize the definition of purity score when there are labels distinguishing different annotations corresponding to SLO violations. We compute the overall average entropy of the all of the clusters weighted by the normalized cluster size to give us a measure of purity of the clustering result. Average entropy close to 0 is a strong indication that indeed the signatures captured meaningful characteristics of the periods of violations in contrast to periods of non-violation. Indeed, we will use the purity score to compare different proposals for generating signatures (see Figures 2, and 3). In order to include the purity information in the clustering process, we added an iterative loop using the standard k-medians (k-means) as a building block.4 In the first step k-medians is applied to the whole database D of signatures, yielding k clusters as its output. The purity score is applied to each one of these clusters. If the score is above an input threshold tp , then the procedure stops. Otherwise, k-medians is applied once more to the signatures for those clusters that didn’t pass the test. There are two parameters used to control these process: a number k which is the maximum of clusters expected in each application of k-medians, and the total ktot of clusters expected. The process stops when ktot is reached. There are a number of procedures for determining these parameters, including score metrics with regularization components and search procedures which increase their value gradually until no significant improvement in the clustering distortion is achieved [6]. In this paper we explore the space of ktot and set k = 5. These values were appropriate for evaluating the power of the signature extraction process and displaying its properties. We also checked the amount by which our algorithm will affect the minimization in distortion with regards to a straightforward application of the k-medians algorithm and found it to be negligible. When we compare different candidate methods of signature construction in Section 4.1, we will use the purity of the clustering process as providing evidence of the information contained in each approach. Signatures that enable clusterings with a higher degree of purity (lower entropy) will be favored as they clearly contain enough information to enable 4
In the rest of the description we will mention only kmedians with the understanding that when the L2 norm is used the actual algorithm is k-means.
the automated grouping of the different SLO related states (see Section 4.1.1).
2.4 Retrieving Signatures Using information retrieval techniques we can retrieve from a database all previous instances that are “similar” to a specific signature S. This capability enables us to leverage past diagnoses and repairs and in general all information about previous instances displaying similar characteristics (as captured in the signature vector). As in the case of clustering, similarity is formalized in the context of a distance metric, and as in that case, we explored both L1 and L2 norms, displaying only the results for the L1 norm. Our evaluation will follow the standard measures from the machine learning and information retrieval community [20]. The evaluation focuses on the quality of the retrieval with respect to the similarity and the quality of the signatures. If a specific annotation A is associated with a (set of) signature(s) S we expect that when similar signatures are used, the retrieval process yields signatures also associated with annotation A. Therefore, in evaluating our retrieval results, we consider only those signatures associated with annotations (see Sections 3.1 and 3.3). Formally the process of retrieval proceeds as follows: given a signature, return the N closest signatures to it from the existing signature database. Given known annotations both to the query signature and the signatures in the database, we compute the two standard measures of retrieval quality: Precision and Recall. For a given query, precision measures what fraction of the N returned items have the matching annotation (1.0 is perfect); recall measures the percentage of signatures in the database with the same annotation as the query that are actually retrieved. Note that the maximal value of 1.0 is achieved only when N is at least equal to the number of signatures with the same annotation as the query signature. As N increases recall goes up but precision typically goes down, as it becomes harder to retrieve only signatures that have a matching annotation. Following the common practice in the information retrieval community, we increase N and measure the precision/recall pair, until we achieve a recall of 1.0. We then plot precision as a function of recall, to produce the Precision-Recall curve (see Figure 4 for an example). A perfect precision/recall curve has precision of 1.0 for all values of recall. As in the case of clustering, we will use precision and recall to evaluate the different proposals for a signature (see Section 4.1.2).
3. TRACE COLLECTION AND CHARACTERIZATION Our empirical results are based on large and detailed traces collected from two distributed applications, one serving synthetic workloads in a controlled laboratory environment and the other serving real customers in a globally-distributed production environment. These two traces allow us to validate our methods in complementary ways. The testbed trace is annotated with known root causes of performance problems. Annotated data allows us to evaluate our signaturebased diagnostic methods in terms of simple informationretrieval performance measures (e.g., precision, recall). The production trace is not annotated as well or as thoroughly
as the testbed trace. By treating it as an unlabeled data set, we can use it to evaluate the effectiveness of the signature clustering, which in turn provides identification of the “syndromes” describing performance problems. Since we do have annotations for some of the signatures in the production trace, we can further validate the accuracy of our retrieval on real-world data. Our traces record two kinds of data about each application: application-level performance data for our models’ SLO indicator, and system-level resource utilization metrics (e.g., CPU utilization). Our tools measure the latter as averages in non-overlapping windows.
3.1
Testbed Traces
Our controlled experiments use the popular PetStore ecommerce sample application, which implements an electronic storefront with browsing, shopping cart and checkout. Each tier (Web, J2EE, database) runs on a separate HP NetServer LPr server (500 MHz Pentium II, 512 MB RAM, 9 GB disk, 100 Mbps network cards, Windows 2000 Server SP4) connected by a switched 100 Mbps full-duplex network. Apache’s extended HTTPD log format provides us with per-transaction response times and we obtain system-level metrics from HP OpenView Operations Agent running on each host. A detailed description of our testbed’s hardware, software, networking, and workload generation is available in [22]. We collect 62 individual metrics at 15-second intervals and aggregate them into one-minute windows containing their means and variances. We pre-process our raw measurements from the Apache logs to average transaction response times over the same windows and then join all data from the same application into a single trace for subsequent analysis. We use the standard load generator httperf [11] to generate workloads in which simulated clients enter the site, browse merchandise, add items to a shopping cart, and checkout, with tunable probabilities governing the transition from “browse item” to “add item to cart” (probability Pb ) and from “add item to cart” to “checkout cart” (probability Pc ). We measure the average response time of client requests in each 1 minute window and require that the average response time stay below 100 msec to maintain SLO compliance. We created three handcrafted fault loads designed to cause SLO violations. In the first, we alternate one-hour periods of Pb = Pc = 0.7 with one-hour periods of Pb = Pc = 1.0 (a “BuySpree”). In the second, we execute a parasitic program on the database server machine that consumes about 30% of the available CPU during alternating one hour intervals, but no other major resources (“DBCPU contention”). The third faultload does the same thing but on the application server rather than the database server (“APPCPU contention”). Note that these faultloads simulate both faults due to internal problems (CPU contention) and faults resulting from changes in workload (extreme buying plateaus during BuySpree). In both cases, the injected faults correspond to annotations of known root causes of performance problems in the final processed trace that we employ in our analyses and evaluations.
3.2
Production System Traces
Our second trace is based on measurements collected at several key points in a globally-distributed application that we call “FT” for confidentiality reasons. FT serves business-
AMERICAS
EMEA
(Atlanta)
Application Server Provider
client
client
ASIA/PACIFIC
(Swinden)
client
client
client
(Singapore)
client
client
client
WAN
WAN
WAN
Load balancer
Load balancer
Load balancer
App Srvr
App Srvr
Primary DB
failover if local DB unavailable
Backup DB
App Srvr
App Srvr
Primary DB
Oracle DB replication
failover if local DB unavailable
Backup DB
App Srvr
Primary DB
WAN
WAN
client
App Srvr
Backup DB
Auxilliary DB
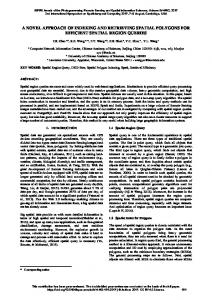
Figure 1: Architecture of the “FT” production system. FT is a globally-distributed multi-tiered application with regional hubs in the Americas, Europe/Middle East/Africa, and Asia. Different organizations are responsible for the FT application and the application server on which it runs; the latter is indicated by a shaded dashed rectangle in the figure. FT has a globally-distributed main database and an additional auxiliary database, managed by a third organization, shown in the lower right.
Region
Role
# hosts
# CPUs
# disks
RAM (GB)
Server
Dates
transactions/min mean 95 % max
% SLO viol
Amer Amer
App srvr DB srvr
2 2
16 12
16 18
64 32
AM1 AM2
12/14–1/14 12/13–2/08
208.6 207.9
456.4 458.0
1,387.2 977.4
23.6 22.5
EMEA EMEA
App srvr DB srvr
3 2
16 6
10 ?
32 16
Asia1 Asia2
12/17–1/05 12/17–1/30
39.9 52.1
118.2 172.8
458.4 775.0
26.2 13.1
Asia Asia
App srvr DB srvr
2 2
12 6
63/22 8
20 16
Table 1: Key hardware and software components in FT. The two app server hosts in Asia have different numbers of disks. All app servers ran WebLogic and all DB servers ran Oracle 9i. Most of the DB servers had 550 MHz CPUs.
critical customers on six continents 24 hours per day, 365 days per year. Its system architecture therefore incorporates redundancy and failover features both locally and globally, as shown in Figure 1. Table 1 summarizes key hardware and software components in FT, and the transaction volumes recorded by our traces (Table 2) demonstrate the non-trivial workloads of the FT installations. All hosts at the application server and database server tiers are HP 9000/800 servers running the HP-UX B.11.11 operating system, except that one database server in Asia is an HP rp7410 server. HP OpenView Performance Agent (OVPA) provides system utilization metrics for application server and database hosts. FT is instrumented at the application level with ARM [18], providing transaction response times. OVPA and
Table 2: Summary of FT application traces. The last column is the percentage of transactions which violated their SLO in the data. Trace collection began in late 2004 and ended in early 2005. “AM” and “Asia” servers were located in the Americas and Asia, respectively.
ARM data are aggregated into 5-minute windows in the processed traces we analyze. We have traces from the Americas and Asia/Pacific hubs but not from Europe. Table 2 summarizes our FT traces. Our criterion for SLO violation is whether the average response time over all transactions in a 5-minute period exceeded 4 seconds. FT is well suited to our interests because its requirements include high performance as well as high availability. Furthermore performance debugging in FT is particularly challenging for two reasons. First, different organizations are responsible for FT itself and for the application server infrastructure in which crucial FT components run (the latter is delimited with a shaded dashed oval in Figure 1); opportunities for inter-organizational finger-pointing abound when end-to-end performance is poor. Second, FT’s supporting
infrastructure is physically partitioned into three regions with separate operational staffs. A performance problem that occurs in the afternoon in each region, for example, will occur three different times, will appear to be specific to a single region each time it occurs, and will demand the attention of three separate teams of system operators. Cost-effective performance debugging in FT requires that commonalities be recognized across regions, across time, and across organizational boundaries, and that different teams of human diagnosticians leverage one another’s efforts. Another attractive feature of our FT traces is that some of our 5-minute samples are annotated, in the sense that they correspond to times when we know that a specific performance problem occurred whose root cause was subsequently diagnosed. In the next section we describe this problem, which illustrates both the challenges that we face and the opportunities that our approach attempts to exploit.
3.3 A Diagnosed Problem: Insufficient Database Connections (IDC) The FT production system experienced a recurrent performance problem mainly in the Americas domain during December 2004 and January 2005. During episodes of this problem, business-critical customers experienced latencies of several minutes on transactions that normally complete within seconds. The operators who first detected the problem described it as “stuck threads” in the application server because WebLogic issued messages in a log file each time it diagnosed a stuck thread. There can be many causes for threads to become stuck, therefore it is necessary to look for other symptoms to diagnose the cause. Due to the severity of the problem, a joint task force comprising both FT application developers and application server administrators quickly formed to address it. This team eventually diagnosed and repaired the root cause of the performance problem, thus providing annotations for data points in our traces corresponding to episodes. Our account of the problem is based on detailed bug-tracking database entries and e-mail correspondence among the troubleshooters. After several weeks of debugging, the problem was traced to an overly-small pool of database connections. Under heavy load, application threads sometimes had to wait more than 10 minutes to acquire a connection, and were therefore flagged as “stuck threads” by WebLogic. The problem was solved by increasing the connection pool size by 25%. We use the annotation IDC (Insufficient Database Connections) to refer to this problem.
4. RESULTS To substantiate our claims, we analyze the data collected from both the experimental testbed excited with synthetic workloads and from the globally-distributed production environment described in Section 3. We will use testbed to identify traces in the first case and FT-trace for the second case. For the testbed experiments, we intentionally injected known faults into the system to cause performance problems. The testbed trace is therefore reliably annotated with the appropriate fault per epoch. In the FT-trace we have only partial annotations, related to one diagnosed problem, as described in Section 3.3. These annotations as well as the fact that we have an objective measure of performance as reflected by the SLO state of compliance and
Metric Name transaction count gbl app cpu util gbl app alive proc gbl app active proc gbl app run queue gbl app net in packet rate gbl mem util gbl mem user util DB1 CPU util
Raw Value 398.00 97.47 449 357 10.57 817 54.62 26.32 25.96
Attr. 0 1 0 0 1 1 1 1 -1
Raw Value & Attr 0 97.47 0 0 10.57 817 54.62 26.32 -25.96
Table 3: Examples of the different signature proposals, showing a subset of the metrics collected in the production environment. The first column is of raw values (not normalized to preserve the context of these metrics), second is metric attribution (with possible values in {+1, 0, −1}), and third is the product of raw values and metric attribution.
violation will provide ground truth against which we can compare the results of the clustering and retrieval operations.
4.1
Claim 1: Evaluating Proposals for Signatures
We evaluate and compare three possible approaches for ~ denote the vector representing creating signatures. Let S the signature. In all cases the elements si in this vector correspond to a specific system, application, or workload metric. ~ 1. Raw values: in this case we represent a signature S using the raw values of the metrics. In other words ~ = M ~ . Following common practice in data analS ysis [6], we normalize these values to [0, 1], using the range of values ever seen, to prevent scaling issues from influencing similarity metrics and clustering.5 This signature is the most naive and requires no extra processing of the traces. 2. Metric attribution: If the attribution as described in Section 2.2 flags the metric mi to be attributable, then si = 1, otherwise si = −1. If the metric mi is not even considered by the models for the attribution process, then the metric is considered to be irrelevant to the SLO state, and si = 0. This requires significant computation [5], but we have shown that the computations could be done on millisecond timescales, allowing this approach to be used in real time [22]. 3. Metric attribution and raw values: This is similar to the previous approach except that the raw value of the metric is multiplied by its entry si as explained in the previous item.6 We evaluate signature-generation approaches based on the quality of clustering and retrieval operations. We demonstrate that signatures based on metric attribution are superior for our purposes. This strongly implies that metric attribution captures information about system state that 5 The results with unnormalized values were much worse for the signatures relying on the raw values. 6 The intuition is that the information contained in the value of the metric is added to the information in the attribution process.
goes beyond the raw values of the collected metrics, further validating the results in [22, 5]. We also remark that in our experiments we see that some metrics are consistently deemed irrelevant for all time epochs in the traces (e.g., in the FT-trace data the root CPU, memory and disk utilization on the application server were never found to be relevant by any model, getting a value of 0 for all epochs). In some cases such an observation can lead to reducing the number of metrics being collected, although that loss of information can be detrimental in cases where a dropped metric becomes relevant in future performance problems. In addition, because our modeling process rapidly narrows down to a small number of metrics that are highly correlated with the SLO state, unless the expense of data collection is significant, we discourage removing any metrics from the measurement apparatus.
4.1.1
Signatures and Clustering
We cluster signatures as described in Section 2.3. To evaluate the quality of the clusters, we rely on the notion of purity also described in the same section. Entropy is used as a measure of purity with low entropy implying that the clusters contain only one type of annotated value (and hence are of a better quality). In the case of the testbed we have four annotations: one refers to periods of SLO compliance and the other three are given by the injected root-cause problem. For the FT-trace, we use SLO compliance and violation to check purity. In both cases we vary the number of clusters and check the variation in the weighted average entropy over the clusters. Stable entropy across different cluster numbers is an indication of the robustness of the clustering output. Figures 2 and 3 show the resultant entropy for each signature generation method and number of clusters. Note that in both cases, testbed and FT-trace, the clustering using attribution information clearly yields purer clusters than the clustering using only the raw value of the metrics. Table 4 provides the counts of each annotation with 9 clusters using signatures based on metric attribution on one of the Americas production systems. Presenting the raw counts in a cluster provides the application administrator a sense of the intensity of the pure clusters, giving her the capability to focus attention on the more prominent clusters of performance problem instances. It is worth noting that one of the clusters (cluster 3) contained most of the instances of the IDC problem (75%), which is significant since the clustering algorithm did not have knowledge of the IDC annotation of these instances, but only knew that these were violation instances. Clusters 9 and 10 indicate that for about 10% of the data the signatures were not able to separate between periods of violation and compliance.
4.1.2
Signatures and Retrieval
Figure 4 shows precision/recall curves of retrieval exercises performed on the testbed traces using the three approaches described above for the signatures (see Section 2.4 for the definition of these curves). Precision/recall performance is better in direct proportion to the area under its curve. Clearly the use of attribution provides an informational advantage, as the curves using attribution are far superior. Our real-world traces were collected during a period when a misconfiguration was causing a performance problem (the “IDC” problem discussed in Section 3). Overall, 269 epochs
Cluster # 1 2 3 4 5 6 7 8 9
# vio 552 225 265 0 1 0 0 216 100
# compl 27 0 2 1304 1557 1555 1302 274 128
Entropy 0.27 0.00 0.06 0.00 0.00 0.00 0.00 0.99 0.99
Table 4: Example of a clustering instance using signatures based on metric attribution. The first column is a count of number of violation instances, the second shows the number of compliance instances, and the third shows the cluster entropy based on the purity of the cluster. Cluster 3 contains almost all the instances corresponding to the IDC problem; 201 instances of the 265 violation instances in cluster 3 are annotated as the IDC problem, the remainder 68 IDC annotated instances are distributed between cluster 1 and 2.
were annotated with this problem. Figure 5 shows the location of these epochs over the month long trace, overlaid on the value of the reference metric (transactions average response time). It can be seen that the issue occurred intermittently over that period. Figure 6 shows the precision-recall graphs for retrieving signatures of the IDC problem. The graph shows that high precision is achieved for a relatively large range of the recall value. For example, of the top 100 signatures retrieved, 92 are correctly retrieved, leading to a precision of 92% (and recall of 34.2%). Such a precision would be more than sufficient for an operator to safely infer that the label attached to the majority of signatures being retrieved matches the problem described by the query signature. As in the case of clustering, these results confirm that the use of attribution in the generation of signatures provides the required information.
4.2
Claim 2: Identifying Recurrent Problems
We show that the clustering is meaningful: each cluster groups signatures that would have the same annotations if they were provided, and the centroids can be used as the syndrome that characterizes that group of signatures. Therefore clustering can be used to identify recurrent issues and to gather statistics regarding their frequency and periodicity. First, based on the results of the Subsection 4.1 we can assert that the clustering as applied to the data in the FTtrace is robust. As Figure 3 indicates, the entropy of the clusters does not change significantly as we increase the number of clusters, implying that the existing clusters are being subdivided rather than completely new ones created. Recall that the entropy is an indication of the “purity” of the cluster, namely of the elements in the cluster what percentage belong to the same annotation. Second, we demonstrate that the clustering is meaningful for the case of nine clusters. Table 4 shows the number of elements belonging to each annotation (compliance or violation) in each cluster. Note that for most of the clusters, comprising of 90% of the 5 minute epochs in a trace collected
0.8
0.7 0.6
Average entropy of clusters
Raw values Raw values metric attribution Metric attribution
0.5 0.4 0.3 0.2 0.1 0 5
6
7
8
9
Figure 2: Clustering on the annotated data from testbed. The signature method relying on attribution performs best and is more stable across different number of clusters. X axis denotes the number of clusters.
over a month, the vast majority of elements in each cluster correspond to one annotation. In addition these clusters are different from one another. Table 5 depicts the cluster centroids (with a subset of the metrics) for four of the clusters from Table 4: clusters 4 and 7, which contained only compliance signatures, and clusters 1 and 3, which contained mostly violation signatures. Note that the compliance centroids deem most metrics as not attributed with a violation state (values -1 for metrics), while the violation centroids deemed some of the metrics as attributed with a violation state (value 1), and others as either irrelevant (value 0) or non-attributed. We also see the difference between the centroids of the “violation” clusters (1 and 3) with respect to the metrics that are deemed attributed. Cluster 1 deemed the Database tier CPU utilization (DB1 cpubusy) as attributed but assigned a -1 value for the application server CPU utilization (gbl cpu total util). In contrast, the centroid of cluster 3 deemed the application server CPU as attributed, together with the number of alive processes and active processes on the application server. As discussed earlier, most members of cluster 3 were labeled as the IDC problem, which had the symptom of high application server CPU utilization and high number of alive and active processes. These differences point out to the symptoms of the members in each cluster and define the syndrome of a group of signatures. Given this clustering, recurrent problems can be identified by looking at the time of occurrence of the signatures in each cluster. Figure 7 depicts the instances of cluster 1, 2 and 3 overlaid in time on the performance indicator graph. Cluster 3 is recurrent, and as mentioned earlier, we verified with the IT operators that the periods defined by “Cluster 3” coincided with the manifestation of the IDC problem according to their records. Thus, had they had this tool, they could have easily identified the problem as a recurring one since its symptoms matched those of the signatures. In addition, the clustering discovered another undiagnosed recurring problem (Cluster 1), with the symptom of higher
0.7 0.6 0.5
Raw Values Raw values metric attribution Metric attribution
0.4 0.3 0.2 0.1 0
10
8
10
0.8 Average entropy of clusters
0.8
12 14 16 # of clusters
18
20
Raw Values Raw values metric attribution Metric attribution
0.7 0.6 0.5 0.4 0.3 0.2 0.1 0
8
10
12 14 16 # of clusters
18
20
Figure 3: Clustering of the data from FT-trace. Each graph corresponds to a different server. The signatures relying on information from metric attribution outperform those using only raw values. Database CPU utilization (average of approximately 60% compared to approximately 20% in most other times), while at the same time all application server utilization metrics were not attributed, and were in fact normal. This problem remains undiagnosed to this date, and did not appear again in the following months, however, if it appears again, these past instances would be retrieved and perhaps help prioritize finding a solution or the root cause of the problem.
4.3
Claim 3: Leveraging Signatures Across Sites
In this section we provide evidence that the signatures collected at various sites and systems can be leveraged during the diagnosis of performance problems. In particular, we show that diagnosis of a performance problem can be aided by querying for similar (or dissimilar) signatures collected at different sites or machines. In the process of diagnosing the IDC problem, which was observed on the Americas site, the debugging team investigated whether the same problem occurred in the Asia-Pacific region as well. In particular, they hypothesized that it did occur during a failover period on December 18, 2004, in
1
3
10
Avg Response Time Performance thresh IDC instances Average Respose Time (sec)
Precision
0.8 0.6 0.4 Raw values Raw values attributed metrics Metric attribution
0.2 0 0
0.2
0.4
Recall
0.6
0.8
Clust 1 -1 0 0 0 -1 0 1 0 0 1
Clust 3 1 0 1 1 0 0 1 0 0 1
Clust 4 -1 1 0 1 -1 -1 -1 -1 -1 -1
1
10
0
10
1
Figure 4: Using data from testbed we see that precision/recall behavior is closest to ideal when metric attribution is used. A method’s performance is directly proportional to the area under the curve.
Metric gbl app cpu total util gbl app disk phys io gbl app alive proc gbl app active proc gbl app run queue gbl app net in packet rate gbl app net out packet rate gbl app mem util gbl app mem sys util DB1 cpu util
2
10
Clust 7 -1 1 -1 -1 -1 1 -1 -1 -1 -1
Table 5: Comparison of the centroid values for four clusters (clusters 1, 3, 4 and 7 from Table 4), two containing mostly compliance signatures (clusters 4 and 7) and two containing mostly violation signatures (clusters 1 and 3). Cluster 3 contained mostly signatures of the IDC problem. Note the difference between cluster 1 and cluster 3 in terms of metrics that are attributed and those not attributed.
which the transactions from the Americas cluster were being sent to the Asia systems hosting the FT application. A high percentage of the transactions were violating their SLOs on one of the Asia cluster machines during the first 100 minutes of the failover period. The debugging team suspected that the cause was the same IDC problem, and annotated it as such. Our signature database included signatures on traces collected on that day. We then performed the following query: are the signatures annotated as the IDC problem on the Americas site similar to the signatures collected during the failover period at the Asia site? As Figure 8 shows, the result of the query was that the signatures of the Asia failover period are very different from the signatures of the IDC problem. Key metrics that were highly attributed in one were not attributed in the other. Of the metrics that were attributed in both, only transaction volume (tt count) was similar in its attribution signal for the signatures from the two sites.
12/19/04
12/25/04
12/31/04 Time
01/06/05
01/12/05
Figure 5: Temporal location of the instances of the IDC problem on one of the Americas machines, overlaid on the reference metric. Upon close inspection of the attributed metrics from one of the Asia machines and the transaction mix on that machine, we quickly arrived at a different diagnostic conclusion for the Asia problem. Due to the failover from the Americas system, Asia1 was experiencing higher transaction volumes, and during the initial phase of the failover, it was experiencing higher response times (see Figure 9). During this initial phase, Asia1 was seeing a high transaction volume of one type of transaction (call it the XYZ transaction) that it normally does not see (see Figure 10). The SQL statements associated with this unusual transaction type were not prepared or cached on the Asia machines, leading to more database overhead, as can be seen in Figure 11, leading to higher response times, and ultimately SLO violation. This diagnosis was accepted by the diagnostics team; the repair consists of priming the database and middleware caches for the new transaction type before a planned failover. As a result of this experience, we were able to replace the false annotation originally provided for that trace data with a new and correct annotation explaining the problem and describing the required repair.
5.
RELATED WORK
The use of search and retrieval to find similar instances and experiences of faults and performance problems is not new. It is common practice for system operators to use Web search engines to search for the text of error messages or console messages as part of their debugging, but such methods are ad-hoc and imprecise. Redstone et al. advocate a machine-readable compact representation of system state in an attempt, among other things, to formalize the recording of instances and that search [15]. Yet to the best of our knowledge our work is the first to propose a concrete technique for constructing the appropriate representation and evaluating its efficacy. While others have attempted to use low-level metrics to characterize high-level system behavior, we believe that we are the first to propose an automatic method for generating a compact, indexable representation of system state that
1
3
10
recurring problem (mostly IDC)
Average Respose Time (sec)
0.6 0.4 0.2 0 0
Raw Values Raw Values AND Metric Attribution Metric Attribution 0.2
0.4
Recall
2
10
1
10
Avg Response Time Performance thresh Cluster 1 Cluster 2 Cluster 3
0
10
0.6
0.8
1
Figure 6: Precision-recall graph for retrieval of the signatures of the IDC issue in the web-service production environment. Methods based on metric attribution outperform the one relying on raw values significantly.
facilitates syndrome identification and incident clustering. This section surveys recent research on related computer performance diagnosis problems and reviews applications of signatures to diagnostic problems in other domains. Aguilera et al. describe two algorithms for isolating performance bottlenecks in distributed systems of opaque software components [1]. Their “convolution” algorithm employs statistical signal-processing techniques to infer causal message paths that transactions follow among components, which are not assumed to communicate via RPC-like request/reply pairs. At the opposite extreme of this knowledge-lean approach, Magpie characterizes transaction resource footprints in fine detail but requires that application logic be meticulously encoded in “event schema” [2]. Cohen et al. employ statistical pattern classification techniques to identify system utilization metrics that correlate with performance [5]. Our research differs from these projects in that it is aimed at aiding root cause diagnosis by finding similar problems, rather than bottleneck detection or workload modeling. While our approach does not determine the root cause, finding a previously solved (annotated) problem may provide root cause (or repair action) when the retrieval is accurate. Like Aguilera et al. and unlike Magpie, we assume little knowledge of application structure or logic and we rely heavily on statistical methods. Like Cohen et al. we find that patternclassification techniques are useful for identifying a small subset of system measurements that are relevant to performance. To us, however, this subset is useful not for its own sake but rather for constructing signatures. For brevity, in this section we do not discuss prior work already summarized in the above papers’ excellent literature reviews. Faults in distributed systems, as opposed to performance problems, are the subject of a large literature. For communications networks, whose components have highly constrained and well specified behavior, a wide range of fault localization techniques have been explored [16]. Yemini et al. describe an event correlation (root cause determination) procedure that relies on an extensive library describing each
12/19/04
12/25/04
12/31/04 Time
01/06/05
01/12/05
Figure 7: Instances of the three “pure” abnormal clusters (clusters 1, 2 and 3 from Table 4), overlaid on the reference metric . Cluster 3 comprises mostly of the instances annotated as the IDC problem. Cluster 1 is another recurrent problem with the symptom of high Database CPU load and low Application server utilization, while Cluster 2 has memory and disk utilization metrics on the Application server as attributed metrics to the performance problem. 1 0.8 0.6 Metric Attribution
Precision
0.8
0.4 0.2 0
AP1 Failover IDC
-0.2 -0.4 -0.6 -0.8 -1 t un util c c co _ ro tt_ otal e_p _pro eue te t sy u a q q u_ _aliv ctive n_q et_r ubu run til p re s l c u a b ku r _ cp pu ge ck et l _ g l l_ io e pa 1__ __c _pa _dis ack gb c gb gb _ s_ im c 1 p ro _ _ ut DB il _ hy 1 1 B ro l_t o _ _p D ut _p tota t_ _p DB B1 DB k ve e al_ n is _ D ive ali _ t d ot u l _ p _t ac p_ _cp gb p u _ p cp _a pp _a app r_ t_ p_ _a r_ oo er__ othe ap _r he __ th er ot er o s h u ot r_ Metrics he ot
IDC AP1 Failo ver
Figure 8: Comparing the signatures from the Asia failover period and the IDC problem in the Americas. The bars for each metric show the mean attribution value for the signatures in each period. For metrics where there are fewer than two bars shown, a missing bar means that the metric was not selected by any model that predicted the violation for this period. Metrics whose name does not begin with “DB1” are from the application server.
system component’s possible faults and the consequences of each fault [21]. These detailed component descriptions are compiled into a codebook that reduces root cause analysis to a simple and efficient task of decoding observed symp-
Average Response Time
1
10
SLO Threshold
0
10
−1
10
12/18/04,08:53
12/19/04,01:33
12/19/04,18:13
Time
12/20/04,10:53
Figure 9: Average response time during the Asia1 failover period. 300
XYZ Transaction count
250
200
150
100
50
0 12/18/04,08:53
12/19/04,01:33
12/19/04,18:13
Time
12/20/04,10:53
Figure 10: Throughput for the XYZ Transaction during the Asia1 failover period. XYZ transactions are usually never seen in Asia. 100 90
DB CPU %
80 70 60 50 40 30 20 10 12/18/04,08:53
12/19/04,01:33
12/19/04,18:13
Time
12/20/04,10:53
Figure 11: CPU utilization on the DB server was unusually high at the beginning of the failover period. Once the caches are warmed, CPU utilization returns to 20% or lower.
toms into the faults that caused them. This approach has been commercialized for communications systems [17] but is inappropriate for arbitrary distributed software because it is infeasible to enumerate the faults and symptoms of arbitrary computer programs. In addition, this approach has no learning or adaptation aspects, which our probabilistic models provide. The Pinpoint system of Chen et al. analyzes run-time execution paths of complex distributed applications to automatically detect failures by identifying statistically abnormal paths; faulty paths can then aid a human analyst in diagnosing the underlying cause [4]. Kiciman & Fox describe in greater detail the use of probabilistic context-free grammars to detect anomalous paths in Pinpoint [10]. Our approach shares with Pinpoint the use of statistical techniques, but the instrumentation we require is more readily available and we seek to diagnose performance problems rather than faults. Jain describes a traditional performance debugging technique that generates visual signatures of performance problems [8]. Popular in the 1970s, “Kiviat graphs” display a handful of utilization metrics in such a way that resource bottlenecks and imbalances assume a distinctive appearance. Like our signatures, Kiviat graphs of different systems (or of different conditions on a single system) invite comparison and facilitate similarity matching. However our signatures differ in several ways from this classic technique: signatures are intended for automated indexing, retrieval, and similarity measurement; they do not rely on human visual inspection; they scale to dozens or hundreds of metrics; and they incorporate application-level performance measures in addition to utilization metrics. Signatures have been used extensively in virus scanning and intrusion detection [12]. Statistical techniques are often employed to flag anomalous activity automatically, but signatures of malicious behavior are almost always defined manually. Kephart et al. describe a statistical method for automatically extracting virus signatures for a commercial detection product [9]. Redstone et al. advocate automating the diagnosis of uservisible bugs by leveraging the efforts of troubleshooters worldwide [15]. These authors note that such problems have often already been diagnosed and documented, e.g., in newsgroups and vendor bug databases. The real problem is finding the right diagnosis by indexing into a vast disorganized knowledge base. Signatures can help us to realize the vision that Redstone et al. sketch. Modern systems software, middleware, and styles of application architecture bring obvious benefits but entail substantial costs. Ours is one of several research attempts to preserve the benefits of modern architectural styles while mitigating their problems. We briefly survey three such problems and corresponding research toward solutions. Layers of modular re-usable components interacting through narrow interfaces allow us to divide and conquer increasingly complex problems at low cost. However they also conceal performance-critical information about each component from its neighbors. For example, conventional operating systems offer strong inter-process fault isolation but suffer side effects including redundant data buffering and copying. The IO-Lite buffering/caching subsystem retains fault isolation while eliminating redundancy [13].
Resource virtualization permits application developers to ignore congestion and scarcity, which they often do to the detriment of performance. The SEDA framework encourages application designers to explicitly address overload and resource scarcity while retaining many of the benefits of virtualization [19]. Finally, decentralized management and geographic distribution allow different organizations to cooperatively serve a global user base, but these trends also diffuse the knowledge required for performance debugging. Aguilera et al. and Cohen et al. confront the opacity of complex modern applications by illuminating performance bottlenecks and correlates of performance in unmodified distributed applications [1, 5]. Our signature-based syndrome identification methods reduce redundant diagnostic effort across time, geography, and organizational boundaries.
6. DISCUSSION 6.1 On Root Cause Analysis and Diagnosis The statistical and pattern recognition techniques underlying the automated extraction of signatures capture correlation, not necessarily causation. Indeed, as is well known in the statistics and other communities, the ability to infer causation from pure observation is limited and in most cases impossible [14]. By pure observation we mean lack of direct intervention into the system or additional information, coming from human experts regarding the causal relations and paths in the system. In some instances, time information and information about the sequence of events can be used as heuristics to find causal connections. This has been attempted in many domains including this one, most notably in [1]. We leave as future work the inclusion of this kind of information into our approach and the exploration of its utility, although we remark that there is nothing in principle that prevents us from considering “sequences” of signatures or adding time information (including precedence information) into the creation of the signatures and the subsequent analysis. It follows from this discussion that we cannot claim (nor have we ever) that the approach advocated in this paper yields a root cause of the problem. Indeed, even with human expert knowledge, root cause analysis is far from easy (recall the example of Section 3.3). Nevertheless, we postulate that offering the capabilities of systematic similarity search and clustering of correlated metrics helps in narrowing down the possible causes and is therefore useful in the diagnosis process. In addition, it may not be necessary to reach a root cause to produce a repair. As difficult as root cause analysis has proven to be over the years, perhaps a more pragmatic approach would be to automatically map the evidence for the faults and metric state to a finite set of possible repair actions.
6.2 On Annotations, the Real World, and Clustering It is a fact of life in the IT trenches that annotations are currently scarce and also imperfect. Part of the reason for imperfect annotations on real data results from the reality that the administration of different subsystems or tiers of an application may be delegated to different individuals distributed across the organization, as we experienced when investigating the problem and resolution described in Sub-
section 4.3. Our experience with other companies running multi-tier applications confirms that there is often no single administrator responsible for understanding the end-to-end paths through the application. One result of this is a frequent lack of clear agreement on what the true cause of a problem is or was: forensic data may be discarded before it’s needed, and each operator is typically focused on either debugging or exonerating her/his piece of the system. Our acceptance of good clustering, given by low entropy/ high purity, the difference in the centroids, and the use of the centroids as a “proxy” for annotated data, provides a pragmatic approach when un-annotated data is all that we have at our disposal. Note that we can still use the clustering to identify recurring problems as this reduces to checking whether two data points belong to the same cluster, and the size of a particular cluster reflects how many violations can be attributed to the “syndrome” that cluster represents. Retrieval is still valuable in gathering all similar instances that are stored in the database, as can be seen from our results: clustering was able to recognize 75% of the IDC cases belonging to the same cluster, and we get excellent precision-recall behavior when we do have annotations. We hope that the availability of a systematic way to exploit annotations, as proposed in this paper, will encourage a change in best practices that makes annotations more prevalent. As a human operator investigates further, characterizes and names a syndrome that results from a clustering, the final diagnosis and repair procedures can be stored in the database for future reliable retrieval.
6.3
Performance Impact of Our Approach
There are five points where our approach adds computation cost or other overhead that may impact performance considerations: overhead of collecting data, construction of TAN models for metric attribution [5], signature computation, clustering, and retrieval. Our system data is collected by a commercial tool that is widely deployed in industry; the tool is designed to minimize performance impact on the observed system, and at any rate the widespread use of such tools represents a sunk cost. Updated system data is coalesced and reported periodically, generally in 1 or 5 minute epochs. Building and maintaining an ensemble of TAN models takes 5–10 seconds with our code, so it is practical to apply the ensemble algorithm to system data in real time. In our prototype implementation in Matlab, given an ensemble with approximately 41–67 models (generated using one month of system data), it takes about 200ms to compute a signature for one epoch. Using the k-medians algorithm (with k=10) to cluster 7507 signatures (about one month when using 5-minute epochs) takes less than 10 seconds. Finally, retrieving the top 100 matching signatures from a database of 7700 signatures takes less than one second. We conclude that signature generation can proceed in real time, and analysis with clustering or retrieval is fast enough to be done at will.
7.
CONCLUSIONS
A result in this paper with deep implications is that simply recording the values of raw system metrics does not provide an effective way to index and retrieve syndrome data: a more sophisticated way of generating “signatures” is required. We further showed that it is sufficient to include information regarding attribution and relevance of these metrics rela-
tive to performance objectives. We further demonstrated how automated (but well known) techniques for clustering and retrieval enable diagnosticians to leverage the results of past work and identify similar or recurring problems, even when no problem annotations or application-specific knowledge are available. Our application of these techniques was helpful in correcting a misdiagnosis as well as correctly classifying a recurrent problem in a real world geographically distributed system. The initial classification of this problem required the exchange of 80 pages of notes among administrators over a period of a month. This work opens several avenues of research in choices and properties of different methods for signature construction, clustering, similarity metrics, etc. In addition, we would like to extend this work to signatures that include temporal sequences, and to further explore how to transfer the signatures, syndromes, and annotations from one system to another. Further research is also required to incorporate the information inherent in partial and even in imperfect annotations in the clustering and retrieval techniques. Our results suggest that systems can and should derive signatures for observed undesirable behaviors and then index those signatures for later retrieval during troubleshooting. We believe that further research in this area will lead to improvements in system scale and availability. These techniques and their further development will enable a systematic way of capturing knowledge and expertise from operators (through annotations of diagnoses and repair actions) that can be leveraged by other operators across geography and across time.
8. ACKNOWLEDGMENTS We would like to thank Vijay Machiraju and Richard Stormo for pointing us toward the data set that made our empirical work possible. We furthermore thank the FT application developers and support group for access to their data, expertise, and time. We would also like to thank our anonymous reviewers and our shepherd, Mike Burrows, for helping us to significantly improve this paper. Finally, we thank Rob Powers and Jeff Mogul for helpful comments.
9. REFERENCES [1] M. K. Aguilera, J. C. Mogul, J. L. Wiener, P. Reynolds, and A. Muthitacharoen. Performance debugging for distributed systems of black boxes. In Proc. 19th ACM SOSP, 2003. [2] P. Barham, A. Donnelly, R. Isaacs, and R. Mortier. Using Magpie for request extraction and workload modelling. In Proc. 6th USENIX OSDI, Dec. 2004. [3] G. Candea, S. Kawamoto, Y. Fujiki, G. Friedman, and A. Fox. A microrebootable system – design, implementation, and evaluation. In Proc. 6th USENIX OSDI, San Francisco, Dec. 2004. [4] M. Chen, E. Kıcıman, E. Fratkin, E. Brewer, and A. Fox. Pinpoint: Problem determination in large, dynamic, Internet services. In Proc. International Conference on Dependable Systems and Networks, pages 595–604, Washington, DC, June 2002.
[5] I. Cohen, M. Goldszmidt, T. Kelly, J. Symons, and J. S. Chase. Correlating instrumentation data to system states: A building block for automated diagnosis and control. In Proc. 6th USENIX OSDI, San Francisco, CA, Dec. 2004. [6] R. O. Duda, P. E. Hart, and D. G. Stork. Pattern Classification. Wiley, second edition, 2001. [7] D. Jacobs. Distributed computing with BEA WebLogic server. In Proceedings of the Conference on Innovative Data Systems Research, Asilomar, CA, Jan. 2003. [8] R. Jain. The Art of Computer Systems Performance Analysis. Wiley-Interscience, New York, NY, 1991. [9] J. O. Kephart and W. C. Arnold. Signatures. In Proc. 4th Virus Bulletin International Conference, 1994. http://www.research.ibm.com/antivirus/ SciPapers/Kephart/VB94/vb94.html. [10] E. Kıcıman and A. Fox. Detecting application-level failures in component-based internet services. IEEE Transactions on Neural Networks, Spring 2005. [11] D. Mosberger and T. Jin. httperf—a tool for measuring web server performance. http://www.hpl. hp.com/personal/David Mosberger/httperf.html. [12] B. Mukherjee, L. T. Heberlein, and K. N. Levitt. Network intrusion detection. IEEE Network, 8(3):26–41, May 1994. [13] V. S. Pai, P. Druschel, and W. Zwaenepoel. IO-Lite: A unified I/O buffering and caching system. ACM Trans. Comput. Sys., 18(1):37–66, Feb. 2000. [14] J. Pearl. Causality: Models, Reasoning, and Inference. Cambridge University Press, 2000. [15] J. A. Redstone, M. M. Swift, and B. N. Bershad. Using computers to diagnose computer problems. In Proc. HotOS IX, pages 91–96, May 2003. [16] M. Steinder and A. S. Sethi. A survey of fault localization techniques in computer networks. Science of Computer Programming, 53:165–194, 2004. [17] System Management Arts (SMARTS) Inc. Automating root cause analysis, 2001. http://www.smarts.com. [18] The Open Group. Application Response Measurement (ARM) 2.0 Technical Standard, July 1998. http:// www.opengroup.org/onlinepubs/009619299/toc.pdf. [19] M. Welsh, D. Culler, and E. Brewer. SEDA: An architecture for well-conditioned, scalable Internet services. In Proc. 18th ACM SOSP, 2001. [20] I. H. Witten and E. Frank. Data Mining: Practical Machine Learning Tools and Techniques with Java Implementations. Academic Press, 2000. [21] S. A. Yemini, S. Kliger, E. Mozes, Y. Yemini, and D. Ohsie. High speed and robust event correlation. IEEE Communications Magazine, pages 82–90, May 1996. [22] S. Zhang, I. Cohen, M. Goldszmidt, J. Symons, and A. Fox. Ensembles of models for automated diagnosis of system performance problems. In DSN, 2005.