Can. J. Remote Sensing, Vol. 33, No. 3, pp. 189–202, 2007
Retrieving crop physiological parameters and assessing water deficiency using MODIS data during the winter wheat growing period Yonghong Yi, Dawen Yang, Daoyi Chen, and Jingfeng Huang Abstract. The potential of moderate-resolution imaging spectroradiometer (MODIS) time-series in monitoring crop condition was examined in the Weishan Irrigation Zone along a downstream reach of the Yellow River, China. First, MODIS-derived spectral indices, including the normalized difference water index (NDWI) and normalized difference vegetation index (NDVI), were employed to retrieve the crop physiological parameters (such as vegetation water content and dry matter) during the winter wheat growing season. NDWI was found to be less susceptible than NDVI to the directional effects induced by the changes of illumination and view angles. NDWI1640 and NDWI2130, which were based on the shortwave infrared (SWIR) 1640 nm and 2130 nm bands, showed great potential for vegetation water content (VWC) estimation and performed better than NDVI and NDWI1240. Both NDWI1640 and NDWI2130 had a significant positive correlation with dry matter content before the blooming stage. A significant negative correlation between NDWI2130 and dry matter content was found after the blooming stage. Second, NDWI was also employed to assess the canopy water deficit during the same period as a direct indicator of crop water content. The strong correlation between NDWI and soil moisture after the jointing stage showed that NDWI can also be utilized as an indicator of soil moisture changes. An integrated analysis of the temporal variation of NDWI and the observed VWC demonstrated that the wheat was under water stress to some extent during the later part of the growing period in 2006, and this was supported by a field experiment. Résumé. Le potentiel des séries chronologiques de données MODIS (« moderate-resolution imaging spectroradiometer ») pour le suivi des conditions des cultures a été examiné pour la Zone d’irrigation de Weishan, en aval du fleuve Jaune. En premier lieu, nous avons utilisé les indices spectraux dérivés des données de MODIS, incluant le NDWI (« normalized difference water index ») et le NDVI (« normalized difference vegetation index »), pour extraire les paramètres physiologiques des cultures (tel que la teneur en eau et en matière sèche de la végétation) durant la saison de croissance du blé d’hiver. Le NDWI s’est démontré moins susceptible que le NDVI aux effets directionnels induits par les changements d’angles d’éclairement et de visée. Les valeurs de NDWI1640 et NDWI2130, basées sur les bandes de 1640 nm et 2130 nm de l’infrarouge à onde courte (SWIR), ont montré un potentiel élevé pour l’estimation de la teneur en eau de la végétation (VWC) et ont affiché une meilleure performance que le NDVI et NDWI1240. Les valeurs de NDWI1640 et NDWI2130 affichaient des corrélations positives significatives avec le contenu en matière sèche, avant le stade de la floraison. Une corrélation négative significative entre NDWI2130 et le contenu en matière sèche est observée, après le stade de floraison. En deuxième lieu, le NDWI a également été utilisé pour évaluer le déficit hydrique du couvert au cours de la même période en tant qu’indicateur direct du contenu hydrique des cultures. La forte corrélation entre le NDWI et l’humidité du sol après le stade de montaison a montré que le NDWI peut également être utilisé en tant qu’indicateur des changements de l’humidité du sol. Une analyse intégrée de la variation temporelle du NDWI et des valeurs observées de VWC a démontré que le blé était sous stress hydrique jusqu’à un certain point durant la période tardive de la saison de croissance en 2006, ce qui a été démontré par les expériences de terrain. [Traduit par la Rédaction]
Introduction
Yi et al.
202
Accurate estimation of vegetation biophysical parameters including leaf pigments, dry matter, vegetation water content
(VWC), and leaf area index (LAI) has important applications in the fields of agriculture and forestry (Gao and Goetzt, 1995). The biophysical parameters (such as dry matter and LAI) derived from satellite data can be integrated into crop yield
Received December 20 2005. Accepted April 26 2007. Published on the Canadian Journal of Remote Sensing Web site at http://pubs.nrccnrc.gc.ca/cjrs on 19 July 2007. Y. Yi1 and D. Yang. State Key Laboratory of Hydro-Science and Engineering, Department of Hydraulic Engineering, Tsinghua University, Beijing 100084, China. D. Chen. Department of Engineering, University of Liverpool, Liverpool L69 3BX, UK. J. Huang. Rosenstiel School of Marine and Atmospheric Science, University of Miami, 4600 Rickenbacker Causeway, Miami, Florida, USA. 1
Corresponding author (e-mail:
[email protected]).
© 2007 CASI
189
Vol. 33, No. 3, June/juin 2007
models to facilitate monitoring crop condition and predicting crop yields. Dry matter and VWC in the vegetative and reproductive phases are closely related to the plant net primary productivity (NPP), especially in semiarid regions, which can provide early crop yield assessments (Doraiswamy et al., 2004). In addition, VWC is also useful for drought assessment in both irrigated and natural communities (Penuelas et al., 1993; Jackson et al., 2004). Remote sensing is recognized as a cost-effective solution to predict crop yield and monitor drought. Satellite data can provide extended accessibility to spatial and temporal variations of some key canopy parameters in addition to field observations. The dominant factors that influence canopy reflectance in the reflected spectra include leaf parameters (mainly leaf internal structure, leaf dry matter content, and water content), LAI, satellite zenith angle, and sun zenith angle. LAI has a large impact, especially in the near-infrared (NIR) and shortwave infrared (SWIR) wavelengths, leaf water is the prevalent factor influencing the reflectance in SWIR wavelengths, and leaf dry matter influences the leaf reflectance in the NIR and SWIR wavelengths (Tucker, 1980; Hunt and Rock, 1989; Ceccato et al., 2002a). Many investigations on the estimation of biophysical parameters from satellite data have been conducted using either empirical relationships or physically based approaches. Generally, the physical approaches are based on the inversion of radiation transfer processes within canopies, which provide a direct connection between the biophysical variables and the canopy reflectance (Houborg et al., 2007). However, although the processes at the leaf level can be modeled accurately, the radiation transfer processes within the soil–canopy–atmosphere system have not been fully understood (Faurtyot and Baret, 1996; Doraiswamy et al., 2004). In comparison, by relating crop
parameters to spectral vegetation indices (VI), the empirical methods are highly desirable in large-scale applications because of their simplicity and computational efficiency. However, a fundamental problem with this approach is the lack of generality, since canopy reflectance depends on complex interactions between several internal and external factors. Therefore, the focus of many studies has been on finding a vegetation index that maximizes the sensitivity to the vegetation variables of interest and minimizes the sensitivity to other variables (Ceccato et al., 2001; 2002a). The normalized difference vegetation index (NDVI, see Table 1) is one of the most widely used indices and has been applied to estimate crop yields, end-of-season dry biomass (Gao, 1996), and VWC. However, when vegetation coverage becomes dense and the LAI increases to a value greater than 2 (Chen et al., 2005), the NDVI is no longer sensitive to the crop growth, giving the so-called saturation phenomenon. This is probably due to the fact that the visible band used in the NDVI is more relevant to chlorophyll absorption, not water content (Ceccato et al., 2002a). Recently, attention has been paid to utilizing the SWIR band to retrieve vegetation water contents. For instance, the soil background reflectance, leaf biochemical parameters, leaf internal structure, leaf dry matter, canopy biophysical parameters (i.e., LAI), and atmospheric conditions all affect the satellite-measured reflectance (Hunt and Rock, 1989; Penuelas et al., 1993; Rollin and Milton, 1998; Ceccato et al., 2001). Therefore, the main challenge to the retrieval of VWC from satellite data is to distinguish the effect of water content on plant reflectance from all other influences (Serrano et al., 2000). A series of spectral indices was proposed to deal with this problem, usually based on a ratio or other simple mathematical formula of reflectance at two or more
Table 1. Definitions of spectral indices. Index NDVI EVI
Algorithm ρ − ρ Red NDVI = NIR ρ NIR + ρ Red ρ NIR − ρ Red EVI = 2.5 ρ NIR + 6ρ Red − 75 . ρ Blue + 1
NDWI
NDWI =
ρ NIR − ρ SWIR ρ NIR + ρ SWIR
SIWSI
SIWSI =
SRWI
Applied sensors
References
NOAA AVHRR; Landsat TM/ETM; SPOT–VEGETATION; MODIS MODIS
Rouse et al. (1973), Huete et al. (2002) Huete et al. (1999; 2002)
Landsat TM/ETM; Terra MODIS; AVIRIS
Gao (1996), Serrano et al. (2000), Chen et al. (2003; 2005), Zarco-Tejada et al. (2003), Jackson et al. (2004)
ρ SWIR − ρ NIR ρ SWIR + ρ NIR
Terra MODIS
Fensholt and Sandholt (2003)
SRWI =
ρ NIR ρ SWIR
Terra MODIS; SPOT–VEGETATION
Ceccato et al. (2001), Zarco-Tejada and Ustin (2001)
GVMI
GVMI =
(ρ NIR + 0.1) − (ρ SWIR + 0.02 ) (ρ NIR + 0.1) + (ρ SWIR + 0.02 )
SPOT–VEGETATION
Ceccato et al. (2002b)
PWI
PWI =
AVIRIS
Serrano et al. (2000)
ρ 970 ρ 900
Note: AVIRIS, advanced visible infrared imaging spectrometer sensor; EVI, enhanced vegetation index; ρSWIR, ρNIR, ρRed, and ρBlue, reflectance in the SWIR, NIR, red, and blue wavelengths, respectively; ρ900 and ρ970, reflectance in 900 nm and 970 nm, respectively. 190
© 2007 CASI
Canadian Journal of Remote Sensing / Journal canadien de télédétection
wavelengths (Sims and Gamon, 2002). Gao (1996) designed the normalized difference water index (NDWI, see Table 1) using 1240 nm and 860 nm wavelengths, and it proved to be more sensitive to VWC and less perturbed by atmospheric effects than NDVI. Jackson et al. (2004) and Chen et al. (2005) successfully applied Landsat and moderate-resolution imaging spectroradiometer (MODIS) derived NDWI to estimate corn and soybean VWC, respectively. It has been demonstrated that the saturation of NDWI occurred later than that of NDVI. Furthermore, similar indices such as the shortwave infrared water stress index (SIWSI; Fensholt and Sandholt, 2003) (see Table 1) and the land surface water index (LSWI; Xiao et al., 2005) were also applied to monitor the spatial and temporal changes in VWC and soil moisture in the semiarid Sahelian zone of West Africa and paddy fields in China. Ceccato et al. (2001) proposed a global vegetation moisture index (GVMI; see Table 1) using the SWIR bands of SPOT–VEGETATION to minimize its sensitivity to the atmospheric perturbations and angular effects and maximize its sensitivity to VWC. All such tuning of indices suggests the possibility of utilizing longer wavelength NIR or SWIR bands for VWC retrieval at full canopy from space. For NPP estimation in a semiarid and subhumid environment such as the northern China plain, canopy water stress is a key limiting variable (Fensholt and Sandholt, 2003). Carter (1994) pointed out that an increased reflectance in SWIR wavelengths was the most consistent response of leaf reflectance to plant stress, including water stress. The difficulties in monitoring canopy water stress from a satellite are similar to those of VWC retrieval. Winter wheat is a major crop and so monitoring its growth and water stress is important. The aim of the present work is to examine whether winter wheat can be monitored using remotely sensed data in a way similar to that of previous investigations of corn and soybeans (Chen et al., 2005). MODIS data show potential use for retrieval of crop biophysical parameters and for improving accuracy in crop yield assessment, with its merits of moderate spatial resolution (250–500 m) and daily data availability (Doraiswamy et al., 2004; Chen et al., 2005). Moreover, MODIS data onboard the Terra and Aqua satellites potentially provide twice diurnal coverage, which greatly enhances the ability of monitoring crop condition during the cloudy season. This research discusses the potential use of several vegetation indices derived from MODIS data in estimating VWC, dry matter content, and LAI during the winter wheat growth cycle. Two key indices (NDWI and NDVI) are chosen for comparison to evaluate their performance in retrieving the three vegetation parameters. For LAI retrieval, the enhanced vegetation index (EVI; see Table 1), which is designed to improve the predictability of LAI in densely vegetated areas (Huete et al., 1999), is also used. The potential use of NDWI for crop water deficiency evaluation is discussed together with the in situ measurement of soil moisture and rainfall.
© 2007 CASI
Data sources and processing Study area and field experiment Field experiments were conducted around the Gaoying eddy flux tower (36°38′55.5′′N, 116°3′15.3′′E; see Figure 1a) in the Weishan Irrigation Zone (36°12′–37°00′N, 115°24′–116°30′E). The Weishan Irrigation Zone, with a total area of 36 000 hm2, is the largest irrigation zone along the downstream reaches of the Yellow River and is the fifth largest irrigation zone in China. The mean annual precipitation in this zone is about 580 mm, with nearly 70% of the precipitation in the summer from June to September. Figure 2 shows the deviation of annual precipitation from the average value from 1961 to 2005. Compared with the 1970s and 1980s, larger fluctuations of annual rainfall are observed after 1990, and the lowest value is only 266 mm in 2002. The Weishan Irrigation Zone is mainly comprised of croplands, planted woods, secondary grass and shrubs, and artificial surfaces. The local primary agriculture cropping practice is the rotation of winter wheat and summer corn. Winter wheat is sown in early October, but its major growing period is from March to May of the next year. After turning green in March, the major wheat growth stages include jointing, heading, blooming, grain filling, and maturing. At the beginning of April, the roots expand and the tillers increase, the major characteristics of the jointing stage. At the end of April, the wheat enters the heading stage, when the ears and stems begin to grow with notable accumulation of dry matter. After heading, the roots, stems, and leaves cease growing and the reproductive growth is enhanced. Winter wheat fully blooms after the first week of May. The grain-filling stage begins at the end of May, and the wheat matures in early June. These latter two stages determine the number and weight of grains, which are closely related to the wheat dry weight and yields. The wheat harvest is usually in mid-June. The field experiments were conducted every 2 weeks from 1 April to 3 June 2006. VWC, dry matter, and LAI were measured for the samples collected in three plots around the flux tower. Three 1 m2 blocks were selected randomly with nearly uniform row distance. The total number of tillers of wheat in each block was counted, and then the leaf area of the samples from the plots was measured. The samples were quickly weighed to obtain the fresh weight and then dried in an oven for 8 h at 70 °C to obtain the dry weight. The difference between the fresh weight and dry weight is the water content of the crops. VWC, dry matter, and LAI values for the three samples were averaged, and then the values for the three variables in the 1 m2 area were derived by multiplying the ratio of the number of tillers in the 1 m2 area to that of the sample tillers (VMC and dry matter in kg·m–2, LAI unitless). Within a radius of several kilometres around the flux tower, the croplands were almost homogeneously covered by the same wheat crop. Therefore, the measurements from the samples were used to represent the field average.
191
Vol. 33, No. 3, June/juin 2007
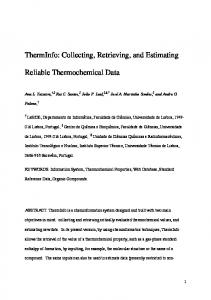
Figure 1. Study area and validation site. (a) The Weishan Irrigation Zone along a downstream reach of the Yellow River and the location of the Gaoying flux tower. The region for land cover classification analysis is shown by the rectangle. Scale = 1 : 1 051 660. (b) Location and spatial extent of the validation field (outlined with a bold line). The background is a false color composite Landsat ETM image from 16 May 2000 (30 m, 4–3–2).
Terra and Aqua MODIS product
Figure 2. Deviation of annual precipitation from the average annual precipitation (580 mm) in the Weishan Irrigation Zone from 1961 to 2005.
In addition, precipitation was measured every 10 min using an automatic rain gauge. Two time-domain reflectometry (TDR) probes were buried around the tower to monitor the soil moisture profiles continuously at depths of 5, 10, 20, 40, 80, and 160 cm. The irrigation data including discharge and irrigation date were also collected.
192
MODIS was first launched onboard the Terra satellite on 18 December 1999 (10:30 AM Equator crossing time, descending) and then on 4 May 2002 onboard the Aqua satellite (1:30 PM, Equator crossing time, ascending). Terra and Aqua MODIS on two satellites in orbits complement each other by providing observations in the late morning and early afternoon. This combination is helpful in studying the diurnal variation of the water-energy cycles and can provide validation of independent long-term datasets with the same geophysical parameters (Salomonson et al., 2001). Product description The MODIS 500 m daily surface reflectance product (Terra, MOD09; Aqua, MYD09) and 250 m 16 day VI products (Terra, MOD13) were downloaded from the Earth Observing System (EOS) data gateway. The MOD09 and MYD09 products provide an estimation of the surface reflectance for MODIS channels 1–7 as it would be measured at the land surface if there were no atmosphere. MODIS bands 1 and 2 are both at 250 and 500 m resolution centred in the NIR (858 nm) and red (648 nm) wavelengths, and bands 3–7 are at 500 m resolution © 2007 CASI
Canadian Journal of Remote Sensing / Journal canadien de télédétection
centred in the blue (470 nm), green (550 nm), NIR (1240 nm), and SWIR (1640 and 2130 nm) wavelengths. The products use the MODIS L1B data as the primary input and perform corrections for the effect of gaseous absorption, molecule and aerosol scattering, and the adjacency effect (Vermote and Vermeulen, 1999). The MODIS 16 day composite NDVI products are designed to provide consistent spatial and temporal comparisons of vegetation conditions that can be used for monitoring photosynthetic activity. The MODIS VI algorithm operates on a per-pixel basis and relies on multiple observations over a 16 day period to generate a composite VI. Only the high-quality, cloud-free, filtered data are retained for compositing after applying a filter to the data based on quality, cloud, and viewing geometry (Huete et al., 2002). MODIS reflectance and VI version 4 products were reprojected from sinusoidal grid (SIN) projection to Universal Transverse Mercator (UTM) projection using the MODIS reprojection tool (MRT). The MODIS land data operational product evaluation (LDOPE) software was used to check the cloud status and data quality of all the products. To remove undetected cloud effects and assure data quality, some images were excluded if the cloud and mixed area in the study region exceeded 30% or the blue band reflectance was above 0.07 (Verbesselt et al., 2006). Discrepancy between Terra and Aqua MODIS surface reflectance data The consistency between Terra and Aqua daily surface reflectance products is assessed. Changes in the atmospheric conditions and satellite geometry including solar zenith angle, satellite zenith angle, and relative azimuth angle due to different overpass times of the two products may all contribute to the discrepancy between Terra and Aqua data. In the atmospheric correction process of MODIS daily surface reflectance, the impact of aerosols on visible and near-infrared reflectance is very important and it is difficult to eliminate completely. The MODIS atmospheric correction using either the MODIS-derived aerosol products or ancillary data makes the surface reflectance product less disturbed by the changes in aerosol concentration (Kaufman et al., 1997). However, the atmospheric correction algorithm assumes the land surface is uniform and Lambertian, which may lead to substantial errors in the surface reflectance retrieval (Lee and Kaufman, 1986). The mean error is 3%–7% in the red, 2%–5% in the nearinfrared (depending on optical depth), and up to 10%–20% in the extreme cases such as turbid atmospheric conditions (Hu et al., 1999; Vermote and Vermeulen, 1999). The error is larger at shorter wavelengths and with increasing solar and view zenith angles, especially in the backscattering direction and for a low vegetation cover. The bidirectional reflectance distribution function (BRDF) effect induced by the changes in the sensor– target–sun geometric condition is discussed later in the paper. Land cover classification using multitemporal NDVI data Land cover classification is an important step to assure accurate retrieval of VWC and other crop-specific parameters
© 2007 CASI
in relatively homogeneous surface conditions (Doraiswamy et al., 2004; Houborg et al., 2007). Although the NDVI does not provide land cover information directly, a time series of NDVI data can separate different land cover types based on their phenological or seasonal changes (e.g., Cihlar et al., 1996; Han et al., 2004; Wang and Tenhunen, 2004; Xiao et al., 2005). In this study, the MODIS 16 day VI products (with 250 m resolution) were used for land cover classification. There were only five cloud-free datasets of 16 day composite NDVI available, with the highest quality checked using qualityassessment (QA) flags. The middle days in the 16 day composite period were day of year (DOY) 89, 105, 121, 137, and 169 (30 March, 15 April, 1 May, 17 May, and 18 June, respectively). The unsupervised k-means classification method was applied to detect the vegetation with similar seasonal patterns (Han et al., 2004; Wang and Tenhunen, 2004). This method calculated the means of initial classes evenly distributed in the data space and iteratively clustered the pixels into the nearest class using a minimum-distance technique (Tou and Gonzalez, 1974). The initial number of classes was arbitrarily fixed at 15 for the sample area. In the post-treatment after classification, the classes with similar vegetation development stages were combined in the same land cover type according to their averaged NDVI profiles. The degree of similarity that was required to combine two classes was set to an average absolute NDVI difference of 0.05 at each stage to adjust the number of combined classes. The vegetation species across this district were almost exclusively comprised of winter wheat, cotton, planted woods, and secondary grasses from March to June. Winter wheat had a distinct vegetation development stage and hence can be distinguished from other species. As described previously, the wheat experienced a fast growth period with LAI from 2 to 5 during the first 2 weeks of April, whereas the natural vegetation was just sprouting, and cotton was sown at the beginning of April.
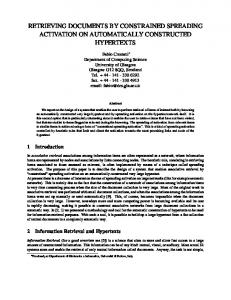
Results Land cover classification The original 15 land cover classes were combined into four major classes (see Figure 3): artificial surfaces (mainly urban and village areas), natural vegetation (woods and grasses), mixed crops (mainly mixtures of wheat and natural vegetation, and intercropping of wheat and cotton), and winter wheat, with proportions of 10.4%, 7.8%, 41.4%, and 40.4% of the total area, respectively. The NDVI time series of the four classes are given in Figure 4 and indicate that the natural vegetation had a much later leaf emergence (around DOY 89) than winter wheat. The NDVI of natural vegetation and wheat both peaked around DOY 105. However, because the NDVI composite was for a 16 day period, this date might not be very accurate. After DOY 105, the NDVI of natural vegetation remained constant for a long period, whereas the NDVI of winter wheat showed a clear sign of leaf senescence, particularly after DOY 137. The mixed 193
Vol. 33, No. 3, June/juin 2007
Figure 3. Land cover classification results. (a) False color composite MODIS image from 15 May 2006 (250 m, 2–1–1). (b) Unsupervised map based on multitemporal 16 day MODIS NDVI in 2006 (dark green for winter wheat, light green for mixed crops, cyan for natural vegetation, magenta for artificial surfaces).
crops class had an NDVI profile intermediate between those of wheat and natural vegetation. During the whole period, the artificial surfaces class had a much lower NDVI value than the other three classes, which is also distinguishable in Figure 4. The field near the flux tower (see Figure 1b) which was cultivated and irrigated nearly synchronously was chosen for validation. The corresponding pixels of this field in the 500 m image were selected based on the 250 m classified map. The land cover heterogeneity was a major problem due to the reduction in spatial resolution in the 500 m NDVI images. Therefore, the NDVI profile of each pixel was checked and pixels whose profile deviated far from the average were excluded to keep the standard deviation of the NDVI at each stage within 0.05. The field-averaged NDVI profile with 500 m resolution is also shown in Figure 4 and has a strong similarity to the NDVI profile with 250 m resolution, indicating a relatively homogeneous condition in the selected pixels.
194
Figure 4. The 16 day composite NDVI time series (250 m) of the four classes and field-averaged NDVI time series (500 m) of wheat. The dates represent the middle day of the composite period. DOY, day of year. © 2007 CASI
Canadian Journal of Remote Sensing / Journal canadien de télédétection
Figure 5. Temporal variations of surface reflectance and spectral indices. (a) Surface reflectance derived from Terra MODIS. (b) Surface reflectance derived from Aqua MODIS. (c) Surface reflectance combined from the two platforms. (d) Combined NDWI2130, NDWI1640, and 500 m NDVI.
Variation in surface reflectance and vegetation indices Discrepancy between the surface reflectance and vegetation indices of Terra and Aqua MODIS Figure 5 shows that the temporal variation of the combined field-averaged surface reflectance fluctuated sharply. A closer check on the dates when fluctuation happened showed that the fluctuation was mainly from the discrepancy between the surface reflectance of the two sensors. To examine the discrepancy, the difference between Terra and Aqua MODIS surface reflectance for winter wheat in bands 1, 2, and 7 (red, 648 nm; NIR, 858 nm; SWIR, 2130 nm) on DOY 110, 135, and 143 was calculated and is shown in Figure 6. The surface reflectance of the red band between the two sensors showed the largest differences (see Table 2). The surface reflectance of the three bands on DOY 110 was relatively consistent between the two sensors. The surface reflectance in the red and NIR bands on DOY 135 and 143 also showed some differences. However, the only noticeable difference for SWIR 2130 band was on DOY 143. As a result of the difference between Aqua and Terra MODIS surface reflectance, NDVI and NDWI had larger differences on DOY 135 and 143 than on DOY 110, as seen in the right panel of Figure 6.
© 2007 CASI
Directional effects on the surface reflectance and spectral indices As mentioned earlier in the paper, one of the principal factors causing the surface reflectance difference is the BRDF effect from the changes in the sun–target–view angles. The zoneaveraged solar zenith angle (SZA) and sensor zenith angle (VZA) are shown in Figure 7. On DOY 110, the VZA and relative azimuth angle between the two sensors were similar. On DOY 135, the VZAs of the two sensors were different (41° versus 25°) in the forward-scattering direction. On DOY 143, Terra had a VZA of 33° in the backscattering direction, and Aqua had a VZA of 53° in the forward-scattering direction. The large VZA, especially in the backscattering direction, usually caused large variation in the surface reflectance. This could also partially explain the variations of Aqua MODIS reflectance on DOY 135 compared with that on DOY 134 and 136 and the reflectance on DOY 149 compared with that on DOY 150. Therefore, only the products with a smaller view zenith angle and away from the hot spot in the backscattering direction were chosen for the data combination. Table 2 shows that band ratio helped to eliminate the difference in the multilook observations to some extent (Flowerdew and Haigh, 1995). However, the NDVI still exhibited a greater difference than NDWI2130, especially around DOY 134, demonstrating that NDVI was more sensitive to the angular effects than NDWI. This shortcoming of the NDVI may shadow its response to the growth of vegetation and may be a drawback to its usefulness in vegetation growth 195
Vol. 33, No. 3, June/juin 2007
Figure 6. Distribution of the difference between Terra and Aqua MODIS surface reflectance (left panels) and vegetation indices (right panels; NDVI and NDWI) of winter wheat at (a) DOY 110, (b) DOY 135, and (c) DOY 143.
196
© 2007 CASI
Canadian Journal of Remote Sensing / Journal canadien de télédétection Table 2. Mean (µ) and standard deviation (σ) of the difference between Terra and Aqua surface reflectance and vegetation indices (VI) of winter wheat (8557 pixels). Surface reflectance Red648
VI NIR858
SWIR2130
NDVI
NDWI
DOY
µ
σ
µ
σ
µ
σ
µ
σ
µ
σ
110 135 143
0.005 (6.8) 0.009 (13.0) 0.010 (14.0)
0.012 0.013 0.016
–0.022 (6.2) –0.031 (9.9) –0.015 (4.2)
0.025 0.015 0.016
–0.004 (4.0) –0.001 (1.2) –0.013 (12.5)
0.017 0.018 0.017
–0.036 (5.5) –0.067 (10.5) –0.051 (7.8)
0.063 0.067 0.071
–0.007 (1.2) –0.029 (4.9) 0.027 (4.9)
0.070 0.077 0.060
Note: The values in parentheses show the ratio (in %) of the difference (µ) to the averaged values of Terra and Aqua surface reflectance and Vis.
Figure 7. Sensor–target–sun geometric conditions of Terra and Aqua. (a) Comparison of SZA and VZA of the two sensors. (b) Comparison of the relative azimuth angle of the Terra (triangles) and Aqua (squares) sensors, with less than 90° indicating the backscattering direction and greater than 90° indicating the forward-scattering direction.
detection. It is evident in Table 2 from the mean and standard deviation of NDVI and the red and NIR surface reflectance that the NDVI would also be more sensitive to the discrepancy between two sensors in the red band because of its relatively low reflectance level. Estimation of wheat physiological parameters using spectral indices Regression analysis between wheat parameters and spectral indices VWC, dry matter, and LAI for those days with spectral data were interpolated from the dates with ground observations using the piecewise cubic Hermit polynomial method. Relationships between the wheat parameters and the spectral indices were developed. In the interpolation process, VWC, dry matter, and LAI on DOY 70 were set to 0.05 kg·m–2, 0.01 kg·m–2, and 0.05, respectively, because of fewer measurements at the early growing stage. MODIS-derived NDWI and NDVI values were used to estimate VWC and dry matter. In LAI estimation, EVI was also used in addition to NDWI and NDVI. Table 3 lists the determination coefficients in the linear regression between the indices and measured vegetation properties. In general, for the Terra and Aqua combined data, NDWI2130 had the best linear correlation with VWC, with a determination coefficient R2 as high as 0.84 (significance statistic F = 71.57, significance level p < 0.001, number of samples N = 16). The R2 value between NDWI1640 and VWC was also as high as 0.76 (F = 35.37, p < 0.001, N = 13). In
© 2007 CASI
contrast, NDVI had the worst linear correlation with VWC. Considering the data from the two sensors separately, VWC had a better linear correlation with the indices (NDWI1640, NDWI2130, and NDVI) from Aqua MODIS than from Terra MODIS. All R2 values are larger than 0.80 (0.85, 0.81, and 0.82, with p < 0.01 for all cases) for the three indices from Aqua MODIS data. NDWI1640 and NDWI2130 performed better than NDWI1240, which demonstrated that the longer infrared wavelengths (1640 and 2130 nm) were more sensitive to crop water content than 1240 nm. Table 3 also shows that the linear correlations between the indices (NDWI1640, NDWI2130, and NDVI) and dry matter content seem comparable. The R2 value between NDWI1240 and dry matter content was very low (only 0.05); this may be because the change in dry matter content would affect the surface reflectance in the near-infrared wavelengths (1240 and 858 nm) in a very similar way (Chen et al., 2005). In contrast, a significant positive correlation was observed between the SWIR-based NDWI and dry matter content from DOY 87 to 139 before the blooming stage (NDWI2130: F = 44.96, p < 0.001, N = 11; NDWI1640: F = 30.29, p < 0.001, N = 10), and a significant negative correlation was found from DOY 128 to DOY 159 after the blooming stage (NDWI2130: F = 26.62, p < 0.001, N = 11). Table 4 lists the R2 values for the relationship between the two SWIR-based NDWI indices and dry matter at different wheat growth stages. The different correlation results may be related to the characteristics of the wheat growth. Before the heading stage (around DOY 120), the NDWI increased linearly with the increase in crop water content and 197
198
0.42 0.39 0.23 0.00 0.14 0.00 0.25 0.39 0.23 0.38 0.50 0.36 0.54 0.65 0.61 0.61 0.39 0.51
0.66 0.74 0.68
NDVI NDWI2130 NDWI1640
dry matter as the vegetation grew. After the wheat came into the heading stage, the NDWI decreased as the total crop water content started decreasing while dry matter kept increasing, especially at the grain-filling period. The linear correlations between LAI and other indices were poor, especially between NDVI and LAI. The only exception was that NDWI1240 was closely related to LAI. VWC and dry matter estimation using NDWI It appears that the angular effects on NDVI were so significant (see Figure 5d) that NDVI would be unable to detect crop growth. Therefore, only the SWIR-based NDWI indices were used in the additional analysis. The linear functions using NDWI1640 and NDWI2130 to estimate wheat VWC were developed with the following forms (see Figure 8): VWC = 12.49 × NDWI1640 – 0.44
(R2 = 0.76)
(1)
VWC = 10.28 × NDWI2130 – 1.98
(R2 = 0.84)
(2)
For estimation of dry matter, NDWI1640 was not considered because of its poor temporal coverage at the maturing stage. A two-stage function using NDWI2130 was developed with the best determination coefficient as follows: (i) before the blooming stage
0.57 0.45 0.44
0.69 0.85 0.76
0.70 0.81 0.84
0.29 0.82 0.50
0.26 0.05 0.05
0.50 0.53 0.47
dry matter = 2.92 × NDWI2130 – 0.68
Terra Aqua Terra–Aqua
LAI
NDWI1240 NDVI NDWI2130 NDWI1640
Dry matter content
NDWI1240 NDVI NDWI2130 NDWI1640 NDWI1240
VWC
Table 3. Summary of determination coefficient (R2) values using spectral indices (NDWI based on the SWIR 1240, 1640, and 2130 nm bands; NDVI; and EVI) for the estimation of wheat growth status parameters (VWC, dry matter, and LAI) in linear regressions.
EVI
Vol. 33, No. 3, June/juin 2007
(R2 = 0.83)
(3)
and (ii) after the blooming stage dry matter = –1.99 × NDWI2130 + 2.26
(R2 = 0.75)
(4)
Evaluation of the possibility of NDWI as an indicator of crop water deficiency Response of NDWI to soil moisture changes The daily rainfall and averaged soil moisture at the root depth of 0–80 cm were used to examine the response of NDWI to temporal changes (see Figure 9). During the whole experimental period, the wheat was irrigated twice on DOY 69 and 107, which can be seen from the two obvious upward spikes in the top soil moisture profiles right after irrigation. After the first irrigation, NDWI kept increasing until DOY 110, and this was attributed to the rapid crop growth when LAI increased from nearly 0 to 6. After a short period of decline after DOY 110, NDWI increased again to a peak around DOY 128, and this was partially due to rainfall during that period. After the peak, the changes in NDWI were also found to be closely related to the rainfall. The linear correlation between NDWI and the averaged soil moisture profiles at different layers (0–10, 0–20, 0–40, 0–80, and 0–160 cm) was also analyzed. There was a notable change in the determination coefficient R2 for the linear relationship between NDWI2130 and soil moisture: for the 0–10 cm layer, R2 increased from 0.07 (DOY 87 to 159) to 0.80 (DOY 110 to 159; F = 47.49, p < 0.001, N = 14); for the 0–160 cm layer, R2
© 2007 CASI
Canadian Journal of Remote Sensing / Journal canadien de télédétection Table 4. Linear correlation coefficients using NDWI1640 and NDWI2130 to estimate dry matter content at different wheat growing stages. NDWI1640
NDWI2130
Stage beginning date
Stage ending date
A
B
R2
A
B
R2
Start (87) Start (87) Start (87) Jointing (110) Jointing (110) Blooming (128) Blooming (128) Maturing (143)
Jointing (114) Blooming (139) Blooming (159) Blooming (139) Maturing (159) Blooming (139) Maturing (159) Maturing (159)
–0.19 –0.18 — 0.62 — 1.11 — —
2.99 3.22 — 1.01 — –0.16 — —
0.79 0.76 — 0.13 — 0.54 — —
–0.58 –0.68 0.45 0.58 2.28 1.18 2.26 2.19
2.53 2.92 1.09 0.68 –2.17 –0.22 –1.99 –1.68
0.89 0.83 0.08 0.04 0.49 0.76 0.75 0.85
Note: Day of year is given in parentheses. NDWI1640 was not considered in the analysis involving some stages because there were only a few datasets available. A, intercept; B, slope; R2, determination coefficient.
Figure 8. VWC and dry matter estimation using NDWI and NDVI from combined MODIS data. (a) Linear VWC estimation using NDWI1640 and NDWI2130: VWC = 12.495 × NDWI1640 – 0.4378 (R2 = 0.76); VWC = 10.285 × NDWI2130 – 1.9796 (R2 = 0.84). (b) Two-step linear estimation of dry matter content using NDWI2130 and NDWI1640. Before the blooming stage: dry matter = 2.92 × NDWI2130 – 0.68 (R2 = 0.83), and dry matter = 3.22 × NDWI1640 – 0.18 (R2 = 0.76). After the blooming stage: dry matter = –1.99 × NDWI2130 + 2.26 (R2 = 0.75), and dry matter = –1.71 × NDWI1640 + 1.72 (R2 = 0.47). (c) Polynomial VWC estimation using NDVI: VWC = –51.726 × NDVI2 + 70.48 × NDVI – 20.242 (R2 = 0.69). (d) Exponential dry matter estimation using NDVI: dry matter = 3.7351 × NDVI3.4142 (R2 = 0.72).
increased from 0.0 to 0.44 (F = 9.58, p < 0.01, N = 14). In contrast, a much weaker correlation was found between NDWI1640 and soil moisture from DOY 110 to 150, with an R2 value of 0.40 for the 0–10 cm layer (F = 5.26, p < 0.05, N = 10) and 0.24 for the 0–160 cm layer (F = 2.58, p = 0.15, N = 10). This may be in part because NDWI1640 had different temporal coverage from NDWI2130 and because of the influence from the data quality of Aqua band 6 (only 5 out of 20 detectors were
© 2007 CASI
functional), which had been noticed in the data quality assessment. The previous correlations appeared to be better as the wheat grew and became more developed. From the correlation analysis, it was believed that NDWI was strongly affected by the changes in soil moisture and may be a good indicator of the soil moisture changes, particularly at the later growth stages of its life cycle.
199
Vol. 33, No. 3, June/juin 2007
Figure 9. Response of NDWI to soil moisture changes from March to June 2006. In situ rainfall and averaged soil moisture at 0–80 cm depth, NDWI1640, and NDWI2130 were combined in the analysis.
Assessment of the capability of NDWI to detect crop water deficiency The temporal series of soil moisture and observed VWC was used to analyze crop water deficiency. The volumetric soil moisture at field capacity was about 0.37 as calculated using the van Genuchten equation with field-calibrated parameters. The soil water content above the 20 cm depth (available for 70%–80% of wheat water utility) usually should be kept at 80% of field capacity content for wheat growth after the jointing stage in April and a little lower after grain filling at the end of May. However, the actual availability of soil water in this layer was lower than this level except for some days when it temporally exceeded this value due to irrigation (DOY 107) and heavy rainfall (DOY 124). There were three periods observed with obvious declines in soil moisture after DOY 110. During the first period from DOY 110 to 123 and when VWC is increasing quickly, (see Figure 10), the NDWI decreased, showing that the crop might encounter some degree of water deficit. The crop was in a critical growth stage, and wheat is sensitive to a shortage of water. During another rain-free period from DOY 130 to DOY 140, NDWI had a sharp decline on DOY 136 and then an increase after a rainfall on DOY 141. This also demonstrated the water shortage during this period. The third period was observed with another sudden drop in NDWI after DOY 149. Although this was consistent with the decrease in soil moisture and VWC, potentially it may also be a result of the rapid loss of crop water content when wheat comes into the leaf senescence stage.
Discussion and conclusions The Terra and Aqua MODIS derived NDWI and NDVI were used jointly for estimating the biophysical parameters of winter wheat in the Weishan Irrigation Zone along a downstream reach of the Yellow River, China, where rainfall shortages during the 200
Figure 10. Temporal variations of measured VWC, dry matter, and LAI with the growth of wheat. The five wheat growing stages are distinguished using different backgrounds. The wheat turned green in March and experienced jointing during April (from DOY 90 to 120). The wheat reached the heading stage during the first week of May and was then in full bloom. After DOY 140, the wheat began grain filling and matured.
wheat-growing season are a significant problem. The NDWI was evaluated for analyzing crop water deficiency. The weather characteristics during the winter wheat growing season were discussed. According to rain gauges installed around the flux tower, 2006 was a dry year and rainfall was relatively low compared with the long-term average for the summer. The annual precipitation in 2005 was 680 mm, which was more than the long-term average (580 mm/year). However, the major factor limiting the wheat growth was the rainfall shortage in the spring (from March to May), which was not directly proportional to the yearly rainfall. This was because the winter wheat season was usually in the dry spell, which often resulted in exposure of the wheat to water shortages, especially during the major growing season (from March to © 2007 CASI
Canadian Journal of Remote Sensing / Journal canadien de télédétection
June). In the whole crop season from June 2005 to May 2006, the rainfall was 881 mm, and there was only 103 mm during the wheat season from 14 October 2005 to 10 June 2006. Although the annual precipitation in 2005 was greater than the long-term mean, the rainfall from 18 March to 10 June 2005 was only 70.4 mm, and the rainfall from 1 March to 10 June 2006 was 90.5 mm. Therefore, the shortage of rainfall in the spring, especially March and April, had a great impact on wheat growth in this area. The water demand for the wheat during this period was mainly provided by irrigation. Given uniformly planted crop fields and the winter wheat as the dominant crop in this district, the sample measurements scaled to field averages can be compared with satellite data for index-evaluation purposes. In this irrigation area, the field scale was comparable to 250 m. The mixed pixels were excluded by comparing the NDVI profiles at 500 m resolution with those at 250 m resolution. However, the field size was still a major limiting factor for this area because the field dimension was only at a scale similar to that of MODIS data for 500 m resolution. The problem may be more significant if the desired parameters were crop specific, which would require detailed classification at a higher resolution. The discrepancy between the surface reflectance of Terra and Aqua was distinct and resulted in fluctuation in the temporal variations of the combined surface reflectance and vegetation indices. A large VZA off-nadir especially in the backscattering direction contributed greatly to the discrepancy. Therefore, the images with extreme VZA values should be excluded, or alternatively the surface reflectance should be normalized to a constant viewing geometric condition before the composite analysis. Compared to NDVI, NDWI was more resistant to the changes of the sun–target–view geometry between the two sensors. Therefore, NDWI may potentially be more reliable for monitoring crop growth condition, particularly when satellite data from two or more sensors are used jointly. The SWIR (1640 and 2130 nm) based NDWI1640 and NDWI2130 showed much better correlation with VWC than NDVI and the NIR (1240 nm) based NDWI1240, demonstrating the advantages of SWIR wavelengths over NIR wavelengths in VWC retrieval. For dry matter estimation, a significant positive correlation between NDWI1640, NDWI2130, and dry matter content was found before the blooming stage, and a strong negative correlation was observed between NDWI2130 and dry matter content after the blooming stage. This can be explained using the different characteristics of water and dry matter accumulation during the wheat growing periods. The correlation at the later growth stages may be very valuable for NPP estimation, since the dry matter content is then directly related to the crop yield. Combining the in situ rainfall and soil moisture data, NDWI was examined as an indicator of water deficiency during the major life cycle of wheat. The high correlation between NDWI and soil moisture after DOY 110 illustrates that NDWI may also be used as an indicator of changes in soil moisture. Noticeable declines were observed in NDWI from the jointing stage to the heading stage (DOY 110 to 123) during the period © 2007 CASI
when VMC was increasing, and this may represent the occurrence of a water shortage. A conclusion from the appearance of NDWI temporal variations is that winter wheat encountered some degree of water deficit, and this was supported by field observation. Therefore the NDWI can be used as an indicator of crop water deficiency. In future work, the field observation should be conducted at a larger spatial scale and with an intensified interval of 1 week. It will be helpful and valuable to further validate the effectiveness of satellite data in retrieving wheat growth parameters and assessing crop water deficiency.
Acknowledgements This research was supported by the National Natural Science Founding Projects of China (project 50679029) and the National 973 Project of China (project 2006CB403405). The EOS Data Gateway is acknowledged for the data distribution of MODIS products.
Reference Ceccato, P., Flasse, S., Tarantola, S., Jacquemoud, S., and Grégoire, J.-M. 2001. Detecting vegetation leaf water content using reflectance in the optical domain. Remote Sensing of Environment, Vol. 77, No. 1, pp. 22–33. Ceccato, P., Gobron, N., Flasse, S., Pinty, B., and Tarantola, S. 2002a. Designing a spectral index to estimate vegetation water content from remote sensing data: Part 1. Theoretical approach. Remote Sensing of Environment, Vol. 82, No. 2-3, pp. 188–197. Ceccato, P., Flasse, S., and Grégoire, J. 2002b. Designing a spectral index to estimate vegetation water content from remote sensing data: Part 2. Validation and applications. Remote Sensing of Environment, Vol. 82, No. 2-3, pp. 198–207. Chen, D., Jackson, T.J., Li, F., Cosh, M.H., Walthall, C., and Anderson, M. 2003. Estimation of vegetation water content for corn and soybeans with a Normalized Difference Water Index (NDWI) using Landsat Thematic Mapper data. In IGARSS’03, Proceeding of the International Geosciences and Remote Sensing Symposium, 21–25 July 2003, Toulouse, France. Institute of Electrical and Electronics Engineers (IEEE), New York. pp. 2853–2856. Chen, D., Huang, J., and Jackson, T.J. 2005. Vegetation water content estimation for corn and soybeans using spectral indices derived from MODIS near- and short-wave infrared bands. Remote Sensing of Environment, Vol. 98, No. 2-3, pp. 225–236. Cihlar, J., Ly, H., and Xiao, Q. 1996. Land cover classification with AVHRR multichannel composites in northern environments. Remote Sensing of Environment, Vol. 58, No. 1, pp. 36–51. Doraiswamy, P.C., Hatfield, J.L., Jackson, T.J., Akhmedov, B., Prueger, J., and Stern, A. 2004. Crop condition and yield simulation using Landsat and MODIS. Remote Sensing of Environment, Vol. 92, No. 4, pp. 548–559. Fensholt, R., and Sandholt, I. 2003. Derivation of a shortwave infrared water stress index from MODIS near- and short-wave infrared data in a semiarid environment. Remote Sensing of Environment, Vol. 87, No. 1, pp. 111–121. Flowerdew, R.J., and Haigh, J.D. 1995. An approximation to improve accuracy in the derivation of surface reflectances from multi-look satellite radiometers. Geophysical Research Letters, Vol. 2, No. 13, pp. 1693–1696. 201
Vol. 33, No. 3, June/juin 2007 Fourty, T., and Baret, F. 1996. Vegetation water and dry matter contents estimated from top-of-the-atmosphere reflectance data: a simulation study. Remote Sensing of Environment, Vol. 61, No. 1, pp. 34–45. Gao, B.-c. 1996. NDWI — a normalized difference water index for remote sensing of vegetation liquid water from space. Remote Sensing of Environment, Vol. 58, No. 3, pp. 257–266. Gao, B.-c., and Goetzt, A.F.H. 1995. Retrieval of equivalent water thickness and information related to biochemical components of vegetation canopies from AVIRIS data. Remote Sensing of Environment, Vol. 52, No. 3, pp. 155–162. Han, K.-S., Champeaux, J.-L., and Roujean, J.-L. 2004. A land cover classification product over France at 1 km resolution using SPOT4/VEGETATION data. Remote Sensing of Environment, Vol. 92, No. 1, pp. 52–66. Houborg, R., Soegaard, H., and Boegh, E. 2007. Combining vegetation index and model inversion methods for the extraction of key vegetation biophysical parameters using Terra and Aqua MODIS reflectance data. Remote Sensing of Environment, Vol. 106, No. 1, pp. 39–58. Hu, B.X., Lucht, W., and Strahler, A.H. 1999. The interrelationship of atmospheric correction of reflectances and surface BRDF retrieval: a sensitivity study. IEEE Transactions on Geoscience and Remote Sensing, Vol. 37, No. 2, pp. 724–738. Huete, A., Justice, C., and van Leeuwen, W. 1999. MODIS vegetation index (MOD13). National Aeronautics and Space Administration (NASA), Washington, D.C. Algorithm Theoretical Basis Document (ATBD) ATBDMOD-13. Version 3.0. 131 pp. Available from http://modis.gsfc.nasa.gov/ data/atbd/atbd_mod13.pdf. Huete, A., Didan, K., Miura, T., Rodriguez, E.P., Gao, X., and Ferreira, L.G. 2002. Overview of the radiometric and biophysical performance of the MODIS vegetation indices. Remote Sensing of Environment, Vol. 83, No. 12, pp. 195–213. Hunt, E.R., Jr., and Rock, B.N. 1989. Detection of changes in leaf water content using near- and middle-infrared reflectance. Remote Sensing of Environment, Vol. 30, No. 1, pp. 43–54. Jackson, T.J., Chen, D., Cosh, M., Li, F., Anderson, M., Walthall, C., Doriaswamy, P., and Hunt, E.R. 2004. Vegetation water content mapping using Landsat data derived normalized difference water index for corn and soybeans. Remote Sensing of Environment, Vol. 92, No. 4, pp. 475–482. Kaufman, Y.J., Wald, A.E., Remer, L.A., Gao, B., Li, R., and Flynn, L. 1997. The MODIS 2.1-µm channel-correlation with visible reflectance for use in remote sensing of aerosol. IEEE Transactions on Geoscience and Remote Sensing, Vol. 35, No. 5, pp. 1286–1298. Lee, T.Y., and Kaufman, Y.J. 1986. Non-Lambertian effects on remote sensing of surface reflectance and vegetation index. IEEE Transactions on Geoscience and Remote Sensing, Vol. GE-24, No. 5, pp. 699–708.
Becker. National Aeronautics and Space Administration (NASA), Washington, D.C. NASA SP-351, Vol. 1, pp. 309–317. Salomonson, V., Guenther, B., and Masuoka, E. 2001. A summary of the status of the EOS Terra mission moderate resolution imaging spectroradiometer (MODIS) and attendant data product development after one year of onorbit performance. In IGARSS’2001, Proceedings of the International Geoscience and Remote Sensing Symposium, 9–13 July 2001, Sydney, Australia. Edited by T.I. Stein. Institute of Electrical and Electronics Engineers (IEEE), New York. Vol. 3, pp. 1197–1199. Serrano, L., Ustin, S.L., Roberts, D.A., Gamon, J.A., and Penuelas, J. 2000. Deriving water content of chaparral vegetation from AVIRIS data. Remote Sensing of Environment, Vol. 74, No. 3, pp. 570–581. Sims, D.A., and Gamon, J.A. 2002. Estimation of vegetation water content and photosynthetic tissue area from spectral reflectance: a comparison of indices based on liquid water and chlorophyll absorption features. Remote Sensing of Environment, Vol. 84, No. 4, pp. 526–537. Tou, J.T., and Gonzalez, R.C. 1974. Pattern recognition principles. AddisonWesley Publishing Company, Reading, Mass. Tucker, C.J. 1980. Remote sensing of leaf water content in the near infrared. Remote Sensing of Environment, Vol. 10, No. 1, pp. 23–32. Verbesselt, J., Somers, B., van Aardt, J., Jonckheere, I., and Coppin, P. 2006. Monitoring herbaceous biomass and water content with SPOT VEGETATION time-series to improve fire risk assessment in savanna ecosystems. Remote Sensing of Environment, Vol. 101, No. 3, pp. 399–414. Vermote, E.F., and Vermeulen, A. 1999. Atmospheric correction algorithm: spectral reflectances (MOD09), version 4.0. National Aeronautics and Space Administration (NASA), Washington, D.C. Algorithm Technical Background Document ATBD-MOD-9. Wang, Q., and Tenhunen, J.D. 2004. Vegetation mapping with multitemporal NDVI in North Eastern China Transect (NECT). International Journal of Applied Earth Observation and Geoinformation, Vol. 6, pp. 17–31. Xiao, X., Boles, S., Liu, J., Zhuang, D., Frolking, S., Li, C., Salas, W., and Moore, B. 2005. Mapping paddy rice agriculture in southern China using multi-temporal MODIS images. Remote Sensing of Environment, Vol. 95, No. 4, pp. 480–492. Zarco-Tejada, P.J., and Ustin, S.L. 2001. Modelling canopy water content for carbon estimates from MODIS data at land EOS validation sites. In IGARSS’2001, Proceedings of the International Geoscience and Remote Sensing Symposium, 9–13 July 2001, Sydney, Australia. Edited by T.I. Stein. Institute of Electrical and Electronics Engineers (IEEE), New York. Vol. 1, pp. 342–344. Zarco-Tejada, P.J., Rueda, C.A., and Ustin, S.L. 2003. Water content estimation in vegetation with MODIS reflectance data and model inversion methods. Remote Sensing of Environment, Vol. 85, No. 1, pp. 109–124.
Penuelas, J., Filella, I., Biel, C., Serrano, L., and Save, R. 1993. The reflectance at the 950–970 mm region as an indicator of plant water status. International Journal of Remote Sensing, Vol. 14, pp. 1887–1905. Rollin, E.M., and Milton, E.J. 1998. Processing of high spectral resolution reflectance data for the retrieval of canopy water content information. Remote Sensing of Environment, Vol. 65, No. 1, pp. 86–92. Rouse, J.W., Jr., Haas, R.H., Schell, J.A., and Deering, D.W. 1973. Monitoring vegetation systems in the Great Plains with ERTS. In Proceedings of the Symposium on Significant Results Obtained from the Earth Resources Technology Satellite-1. Technical presentations, section A, 5–9 March 1973, New Carrollton, Md. Edited by S.C. Freden, E.P. Mercanti, and M.A. 202
© 2007 CASI