SFH80 A096068 – Open
REPORT
Carbon footprint and energy use of Norwegian seafood products
Ulf Winther, Friederike Ziegler, Erik Skontorp Hognes , Andreas Emanuelsson, Veronica Sund and Harald Ellingsen
SINTEF Fisheries and Aquaculture December 2009
SINTEF REPORT TITLE
SINTEF Fisheries and Aquaculture International Projects and Consulting Address: NO-7465 Trondheim, Norway Location: SINTEF Sealab Brattørkaia 17B Telephone: +47 4000 5350 Fax: +47 932 70 701 E-mail:
[email protected] Internet: www.sintef.no Enterprise No.: NO 980 478 270 MVA REPORT NO.
CLASSIFICATION
Carbon footprint and energy use of Norwegian seafood products
AUTHOR(S)
Winther, U., Ziegler, F., Skontorp Hognes, E., Emanuelsson, A., Sund, V., Ellingsen, H. CLIENT(S)
The Fisheries and Aquaculture Industry Research Fund (FHF) CLIENTS REF.
SFH80 A096068 Open
Terje Flatøy
CLASS. THIS PAGE
ISBN
PROJECT NO.
Open
978-82-14-04925-1 860136
NO. OF PAGES/APPENDICES
91
ELECTRONIC FILE CODE
PROJECT MANAGER (NAME, SIGN.)
CHECKED BY (NAME, SIGN.)
Carbon footprint final report
Ulf Winther
Vegar Johansen
FILE CODE
DATE
APPROVED BY (NAME, POSITION, SIGN.)
2009-12-03
Ulf Winther
ABSTRACT
Carbon footprint and energy use has been quantified for 22 Norwegian seafood products most of which currently constitute important components of Norwegian seafood export with regard to volume and value. The conclusions from this work include that Norwegian seafood products are competitive from a carbon footprint and energy use perspective, both compared to other seafood products and compared to land-based production of meat products. Important focus areas for fisheries are improving the fuel efficiency further and replacing refrigerants with high global warming potential, used in onboard cooling systems, by climate neutral ones. For salmon farming, optimising feed use and feed composition is paramount with regard to reducing climate impact from salmon aquaculture products. For mussel farming increased edible yield from harvested mass, increasing byproduct use and decreasing fuel use on vessels used for maintenance and harvest are areas to focus on. General conclusions for all seafood products in this analysis are that increasing the proportion of frozen and super-cooled seafood to fresh, which in turn decreases the need for air freight and other resource-intensive means of transport, would lead to major improvement. Increasing the edible yield and use of by-products would likewise lead to lower emissions. Processing more seafood in Norway before export is also advantageous because of better possibilities to make use of by-products and decreased need for transportation when exporting products rather than whole fish. KEYWORDS GROUP 1
ENGLISH
NORWEGIAN
Carbon footprint
Karbonavtrykk
Aquaculture Fisheries Life Cycle Assessment (LCA)
Havbruk Fiskeri Livsløpsanalyse
GROUP 2 SELECTED BY AUTHOR
TABLE OF CONTENTS Summary ........................................................................................................................................ 3 1
Introduction ............................................................................................................................ 6 1.1 Seafood, environmental impact, carbon footprint and energy use ................................. 6 1.2 Background and organisation of the project................................................................... 6
2
Goal and scope........................................................................................................................ 8 2.1 Goal ................................................................................................................................ 8 2.2 Modelling approach and system boundary ..................................................................... 8 2.3 Seafood products studied (brief system descriptions) .................................................... 9 2.4 Functional unit .............................................................................................................. 11 2.5 Comparison with competing products .......................................................................... 11
3
Methodology ......................................................................................................................... 12 3.1 Data inventory seafood chains...................................................................................... 12 3.2 Impact Assessment ....................................................................................................... 12 3.3 Allocation strategy........................................................................................................ 12 3.4 Strategy to handle things that were left out .................................................................. 13 3.5 Sensitivity analysis ....................................................................................................... 14
4
Inventory results .................................................................................................................. 15 4.1 Brief supply chain descriptions .................................................................................... 15 4.2 Capture fisheries ........................................................................................................... 21 4.2.1 Fuel use in fishing............................................................................................. 21 4.2.2 Refrigerants ...................................................................................................... 27 4.3 Aquaculture .................................................................................................................. 28 4.3.1 Salmon feed production .................................................................................... 28 4.3.2 Salmon farming ................................................................................................ 31 4.3.3 Mussel farming and processing ........................................................................ 32 4.4 Fish processing ............................................................................................................. 32 4.4.1 Salmon harvesting ............................................................................................ 32 4.4.2 Filleting ............................................................................................................. 33 4.4.3 Freezing ............................................................................................................ 34 4.4.4 Storage .............................................................................................................. 34 4.4.5 Salting ............................................................................................................... 34 4.4.6 Drying ............................................................................................................... 34 4.5 Transport....................................................................................................................... 34 4.5.1 Road .................................................................................................................. 35 4.5.2 Rail.................................................................................................................... 37 4.5.3 Sea transportation ............................................................................................. 37 4.5.4 Air ..................................................................................................................... 38 4.5.5 Refrigeration during transport .......................................................................... 39 4.6 Transport packaging ..................................................................................................... 41 4.7 Electricity production ................................................................................................... 42
5
Results ................................................................................................................................... 43 5.1 Aquaculture .................................................................................................................. 43 5.2 Capture fisheries ........................................................................................................... 44 5.3 Processing in Norway vs. abroad ................................................................................. 46 5.4 Fresh or frozen .............................................................................................................. 47 5.5 Farmed or wild ............................................................................................................. 51 5.6 Transport distance and transport mode......................................................................... 53
2
5.7 5.8 5.9 5.10
Traditional and new products ....................................................................................... 55 Energy use .................................................................................................................... 58 Sensitivity analysis ....................................................................................................... 63 Comparison with competing products .......................................................................... 66
6
Discussion.............................................................................................................................. 68 6.1 Overall discussion of results ......................................................................................... 68 6.2 The role of post-wholesaler activities........................................................................... 70 6.3 Methodological aspects ................................................................................................ 71 6.4 Limitation of application of results .............................................................................. 71 6.5 Improvement options .................................................................................................... 72
7
Conclusions and outlook ..................................................................................................... 74
8
References ............................................................................................................................. 75
APPENDIX A: External review................................................................................................. 80 APPENDIX B: Allocation rationale .......................................................................................... 82
3
Summary Carbon footprint and energy use has been quantified for 22 Norwegian seafood products most of which currently constitute important components of Norwegian seafood export with regard to volume and value. A product currently representing a low volume was also included due to its potential for development and highly different production method, farmed blue mussels. The products stem from capture fisheries for herring, mackerel, cod, saithe and haddock or from aquaculture of blue mussels and salmon. After landing or slaughter fish and mussels are processed into a variety of fresh, frozen, round, gutted or fillet products after which they are transported to the respective country and city where the wholesaler is located. The large number of chains assessed using the same methodology, ISO standardised Life Cycle Assessment methodology, following the supply chains from cradle-to-gate, allows for comparison between supply chains illustrating the effect single aspects such as species, transport mode and distance and product form. In general, the products from pelagic fisheries were found to have the lowest carbon footprint while mussels, products from demersal fisheries and salmon were higher and in the same range (Figures 1 and 2). The range in carbon footprint was 1-14 kilos of carbon dioxide (CO2) equivalents per kilo of edible product delivered to the wholesaler, the range in energy use was 16-210 megajoule (MJ) equivalents. The lowest value was achieved by round frozen herring and mackerel taken to Moscow by bulk shipping and train and the highest by gutted salmon taken to Tokyo by airfreight. The two categories studied, energy use and carbon footprint, were highly correlated, indicating that the use of fossil fuels dominated the carbon footprint result. The use of the old generation of refrigerants, which were phased out in other applications decades ago, turned out to be the second largest contributor to the carbon footprint for almost all chains originating in demersal fisheries contributing to up to 30 % to the total carbon footprint. The exception to this was cod processed in China where transport was largest, diesel use in fishing second and refrigerants ranked third. Less surprising was that diesel use in fishing was the most important contributor in the other demersal chains, despite the fact that all fisheries were relatively fuel efficient compared to literature data. Pelagic fisheries are so efficient already that other activity such as packaging, processing and transportation become more important. It was shown that processing in Norway is favourable compared to exporting whole fish for processing abroad, since by-products are used to a greater extent in Norway and part of the transport activity is avoided. Freezing or super-cooling of seafood requires some energy, but especially when long distance transportation is involved, the longer shelf-life of frozen or supercooled fish makes it possible to transport it in a much more efficient manner which is more important for the overall result. Moreover, frozen and super-cooled fish does not require use of ice as does fresh fish which is positive both due to the electricity used for ice production, but more importantly due to the larger amount of fish that can be loaded per pallet, truck and container. While there is a clear effect of transport distance, the factors transport mode and transport time are equally important.
4
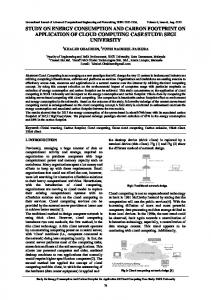
1 Salmon, Fresh gutted to Paris 2 Salmon, Fresh gutted to Oslo 3 Salmon, Fresh gutted to Moscow 13,7
4 Salmon, Fresh gutted to Tokyo 5 Salmon, Frozen gutted to Shanghai
Feed production Aquaculture Processing Product Transport Transport packaging
6 Salmon, Fresh f illet to Paris 7 Salmon, Frozen f illet to Paris 8 Blue mussels, Fresh to Paris 0
1
2 3 4 5 Greenhouse gas emissions (kg CO2e/kg edible seafood at wholesaler)
Figure 1 Overall carbon footprint results for products from aquaculture
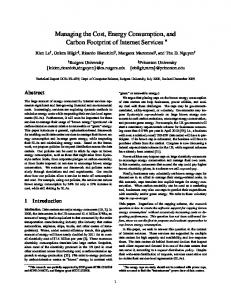
9 Cod, Fresh gutted to Paris 10 Cod, Fresh f illet to Oslo 11 Cod, Fresh f illet to Paris 12 Cod, Frozen f illet to Paris 13 Cod, Frozen f illet to Paris via China 14 Cod, Saltf ish to Lisbon 15 Cod, Clipf ish to Lisbon 16 Saithe, Frozen f illets to Berlin 17 Haddock, Frozen gutted to London 18 Haddock, Fresh gutted to London Diesel in f ishery Cooling agent in f ishery Processing Product Transport Transport packaging
19 Herring, Roundf rozen to Moscow 20 Herring, Frozen Fillet to Moscow 21 Roundf rozen mackerel Tokyo 22 Roundf rozen mackerel Moscow 0
1
2
3
4
Greenhouse gas emissions (kg CO2e/kg edible seafood at wholesaler)
Figure 2 Overall carbon footprint results for products from capture fisheries
5
5
In comparison with land-based meat production systems for chicken, pig and beef, the seafood production systems studied had a carbon footprint in the range of chicken or lower and an energy use in the range of pork or lower. A number of aspects are treated in the sensitivity analysis to test the robustness of the results. Improvement options for fisheries include the rapid replacement of freons by climate and ozone neutral refrigerants on both pelagic and demersal vessels and decreasing the fuel use in fishing further. To achieve this, more long-term changes are required with regard to the design of the fisheries management system and introduction of technological measures, taking into account the resulting carbon footprint of the seafood products produced. For blue mussels increased yield from harvest, lower fuel use on vessels and use of by-products represents a considerable improvement potential. For salmon, feed production dominates the results and therefore, decreased feed use and choosing the least resource-demanding feed ingredients that fulfil nutritional requirements of salmon represent the main improvement options. As already stated, general improvement options are to process more seafood in Norway before export and to export a larger proportion of frozen or super-cooled fish.
For questions or comments regarding this report, please contact: Ulf Winther,
[email protected] Friederike Ziegler,
[email protected]
6
1 Introduction 1.1 Seafood, environmental impact, carbon footprint and energy use Traditionally, environmental concerns regarding seafood production have been focused on biological impact on target and by-catch stocks as well as ecosystem effects of certain types of fishing gear. Less attention has been paid to the fact that seafood production also contributes to many types of environmental effects above the ocean surface due to modern fishing and fish farming technology. The biological impacts on marine ecosystems have not become less important, quite the contrary. In recent years, however, resource use to produce supply materials and support the production chains of farmed and fished seafood products and resulting emissions to air, water and ground have received increased attention. A method that has been used to quantify this resource use and emissions is Life Cycle Assessment (LCA) and the number of published seafood LCA studies has grown rapidly from zero during the last decade (e.g. Ellingsen & Aanondsen 2006, Ellingsen et al. 2009, Hospido & Tyedmers 2005, Pelletier et al. 2009, Thrane 2004a b, Ziegler et al. 2003, Ziegler & Valentinsson 2008, Ziegler et al. 2009). Actually, some authors have drawn the conclusion that there is a correlation between biological impact and high energy use due to the fact that when a stock is over-exploited, more energy is required to fish a certain amount of fish compared to the same stock sustainably fished with the same gear (Tyedmers 2001, 2004, Schau et al. 2009, Ziegler 2006), suggesting that energy use or global warming emissions could be a useful indicator of overall environmental impact of a fishery (Thrane 2006). Some words about the terminology used in this report. Carbon footprint, global warming emissions, greenhouse gas emissions, climate impact and global warming potential are all used as synonyms. It means a weighted sum of emissions contributing to global warming according to the most recent IPCC guidelines (Intergovernmental Panel on Climate Change of the United Nations) using the 100 year perspective. It is measured in carbon dioxide equivalents (CO2e), i.e. all global warming emissions are weighted compared to the global warming potential of carbon dioxide, which has the indicator 1 kg CO2e/kg. The carbon footprint of fishing systems is generally very dominated by the fuel (i.e. energy) use in the fishery, hence there is not much difference between global warming emissions and energy use. If we talk about farmed fish, however, the complex system of agricultural production of feed inputs plays a central role with its biogenic emissions of methane (CH4) and dinitrous oxide (N2O), two very potent climate gases with a global warming potential of 25 kg CO2e/kg methane and 296 kg CO2e/kg dinitrous oxide. Therefore, there is a larger difference between global warming potential and energy use of agricultural products (including farmed seafood that are fed such products) than of seafood products from capture fisheries. 1.2 Background and organisation of the project The Norwegian Seafood Federation, FHL, in collaboration with The Norwegian Fishermen’s Association initiated this work by performing a pilot study early 2008 where the possible methodologies to undertake an analysis of the carbon footprint and energy use of Norwegian seafood products are described. This work, which also contains a screening life cycle assessment of
7
salmon farmed in Norway was carried out by SINTEF Fisheries and Aquaculture reporting the work in a project report (Olausson et al. 2008) and a scientific article (Ellingsen et al. 2008). The current project was formally started in early August 2008 when funding was granted by the Fishery and Aquaculture Industry Research Fund (FHF) and involves two project partners: SINTEF Fisheries and Aquaculture in Trondheim, Norway and SIK, The Swedish Institute for Food and Biotechnology in Gothenburg, Sweden. Representatives of FHL and The Norwegian Fishermen’s Association act as a steering committee. In addition, a reference group consisting of representatives from fishermen’s organisations, aqua feed producers, the salmon farming industry, seafood processing industry, NGOs and the steering committee has followed the project since it was started. An external reviewer has, in accordance with a requirement in the ISO standard for LCAs of public product comparisons, followed the project in an integrated way, i.e. he has provided valuable input on methodological choices and presentation of data and results from an early phase of the project. The final critical review is found as Appendix A. The supply chains included were chosen by the steering committee based mainly on volume of Norwegian export, but also in order to contrast chains that differ with regard to one or more respect and represent alternatives on the food and seafood market. A public meeting was held in Oslo in November 2008 where the project was presented to around 40 representatives from industry, governmental institutions and environmental groups. The participants provided comments that have been used to make various adjustments.
8
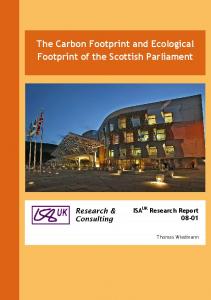
2 Goal and scope 2.1 Goal The main goal of the present study is to quantify carbon footprint and energy use related to the chosen Norwegian seafood products. A goal is also to, based on the results, identify improvement options in the studied chains. The seafood products are also to be compared with agricultural food products that compete with Norwegian seafood products on the European market such as beef, pork and chicken meat, primarily of European origin. The commissioners are undertaking this work to learn more about carbon footprinting and energy analysis and how to identify climate and energy hot spots and improvement options for the different products included. 2.2 Modelling approach and system boundary In this study, we take the attributional approach to Life Cycle Assessment, meaning that the aim is to find the average production in each case rather than the marginal production in case the production volume changes. We use ISO standardised LCA methodology (ISO 2006 a, b) to describe the climate impact and energy use of Norwegian seafood production today by analysing the most recent annual average data. Data collection started in 2008 and therefore in general we have used average data for 2007. For important inputs, attempts have been made to find the level of variance in relation to various variables such as time. The analysis of important uncertainties is found in section 6.4 in this report. Production of supply materials used in fishing and farming operations represent the starting point of the chains studied. The products are then followed from fishing/farming to processing. Postprocessing transport to the wholesaler represents the end point, see Fig. 2.1 for a generalised flow chart for the farmed and fished chains. Wholesaling, retailing and consumer phases were excluded, partly because of difficulties in obtaining data for the various locations included in the study and partly because there is less difference between preparation of a cod or a salmon fillet than in the early life cycle phases. The latter stages are discussed in section 6.2. Perhaps the most important aspect of the post-processing part of seafood chains, product waste, was included in the sensitivity analysis (see 3.5). Some of the chains are consumer-packed within the studied system (fillets), some beyond the system boundary (round and gutted fish). To avoid misleading comparisons, we chose to exclude production of the consumer packaging and only included transport packaging in all cases, i.e. the cardboard and polystyrene boxes used during transportation. Capital goods are generally left out in the foreground system1, except in the case of farmed mussels, where farming equipment will be included as a presumed “worst case”. We expected that farm construction material in this case (in the absence of feed inputs and presumed relatively modest fuel use) would give the highest contribution to the total result of all chains. Capital goods were included in the background system, i.e. data used from LCA databases that were not specifically collected for this project e.g. for production of energy carriers and packaging materials and especially for transports, where capital goods are relatively important. 1
By foreground system we mean the life cycle activities for which specific data was collected, the background system is the part of the system where we rely on life cycle database data, see Figure 1 for more description.
9
2.3 Seafood products studied (brief system descriptions) The products were chosen by the projects steering committee in discussion with the project group, taking into consideration input from the reference group and the initial public meeting. The choices are mainly based on major volumes of Norwegian seafood export. Seven production systems of which two farmed ones and five wild-caught ones were included. Cod, haddock, saithe, herring and mackerel are the capture fisheries included, salmon and blue mussels are the farmed ones. They end up in 22 seafood products, hence for some fisheries and farming systems more than one final product has been included. The full list is given in Table 2.1
FOREGROUND SYSTEM (FARMED): Production of feed and smolt (equipment)
Slaughter and processing
Grow-out phase
Transport to wholesaler
FOREGROUND SYSTEM (FISHED): Production of fuel and refrigerants
Fishing
Processing
Transport to wholesaler
BACKGROUND SYSTEM: Transport of feed inputs and other minor transports Production of refrigerants Production of energy carriers as fuels and electricity Production of transport packaging Figure 2.1 General flow chart showing system boundaries, foreground system and background system for seafood products from fisheries and aquaculture, respectively.
10
Table 2.1 Supply chains included in the study Origin
Species
Product
Delivered to
Transport mode
Fresh, gutted head-on
Aquaculture 1
Paris
Truck
2
Salmon
Oslo
Truck
3
Moscow
Truck
4
Tokyo
Air
5
Frozen, gutted headon
Shanghai
Container freighter
6
Fresh fillet
Paris
Truck
7
Frozen fillet
Paris
Truck
Living, fresh sorted
Paris
Truck
Fresh, gutted head-on
Paris
Truck
8
Blue mussels
Capture fisheries 9
Cod
10
Fresh fillet
11 12
Frozen fillet
13
Oslo
Truck
Paris
Truck
Paris
Truck
Paris
Truck/ Container freighter, processed in China
14
Saltfish
Lisbon
Truck
15
Clipfish
Lisbon
Truck
16
Saithe
Frozen fillet
Berlin
Truck
17
Haddock
Fresh, gutted head-on
London
Truck/RoRo vessel
Frozen, gutted headon
London
Truck/Bulk freight
Round frozen
Moscow
Bulk freight/ Train
Frozen deskinned fillet
Moscow
Truck
Tokyo
Container freighter
Moscow
Bulk boat/ Train
18 19
Herring
20 21 22
Mackerel
Frozen round
11
2.4 Functional unit The functional unit chosen in this study is one kilogram of edible product transported to the wholesaler at locations defined in Table 2.1. This means that in cases when the product is round or gutted head-on fish or blue mussels in shell, the quantity transported to the wholesaler was increased accordingly to correspond to a kilogram of edible product. 2.5 Comparison with competing products The meat products competing with Norwegian seafood products on the European market were identified as beef, pork and poultry meat produced in Europe. Results of a recently reported Swedish research project studying global warming emissions of various Swedish meat production systems (Cederberg et al. 2009) were used for this purpose, adjusting allocation methodology, system boundaries and the functional unit according to the choices made in the present study. Comparison was also done with a recent report on improvement potentials of European meat and dairy products (Weidema et al. 2008) in order to evaluate whether the choice of letting Swedish production represent European meat production was a conservative choice in the comparison with seafood products, i.e. if the carbon footprint of the meat products was likely to be over- or underestimated by this choice.
12
3 Methodology 3.1 Data inventory seafood chains The following data hierarchy was chosen: 1. Official statistics 2. Average data representing fishing/farming/processing sector from/via FHL and The Norwegian Fishermen’s Association 3. Literature data 4. Data from single companies 5. Unpublished data This hierarchy is related to the goal of presenting results that are valid for average Norwegian production of the products. In the end, data from all five categories was used. 3.2 Impact Assessment The study is limited to the two categories:
Greenhouse Gas (GHG) emissions, using a modified2 version of the IPCC 2007 indicators with a 100 year perspective, measured in kilos of CO2 equivalents (IPCC 2007) Cumulative Energy Demand (CED), i.e. primary energy use meaning not only the direct energy used in the production chain is included but also the energy that was used to produce various supply materials, measured in MJ equivalents.
3.3 Allocation strategy The problems of allocating the resource use of a process to several co-products arises mainly in three situations, namely in the
Processing of feed inputs used in fish farming Landing several fish species simultaneously Fish processing where several edible products are produced as well as by-products that are used for feed or other purposes
The assessment of allocation strategy has been extensive and is summarized in a document which is found as Appendix B. In short, system expansion was rejected due to resolution of the fuel data and difficulties in determining what sort of commodity actually was replaced by the by-product in question. Economic allocation was rejected due to the high variability in both fish and feed input prices in recent years. It was difficult to identify a way to do economic allocation that would be reasonably stable over time, moreover, we recognize that due to direct and indirect subsidies, first hand landing values do 2
The IPCC 2007 method was modified by setting the characterisation factor for uptake of carbon dioxide in air and emission of biogenic carbon dioxide to zero. These CO2 in- and outputs are due to carbon assimilation by plants and in our opinion these should not be accounted for since they, in the long term, do not represent a net contribution to CO2 in the atmosphere.
13
not reflect the true value and cost of fish, despite the fact that the value of the landings rather than its mass often is the driver of the fishing activity. Allocating based on gross energy content was rejected due to the counter-intuitive effect that appears for all whitefish species, that the by-products from processing are higher in energy content and consequently should carry more environmental burden than the main, edible, products. More advanced approaches that were discussed (see Appendix B) were dismissed due to lack of time and the risk of using a new previously untested methodology. The conclusion is that we have used mass allocation, i.e. partitioned the environmental load between co-product streams based on their mass. Advantages of this approach include that mass reflects one important function of food, which it, according to the ISO standard should, that it encourages the food industry to make use of by-products (since it places high environmental burden on them). The main advantage, though is stability over time making it possible to follow up in a couple of years ensuring that differences detected will depend on actual changes in resource use and not changes in the distribution of the production value between co-products. It should be kept in mind throughout the reading of this report that this choice means that equal environmental load is put on all fish landed together, on fillets, mince and non-edible parts that are used in one way or another, in processing and on meals, oils and other outputs from feed processing. While this approach “encourages” seafood producers to increase the use of by-products, it also “encourages” the users of by-products from intensive production systems, such as demersal fishing or rearing of cattle, to switch to less intensive production systems that could be directed feed production, e.g. reduction fisheries. As this choice influences the results considerably, the sensitivity analysis comprises performing economic allocation for one farmed and one wild-caught product, frozen salmon and cod fillet delivered to Paris, respectively. The only instance where another type of allocation has been done is in the beef system, between the co-products milk and meat, where a biological factor was used to calculate the proportion of nutrients used to produce the milk and the meat, respectively (resulting in a partition of 15 % to the meat and 85 % to the milk). For consistency, it is normally desirable to stick to one allocation method used in all instances where allocation is necessary, i.e. it is not an option to choose mass allocation in the fishing phase and economic allocation or system expansion in the processing phase. The choice of allocation method certainly represents one of the most controversial methodological choices in the performance of an LCA. 3.4 Strategy to handle things that were left out The part of the product chains from wholesaler to consumer are described in section 6.2. Differences between frozen and fresh fish in this respect are described. Storage and product waste in retail and in the household are important activities that are highlighted as is preparation in the household. The most important transport has often been shown to be the transport between retail and household, which is likewise discussed in this section. Capital goods were generally left out in the foreground system of the project in order to limit the data inventory, since it has been documented both for fishing systems and aquaculture that these inputs are minor compared to the direct fuel and material inputs (e.g. Tyedmers et al. 2007). The role of capital goods was evaluated in the case of mussel farming by including the farming equipment, as a kind of “worst case”.
14
3.5 Sensitivity analysis The following aspects were chosen to be evaluated in the sensitivity analysis: 1. Replace Nordic electricity mix by Norwegian average grid 2. Product waste a) Product waste at processing plant 2 % (as opposed to no product waste) b) Product waste at processing plant 2 % and product waste at wholesaler 5 % (as opposed to no product waste neither at processing plant nor wholesaler) 3. Increase in edible yield when processing cod in Norway (from 62 % yield to 70 %) 4. Economic allocation (as opposed to mass allocation) in the case of a) Frozen cod fillets transported to Paris b) Frozen salmon fillets transported to Paris 5. Use of by-products from processing a) By-products of salmon and cod are used abroad to the same extent as in Norway b) By-products of salmon and cod are fully used both in Norway and abroad c) By-products of salmon and cod are not used at all 6. Feed Conversion Ratio in salmon farming and smolt production 1.0 (instead of 1.2) 7. Lower proportion of marine inputs in salmon feed (30 % instead of 60 %) 8. Only Anchoveta as marine input in salmon feed (as opposed to 28 % of marine inputs imported from South and North America) 9. Optimised mussel production (higher edible yield, less fuel used, use of by-products) 10. Replace all on-board refrigerants with carbon neutral ones
15
4 Inventory results 4.1 Brief supply chain descriptions The intention of this section is to provide a brief description of each supply chain and to present the mass flows used in the analysis to arrive at one kilo of edible product at the wholesaler. The mass flows were obtained by a combination of official Norwegian conversion factors from fish to various product forms and through data from companies along the supply chain for whitefish, mussels and salmon. The chains are numbered as in Table 2.1. Chain 1: Fresh gutted salmon to Paris Farmed salmon, slaughtered close to the farming site after transport by well-boat3 and packed in EPS boxes on ice. Storage for five days before truck transport to Oslo. An average distance from the salmon slaughter plant to Oslo (842 km + 100 km positioning transport) was found by weighting distances according to each county’s salmon production relative to total Norwegian production. From Oslo the salmon was transported on refrigerated trucks to Göteborg (300 km), via car ferry between Göteborg -Frederikshavn (95 km) and then Frederikshavn to Paris (1400 km). 1.74 kg of live-weight salmon
1.43 kg slaughtered salmon
Transport of 1.43 kg on truck
1 kg of edible salmon in Paris
Transport of 1.43 kg on truck
1 kg of edible salmon in Oslo
Chain 2: Fresh gutted salmon to Oslo Identical to chain 1, except that it stops in Oslo. 1.74 kg of live-weight salmon
1.43 kg slaughtered salmon
Chain 3: Fresh gutted salmon to Moscow Identical to chain 1 but truck transport from Oslo to Stockholm (530 km), car ferry StockholmTurkku (284 km) and truck from Turkku-Moscow (1281 km). 1.74 kg of live-weight salmon
3
1.43 kg slaughtered salmon
Transport of 1.43 kg on truck
1 kg of edible salmon in Moscow
No distance was specified, but the fuel used by well-boats was included in the fuel used on the salmon farm.
16
Chain 4: Fresh gutted salmon to Tokyo Chain identical to Chain 2, but then air freighted from Oslo to Tokyo (8380 km). 1.74 kg of live-weight salmon
1.43 kg slaughtered salmon
Transport of 1.43 kg by air
1 kg of edible salmon in Tokyo
Chain 5: Frozen gutted salmon to Shanghai Chain identical to Chain 1 up to slaughter. The salmon is then frozen in a processing plant in Norway, packed in cardboard boxes, stored for three months and then taken to Rotterdam (1350 km) and from Rotterdam to Shanghai (19500 km) by refrigerated container transport. 1.74 kg of live-weight salmon
1.43 kg slaughtered salmon
Freezing of 1.43 kg
Transport of 1.43 kg containerized shipping
1 kg of edible salmon in Shanghai
Chain 6: Fresh salmon fillets to Paris Chain identical to Chain 1 up to slaughter. The salmon is then processed to fillets and packed in EPS boxes before export by truck. Transport similar to salmon transport in Chain 1, except that fillets are transported rather than whole fish. By-products from slaughter and processing are used for feed. 1.74 kg of live-weight salmon
1.43 kg slaughtered salmon
1 kg of fillets (TRIM D skinless)
Transport of 1 kg by truck
1 kg of edible salmon in Paris
Chain 7: Frozen salmon fillets to Paris Chain identical to Chain 1 up to slaughter. The salmon is then processed to fillets, frozen and packed in EPS boxes before export by truck after three months of storage. Transport similar to salmon transport in Chain 1, except that frozen fillets are transported instead of cooled gutted fish. This means similar use of energy and refrigerant, but no ice is needed , hence more fish can be loaded per pallet and truck. By-products from slaughter and processing are used for feed. 1.74 kg of live-weight salmon
1.43 kg slaughtered salmon
1 kg of frozen fillets
Transport of 1 kg by truck
1 kg of edible salmon in Paris
17
Chain 8: Blue mussels, fresh, sorted, to Paris Blue mussels farmed in Norway and trucked to a processing plant on average 200 km away where mussels are washed, sorted and packed in nets. Transportation after five days of storage in EPSboxes on ice to Paris on refrigerated trucks via the same route as salmon in Chain 1. By-products in processing in Norway are currently not used, nor are shells in Paris. 7.3 kg of live, unsorted mussels
4.2 kg of washed, sorted mussels
Transport of 4.2 kg by truck
1 kg of edible mussel in Paris
Chain 9: Fresh gutted cod to Paris Cod caught in Norwegian fisheries by various different fishing gear (29 % bottom trawl, 17 % Danish seine, 31 % gillnets, 9 % auto-lines and 13 % other coastal fishing methods), gutted onboard with no use of by-products. Packed in EPS-boxes on ice and after five days of storage transported to Oslo from weighted average whitefish landing location, based on landings per county (1200 km + 100 km positioning transport). From Oslo to Paris cod transports are like salmon transports with regard to route and load (Chain 1). 2.44 kg of round cod (gives 2.07 kg of landed cod)
Transport of 2.07 kg by truck
1 kg of edible cod in Paris
Chain 10: Fresh cod fillets to Oslo Cod caught in Norwegian fisheries as in Chain 9, and then processed in Norway with 39 % of byproducts used for feed. Packed in EPS-boxes on ice and transported to Oslo from weighted average cod landing spot (1200 km + 100 km positioning transport).
2.44 kg of round cod (gives 2.07 kg of landed cod)
1 kg of cod fillets
Transport of 1 kg by truck
1 kg of edible cod in Oslo
Chain 11: Fresh cod fillets to Paris Similar to Chain 9 except that product is fillets rather than whole cod, so by-products are used as in Chain 10. 2.44 kg of round cod (gives 2.07 kg of landed cod)
1 kg of cod fillets
Transport of 1 kg by truck
1 kg of edible cod in Paris
18
Chain 12: Frozen cod fillets to Paris, processed in Norway As Chain 11, but fillets are frozen before export and the transport is hence done in cardboard boxes and without ice after three months of storage. By-product use as in Chain 10. 2.44 kg of round cod (gives 2.07 kg of landed cod)
1 kg of frozen cod fillets
Transport of 1 kg by truck
1 kg of edible cod in Paris
Chain 13: Frozen cod fillets to Paris, processed in China The cod is landed headed and gutted (HG) frozen at sea, meaning that neither head nor guts are used, but discarded at sea. The frozen HG cod is after three months of storage transported in refrigerated containers from Narvik to Rotterdam (2090 km) and from there on a return trip to Qingdao, China (19900 km). Processing in China (i.e. thawing and re-freezing) is done using Chinese average electricity production and filleting is done manually with an edible yield of 70 %. The higher edible yield explains the lower amount of fish required in this chain. By-products from processing are used as chicken feed. The re-frozen product is after processing being shipped back to Europe and then trucked from Rotterdam to Paris (404 km). 2.13 kg of round cod (gives 1.43 kg of HG cod)
Transport of 1.43 kg HG cod to China on containers
1 kg of fillets processed in China
Transport of 1 kg fillets to Paris containerized shipping and truck
1 kg of edible cod in Paris
Chain 14: Cod saltfish to Lisbon Cod from the same “average Norwegian cod fishery” is half landed fresh only gutted at sea and half landed frozen, headed and gutted at sea. The fresh fish is stored for five days as in the other chains, frozen fish for three months before being processed. The cod is then taken into the salting process in which it is first deboned and split (if fresh first of all headed) and then salted during several (2-3) weeks of cold storage. By-product use for whitefish as before. While 1.5 kg of salt is used per kg of saltfish produced, the salted fish contains around 20 % salt, and the remaining salt is wasted. Transport from northern Norway (average landing location) to Lisbon via carferry GöteborgFrederikshavn is done in cardboard boxes by truck, a distance of 1300 km (to Oslo) and 3129 km (Oslo-Lisbon). The product is desalted in water again prior to consumption, a process in which part of the salt is again replaced with water. We chose this edible form of the product as the end of our supply chain to ensure comparability with other, edible, products. The different amount of cod required is due to yield and the fact that a part of the product is salt rather than fish.
19
1.55 kg round cod (gives 1.33 kg landed cod)
0.64 kg saltfish per kilo deboned “flekket”
Storage of 50% frozen HG/ 50% fresh G cod 0.96 kg salt
Transport of 0.64 kg saltfish by truck
1 kg of edible cod in Lisbon
0.83 kg salt (waste)
Chain 15: Cod clipfish to Lisbon Clipfish is dried saltfish. It is dried using electricity and various drying techniques to a water content of 40-45 %. The yield from saltfish to clipfish is 70 %. Transport from northern Norway is the same as for saltfish, but the amount transported is smaller due to lower water content. In analogy with the saltfish chain, since the product is hydrated/desalted prior to consumption, we chose the directly edible form of the product as the end of this supply chain to ensure comparability. 0.64 kg saltfish
Drying of 0.64 kg saltfish
Transport of 0.45 kg by truck
1 kg of edible cod in Lisbon
Chain 16: Frozen saithe fillets to Berlin Saithe caught in Norwegian fisheries by various different fishing gears (52 % bottom trawl, 5 % Danish seine, 17 % gillnets, 1 % auto-lines, 19 % by purse seines, 1 % by pelagic trawls and 5 % by other coastal fishing methods), gutted on-board with no use of by-products. The saithe is then processed in Norway with use of by-products as for other whitefish species (39 %), packed in cardboard boxes and transported to Berlin (1200+100 km to Oslo and 835 km Oslo-Berlin) after three months of storage. The average point of landing of cod was used for saithe (and haddock) aswell since they to a large degree are landed in the same fisheries. 2.08 kg round saithe (gives 1.74 kg landed saithe)
1 kg of frozen saithe fillets
Transport of 1 kg by truck
1 kg of edible saithe in Berlin
Chain 17: Fresh gutted haddock to London Haddock caught in Norwegian fisheries by various different fishing gears (41 % bottom trawl, 15 % Danish seine, 5 % gillnets, 22 % auto-lines and 16 % other types of long-lines), gutted on-board with no use of by-products. The haddock is not processed, just packed in EPS boxes and trucked to Stavanger (600+100 km) after five days of storage. From there transport on a RoRo vessel to Newcastle (633 km) and truck Newcastle-London (444 km). 2.49 kg round haddock (gives 2.18 kg of landed haddock)
Transport of 2.18 kg by truck
1 kg of edible cod in London
20
Chain 18: Frozen gutted haddock to London Fishing as Chain 17, freezing either at sea or in processing plant, packaging in cardboard boxes, then after three months of storage bulk freight on ship from northern Norway to Newcastle (2126 km) with 75 % empty return and then trucked from Newcastle-London (444 km). 2.49 kg round haddock 2.18 kg land haddock
Freezing of 2.18 kg
Transport of 2.18 kg by truck
Transport of 2.18 kg by boat
1 kg of edible salmon in London
Chain 19: Round frozen herring to Moscow Herring caught by the Norwegian pelagic fleet (12 % pelagic trawls and 88 % by purse seines), landed and frozen round in Norway. An average point of landing for pelagic species was identified as the starting point for transportation based on the landings statistics at the Norwegian Directorate of Fisheries from which the herring after storage is transported frozen to St. Petersburg (2395 km) by a bulk freight ship in cardboard boxes, 2/3 of the return is assumed to be empty. From St. Petersburg to Moscow it is transported by refrigerated rail freight (814 km). 1.63 kg of landed (round) herring
Freezing of 1.63 kg
Transport of 1.63 kg by bulk boat and rail
1 kg of edible herring in Moscow
Chain 20: Frozen deskinned herring fillets to Moscow Identical chain to Chain 19 with regard to fishing. After fishing, the herring is filleted and frozen, stored and then exported in cardboard boxes by truck. By-product use is 95 % for pelagic species. Distance from northern Norway to Stockholm 1420 km, car ferry Stockholm-Turkku (284 km) and Turkku-Moscow 1281 km. 1.63 kg of landed (round) herring
Filleting and freezing of 1 kg of fillets
Transport of 1 kg by truck
1 kg of edible herring in Moscow
Chain 21: Round frozen mackerel to Tokyo Mackerel caught by the Norwegian pelagic fleet (3 % pelagic trawls, 88 % purse seines and 9 % trolling line), landed and frozen round in Norway. The product is transported by containerized shipping frozen from Narvik to Rotterdam (2090 km) and on to the port of Yokohama (just outside Tokyo) (20700 km) in cardboard boxes after storage in Norway for three months. 1.63 kg of landed (round) mackerel
Freezing of 1.63 kg
Transport of 1.63 kg by containerized shipping
1 kg of edible mackerel in Tokyo
21
Chain 22: Round frozen mackerel to Moscow Identical to Chain 21 with regard to fishing and freezing. The mackerel is transported frozen to St. Petersburg by a bulk freight ship in cardboard boxes. The distance is 2395 km and 2/3 of the return is assumed to be empty. From St. Petersburg to Moscow it is transported by refrigerated rail freight (814 km). 1.63 kg of landed (round) mackerel
Freezing of 1.63 kg
Transport of 1.63 kg by bulk and rail
1 kg of edible mackerel in Moscow
4.2 Capture fisheries 4.2.1 Fuel use in fishing The fishing sector is a highly regulated and politicized sector (Hersoug 2005). The energy efficiency in fisheries is, among many factors, determined by the framework set by fisheries management systems (Standal 2005 and Driscoll and Tyedmers 2009) with components such as:
Total available quotas and quota allocation policy Structural policies to cut down unprofitable overcapacity Technical regulations and spatial and temporal limitations of fisheries, these also includes demands on when and where landings can be delivered Auctioning systems for pelagic species that influence economically feasible travelling distances and subsidizing of travelling expenses Geographical aspects of where and when specific fisheries are open Regulations connected to gear adaptations and rules for minimum size to avoid catches of juvenile fish
These are examples of regulations that have an important influence on the energy efficiency of fisheries. Fuel use in fisheries is therefore a complex function with many variables; the type of fishing gear used and the behaviour of individual fishermen is only a part of the equation. The species specific fuel consumption (e.g. litre diesel combusted to land one kilo of round cod) was calculated by combining data from the annual profitability survey on the Norwegian fishing fleet4 and sales statistics5 from the Norwegian fishermen’s sales organizations6. Both data sets come from the Norwegian Directorate of Fisheries (Fiskeridirektoratet 2008a and 2008b). The profitability survey provided data on the fuel consumption in different fisheries and the sales statistics how the different species was caught (by which fisheries). The calculations will be further explained below. Gear specific fuel factors and the profitability survey The profitability survey is a questionnaire, sent out to a selection of licensed fishermen in Norway on an annual basis. The data e.g. comprise annual catches by different types of fishing gear, annual 4
Lønnsomhetsundersøkelsen Sluttseddel 6 Salgslagene 5
22
fuel use, vessel size and fishing area. In 2007, 741 out of Norway’s 1709 vessels over 8 m operating all year received the survey, 634 replied and of these 624 replies were found to be valid for further data processing. The number and types of vessels included were chosen by statistical methods to ensure a representative sample. Table 4.1 presents the sample selection and the reply ratio for different segments of the Norwegian fleet in 2007 (ratio between vessels that were asked and those who replied well enough). The reply rate in the profitability survey, in terms of number of vessels that are asked relative to the total number, is highly variable between different fleet segments; in general it is lower for smaller vessels (20-30 %) and higher for larger vessels (60-70 %). In terms of landed tonnage, the data is more representative, since the larger vessels land the bulk of the fish, see Table 4.2. Cod is the species for which the data is least representative (45 %) and where the largest proportion is landed by small, coastal vessels (20 % by vessels under 8 m and 28 % by vessels between 8-15 m long). Some adjustments to the raw data were made:
Some vessels have used different types of fuels. Around 15 % of the fuel use reported by the survey was Marine Special Distillate (MSD) for which the refining process is more intensive. Therefore energy use and greenhouse gas emissions are slightly higher for this fuel (2.8 vs. 2.6 kg CO2e/l fuel for MSD and marine diesel oil; personal communication Statoil). For each vessel in the profitability survey the use of MSD was included by calculating that consumption into marine diesel equivalents using the ration 2.8/2.6. In some occasions (around 0.5% of the data) product weight was larger than round weight, in these cases round weight was set to the higher of the two values. Boats that reported zero fuel consumption or zero catch were excluded, thus the number of boats used in the calculation was lower than 624, 458 boats.
These latter adjustments demonstrate the uncertainty that lies in data based on a questionnaire where the replier can misunderstand the question or give inadequate/wrong information. Other emissions from fuel combustion that contribute to climate impact included were dinitrogen monoxide (N2O), carbon monoxide (CO) and methane (CH4). Sulphur and nitrogen oxides do not contribute to climate impact, although to other impact categories such as acidification and eutrophication, and were therefore not included.
23
Table 4.1 Sample selection and reply rate for different capture fisheries in the 2007 profitability survey
Coastal fisheries Ocean fisheries
Received survey
Replies used
Reply rate**
Demersal with conventional gears*
502
406
0.81
Pelagic with purse seine
75
70
0.93
Trawlers
46
42
0.91
Autoliners
26
24
0.92
Pelagic with purse seine
69
61
0.88
Pelagic trawl
23
21
0.91
Total
741
624
* gillnets, coastal line, jig and other ** ratio between number of surveys that were used and sent out
Table 4.2 Proportion of total landings in 2007 covered by the profitability survey Species
Proportion (%)
Herring
71
Mackerel
69
Cod
45
Saithe
66
Haddock
59
Calculation of gear specific fuel factors Equation 4.1 presents how the gear specific fuel factors (FSj) where calculated. The total fuel used by each boat (Di) was allocated to the different fishing gears it used (FDij). The allocation was based on the ratio between the boats landing with each gear type (fij) and the sum of all its landings (Fi). Finally the gear specific fuel factor was calculated by dividing the sum fuel allocated to each equipment by the landings of the same equipment. All weights are in round weight.
Equation 4.1 Calculation of gear specific fuel factors from profitability survey n
n
FS j
FD
ij
i
n
f i
ij
i
fij Di Fi
n
f i
ij
24
Explanation of terms in Equation 4.1:
FSj: Fuel factor for equipment j [l/kg] FDij: Fuel allocated to equipment j on boat i [l] fij: Landings by equipment j on boat i [kg] Di: Total fuel consumed by boat i [l] Fi: Sum of all landings by boat i [kg] n: number of boats in profitability survey after data corrections
The results of the calculations are presented in Table 4.3. The coefficients of variation in Table 4.3 show that the variations in the values behind the calculation of the average values are high. It is important to be aware that the profitability survey provides each vessel’s annual fuel consumption (Di) and not the fuel consumed by each landing. This fuel consumption also includes steaming to and from the fishing fields and energy to cooling and processing systems on board. For an example for trawlers the fuel used for actual trawling only can account for 54 % of the trawlers total fuel consumption and for pelagic ocean vessels steaming can account for a higher proportion of the fuel use than the actual fishing (Dale 2007 and 2009). The fact that the fuel consumption data (Di ) is the vessel’s total fuel consumption also means that for trawlers and auto liners, energy for processing and freezing is included, that is: In the gear specific fuel factor for trawlers and auto liners lies also filleting, packing and freezing, while for many of the other gears the fish is delivered fresh and gutted and needs processing and freezing on shore. For vessels that use different types of gears the approach of mass allocating the vessel’s total fuel consumption means that it is assumed that these vessels have the same fuel efficiency for all their gears. This is of course not correct as it is evident that the vessel’s fuel consumption will depend on what gear it uses, but this approach was used as there exist no extensive data set with fuel consumption for each gear on vessels that use several types. This is by all means an important assumption that influences the calculated fuel factors and may be an important reason that gears that are typically used in combination end up with almost identical fuel factors, like e.g. Gilnet, long lines, trolling line and hand line in Table 4.3. At the same time it can be quite correct that these gears have very similar fuel factors as it is fair to assume that steaming to and from the fishing spots is more important for the fuel consumption than the actual fishing phase of these passive gears. The coefficients of variation in Table 4.3 show that the variation in the values behind the calculation of the average values are high and highest for the typical coastal gears, gears that are typically used in combination. The significance of the standard deviation can be understood by studying the fuel factor for trawling that has an average value of 0.43 l/kg and a standard deviation of 0.24 l/kg. Assuming a normal distribution of the values this means that 95% of the vessels may have used from 0.19 to 0.67 l/kg, this further illustrates the high variation behind these calculations and show that, it can not, based on these results, be said that e.g. long-lining in general is more energy efficient than bottom trawling or fishing with gillnets is more efficient than long-lining. There is, though, a tendency that
25
pelagic fishing methods, especially purse seining and pelagic trawling, are most efficient, coastal fishing methods somewhat less energy efficient and automated long-lining and bottom trawling are found to be the most fuel intensive fisheries. But this is given the current (or 2007) circumstances with regard to regulations and stock status and hence reflects much more than the energy efficiency of the gear type. Hence, the gear type used is only one of many parameters that determine the vessel’s energy efficiency, the large variation between vessels found within the same vessel groups, using the same type of gear and operating under the same regulations, demonstrates a considerable improvement potential based on the way a fishing vessel is technologically equipped and operated. Table 4.3 Gear specific fuel factors Fuel use [l / kg]*
Standard deviation
Coefficient of variation**
Other long lines (Andre liner)
0.15
0.069
0.5
Long-line (Autoline)
0.31
0.12
0.4
Fishing gear
Bottom trawl (Bunntrål)
0.43
0.24
0.6
Trolling line (Dorg/harp/snik)
0.14
0.14
1.0
Pelagic line (Flyteline)
0.10
0.051
0.5
Pelagic trawl (Flytetrål)
0.098
0.12
1.2
Pelagic pair trawl (Flytetrål par)
0.093
0.022
0.2
Hand line/ jig (Juksa/pilk)
0.15
0.19
1.3
Gillnet (Settegarn)
0.15
0.18
1.2
Purse seine (Snurpenot/ringnot)
0.089
0.03
0.3
Danish seine (Snurrevad/Rundfisktrål/Flyndretrål)
0.12
0.20
1.7
Undefined gillnet (Udefinert garn)
0.25
0.26
1.0
Undefined seine (Udefinert not)
0.083
0.16
1.9
*liters fuel per kilo landed catch in round weight ** coefficient of variation= standard deviation / average value
Species specific fuel factors The gear specific fuel factors from Table 4.3 were combined with sales statistics showing how (with what gear types) each species was caught. These statistics cover the complete Norwegian fisheries in 2007 and are presented in Table 4.4. This table also presents how the same distribution would look like if it was based on the profitability survey. It is evident that the smaller boats using coastal gear are underrepresented in the profitability data, at least for demersal species. The true proportion of catches landed by coastal fishing methods is around twice as high for cod and haddock compared to the profitability survey. This was the reason for combining the two data sets rather than using the profitability survey only.
26
Table 4.4 Distribution of landings on different gear types according to sales statistics (left) and profitability survey (right) in 2007 Species
Distribution sales statistics [%]
Distribution profitability survey [%]
PS
PT
BT
DS
AL
CG
PS
PT
BT
DS
AL
CG
Cod
0
3
29
17
9
42
20
1
58
3
1
17
Haddock
0
0
41
15
22
22
92
2
0
0
0
6
Saithe
16
1
52
5
1
25
88
10
0
0
0
2
Herring
88
12
0
0
0
0
0
0
50
17
13
20
Mackerel
88
3
0
0
0
9
0
0
53
12
24
11
PS=Purse seine, PT=Pelagic trawl, BT=Bottom trawl, DS=Danish seine, AL=Auto-line, CG= Other coastal gears (gillnets, coastal line, jig and other)
Table 4.5 Species specific fuel factors Fuel factors [litre fuel / kg landed round weight] Cod
Standard deviation
0.24
0.096
Haddock
0.29
0.11
Saithe
0.29
0.13
Herring
0.091
0.029
Mackerel
0.094
0.031
For verification of the calculated gear specific data, data was collected from individual vessels, some of Norway’s biggest fishing vessel ship owners and scientific reports and articles (e.g. Eyjólfsdóttir et al. 2003, Tyedmers 2001, Tyedmers 2004). Some of these results are represented in Table 4.6. According to these data, the gear specific fuel use calculated in this study corresponds very well for long-line and purse seining, but was lower for trawlers, although the range in fuel use for trawlers is very high both in our data and in literature. This could of course be due to a bias in the profitability data with trawlers that are over average fuel efficient responding to the survey. This finding could also reflect improvements that have happened in recent years due to structural changes in the fishing fleet, e.g. a decrease of over-capacity in the fleet, see discussion of results in the chapters following. Table 4.6 Miscellaneous gear specific fuel factors used for verification Fishing equipment
Fuel use, average value [litre fuel / kg round weight]
Data range [litre fuel / kg round weight]
Bottom trawlers
0.63
0.33 – 1.0
Purse seiners
0.077
0.036 – 0.11
Long liners
0.31
0.18 – 0.49
27
4.2.2 Refrigerants Refrigerants used in the Norwegian fishing fleet include R22, ammonia and CO2. The most important one, in terms of global warming potential, is R22 (HCFC-22) with a climate impact indicator of 1810 kg CO2e/kg (IPCC 2007). R22 also has high ozone depletion potential. Emission rates of R22 were calculated based on information that was obtained from producers of cooling systems, service technicians and refrigerant wholesalers/importers. Since 2002 installation of new R22 systems has been banned and import of R22 is only allowed for refilling of existing systems. There has been a maximum limit to the import and production of R22 and from 2010 this will be zero, that is; from 2010 refilling of R22 is only possible with regenerated R22 from systems that are no longer in use (Produktforskriften 2009). R22 is mainly regulated due to its high ozone depletion potential and rgulated by the Montreal protocol (UN 2006) A complete data set on how R22 imported to Norway is distributed and used does not exist. In 2007 the total import of R22 was 323 tonnes (SFH pers. comm). It was imported by five different companies and after contact with these companies it was concluded that a reasonable estimate is that around 200 of these tonnes were used on fishing vessels. The estimate is based on assumptions from experienced salesmen in this sector and there seemed to be a strong consensus that fishing vessels are the main consumer of R22 in Norway. Further it was assumed that these 200 tonnes equal the total emissions of R22 in 2007. This assumption is based on the fact that new R22 systems are no longer permitted and only refilling is allowed. It was also investigated if some R22 was collected from fishing vessels and delivered for secure destruction, but this amount was confirmed to be insignificant by Stiftelsen Returgass that are responsible for collection and destruction of e.g. refrigerants in Norway (Returgass pers.comm). It is also possible that some of these 200 tonnes is stock piled, but from the fact that refilling with virgin R22 will not be allowed from 2010 stock piling of R22 will neither be allowed (Produktforskriften 2009). Refrigerant use on pelagic vessels Pelagic vessels mainly use refrigerants in their RSW (Refrigerated Sea Water) systems. In a perfect RSW system refrigerants are not emitted, but in practice emissions occur by leaks and during repairs and services. An annual emission rate of 30 % was assumed. In the literature refrigerant emission rates on fishing vessels are estimated at 20 – 40 % (Sandbakk 1991, Senter NOVEM 2006, Klingenberg 2005). Further it was assumed that 70 % of the pelagic vessels still use R22 and that pelagic vessels above 28 m have 1200 kg R22 per RSW system, and that vessels under 28 m have 600 kg R22. These assumptions combined with landings statistics for the pelagic fleet from the profitability survey led to an emission rate of 0.023 g R22 per kilo landed fish in round weight. Refrigerant use on demersal vessels Emission of R22 from the demersal fleet was calculated by subtracting the amount of R22 emitted by the pelagic fleet from the total mass of R22 emitted by Norwegian fisheries (around 200 tonnes). The remaining amount was divided by the total Norwegian landings in 2007 minus pelagic species (722.148 tonnes). This calculation resulted in an emission rate of 0.224 g R22 per kilo round weight in the demersal fleet.
28
Brief discussion of refrigerant emission rates Due to its high global warming potential, R22 emissions play an important role in the over all climate impact of seafood production systems using this refrigerant. The data and research in this field are very limited. The most important assumption is that the total emission of R22 from Norwegian fishing vessels is as much as 200 tonnes. The second most important assumption is how this was shared between the pelagic and demersal fleet. It is fair to assume that the emission rate from the pelagic fleet is less than from other vessels: RSW systems have less leaks than freezing and cooling systems used in the demersal fleet, the pelagic fleet is more modern and pelagic vessels have larger catches per vessel compared to the remaining fleet. Thrane (2004b) found a lower general emission rate for refrigerants, 0.03 g/kg fish landed, which is more in line with our estimate for pelagic fish. However, our sources have given us strong reason to conclude that the annual emission of R22 in 2007 is 200 tonnes, the figure 100-125 tonnes R22 used in all Nordic fisheries referred to by Thrane, originally found in a report from the Nordic Council of Ministers (NMR 2000), is therefore seems to an underestimation. 4.3 Aquaculture 4.3.1 Salmon feed production The composition of a salmon feed representative of the grow-out phase of Norwegian salmon was constructed by using the average composition of marine feed inputs in Norwegian feed production (of which 97 %) is used in salmon farming in Norway, see Table 4.7 (FHL 2009). Due to the expected importance of the feed composition we modelled 2007 and 2008, since it is evident that the variation in composition between years is considerable. The same report also provided the economic feed conversion ratio used which was 1.2 kg dry feed/kg live weight salmon slaughtered.
29
Table 4.7 Composition of marine part of Norwegian produced fish feed in 2007 and 2008 based on data from the three main producers of aqua feeds in Norway. Species
Proportion of fish meal used in 2007 (%)
Proportion of fish oil used in 2007 (%)
Proportion of fish meal used in 2008 (%)
Proportion of fish oil used in 2008 (%)
Anchovy1
23
21
23
22
Blue whiting
37
14
27
8
Capelin
4
2
1
1
Herring
16
26
17
23
Herring cuttings
3
4
4
12
Sand eel
2
7
14
7
Sprat
5
14
4
9
Mackerel
1