Dynamic Relations between Energy Carbon Footprint and. Economic Growth in Ethnic Minority Autonomous Regions,. China. HUA Honglian, PAN Yujun, YANG ...
Available online at www.sciencedirect.com
Energy Procedia 17 (2012) 273 – 278
2012 International Conference on Future Electrical Power and Energy Systems
Dynamic Relations between Energy Carbon Footprint and Economic Growth in Ethnic Minority Autonomous Regions, China HUA Honglian, PAN Yujun, YANG Xiaoyan, WANG Shuang, SHI Yu Department of Geography Science & Tourism Yunnan Normal University Kunming, China
Abstract In order to measure the relationship between economic activities and energy consumption for low-carbon economy strategy in ethnic minority autonomous regions, this paper used the Carbon Footprint Model and based the VAR model, used the Impulse Response Function method to describe the dynamic relations between economic growth and the energy Carbon Footprint in these regions. The result indicated that there is a strong interactive response between economic growth and Energy Carbon Footprint. The increases of Carbon Footprint can also cause the increase of GDP, this means the economic growth will be growth more rapidly depends on the massive energy consumption in the short-term, but when the economic growth to the certain extent, energy's excessive consumption can’t bring higher growth of economic, even give the negative influence to the economic growth, therefore, transforming economic growth pattern, modifying industrial structure and improving energy efficiency are useful ways for lowcarbon economy.
2011 Published by Elsevier Ltd. Selection and/or peer-review under responsibility of [name organizer] ©©2012 Published by Elsevier Ltd. Selection and/or peer-review under responsibility of Hainan University. Keywords:Ethnic Minority Autonomous Region; Carbon Footprint; economic growth; Impulse Response Function
1.
Introduction
The Carbon Footprint was developed based on the concept of Ecology Footprint, and it is a measure method for CO2 emission that caused by some kind of activity directly or indirectly [1]. As an important indicator for measure the impact between human activities and environment influencers, the Carbon Footprint became the new hot domain of ecology in recent years. The ethnic minorities autonomous regions rich in energy resources, and they are the energy support and resources strategic base for the national modernization development, in recent years, the energy
1876-6102 © 2012 Published by Elsevier Ltd. Selection and/or peer-review under responsibility of Hainan University. doi:10.1016/j.egypro.2012.02.094
274
HUA Honglian et al. / Energy Procedia 17 (2012) 273 – 278
development and investment has become the important factor to improve economic growth in autonomous regions, so, at the same time, the carbon dioxide emission also increase rapidly with economic growth. Therefore, research the dynamic relations between Carbon Footprint produced by energy consumption and the economic growth is very useful for low-carbon economic as well as coordinates the relationship between the regional energy, environment and economy. 2.
Research Methods
Model of Carbon Footprint Carbon Footprint is refers to the needed production land (vegetation) area which can absorb carbon emissions, that is the Ecology Footprint of carbon emission [2-5]. Therefore, in order to calculate the Carbon Footprint, the first thing is to calculate the carbon emission produced by energy consumption and the green vegetation's carbon absorption rate. NEP (Net Ecosystem Production) can reflect the ability of vegetation absorb the carbon, namely the carbon absorbed by vegetation 1hm2 in 1 year [6]. The forest is the main land ecosystem carbon collectors, therefore this paper only uses the forest NEP to calculate the Carbon Footprint produced by energy consumption, the related data of the NEP come from the computed results by Xie Hongyu[6]. Formula following [6]:
Ace
Cce u H ce u Cd ce u Perf
������������������������������ �
EPf
Ace is the Carbon Footprint produced by energy consumption (hm2)˗ Cce is energy H Cd ce is carbon consumption (t)˗ ce is the energy combustion calorific value coefficient (TJ/103t)˗ perf In this formula,
emission coefficient of energy (TC/TJ)˗ 82.72%[6]ˈ
EPf
is the rate of absorption of carbon of forest, that is
is average carbon absorption ability of forest (t/hm2).
Impulse Response Function Model Before using the Impulse Response Function and variance decomposition methods, the first thing is establish the Vector Auto regression (VAR) Model, with the regression of all the time variable and all variable's certain lagged variable by EVIEWS, but because of it is difficulty using the VAR model to explain economical implication of the check result, therefore we usually use the Impulse Response Function (IRF) to explain the VAR model. The most prevalent VAR model as following:
yt Ay 1 t�1 �"� Ap yt�p �Bx 2 t �"� Bx r t�r �Ht ������������������� � In this modelˈ yt is m-dimensional endogenous variable vectorˈ xt is d-dimensional external variable vector˗ A1 ˈ A2 ˈ…ˈ Ap and B1 ˈ B2 ˈ…ˈ Br are the estimate the parameter matrix to treat, the endogenous variable vector and the external variable have the p step and the r step lag phase separately; H t is the stochastic disturbing term, the same time's element may be related each other, but cannot be related with the variable on the right side of model correlation and the own lag value.
The Impulse Response Function use to inspect the influence of the attacks of standard deviation from a stochastic disturbing term to the endogenous variable current and the future value. In this paper, when we take two variables as the dependent variable separately ,we will analyze the influence produced by standard
275
HUA Honglian et al. / Energy Procedia 17 (2012) 273 – 278
deviation's stochastic disturbing term of own lag value's which including a dependent variable and other variables, as well as influence way change. The VAR (1) model Consider two variables:
Rt ����������� Rt
a1 Rt �1 � b1M t �1 � H1t �������������������������˄�˅
a1 Rt �1 � b1M t �1 � H1t ������������������������˄�˅�
The stochastic disturbing term in the model is called the innovation, because it affected dynamically by H the error term in forecast time. In formula (1) and formula (2), if 1t changes, not only the current R value H changes, and it will also affect R and M later value through the current R value variable. Similarly, 2t also have such influence. If the innovations are related, usually the common ingredient belongs to the variable H H which presents in VAR systems firstly. In the two formula, the common ingredient of 1t and 2t belongs H to 1t .Therefore, changing the equation order of VA R model will cause the impulse response to be very greatly different. The Impulse Response function attempt to describe these influence paths to describe the perturbation of random variable to possess other variables through the model, and feeds back finally to own process. This paper based on the generalized impulse response function method which introduced by Koopetal, Pesaran and Shin et al to avoid the arbitrariness of Impulse Response and the independence of variables sorting order in Cholesky decomposition technology. 3.
Empirical Study
Carbon Footprint calculation Based on the above improvement model of Ecology Footprint, considered the overall characteristic of our country energy structure as well as the situation that less natural gas resource consumption in ethnic minority autonomous, therefore, only selected the raw coal and the crude oil which are these two kind of high carbon energy to calculate the comprehensive Carbon Footprint of the 5 ethnic minority autonomous regions in China from 2000-2008, table 1 showed the result: Estimation of VAR Model 1)The determination of the biggest lag exponent number: Based on the value of LR, FPE, AIC, SC and HQ in 0~ 2 second-order VAR model in table 2, as well as the principle that the “γ” mark surpasses half the criterion, defined this VAR model lag exponent number as the second-order lag. 2) Stable examination of variable time series: because the check result of pulse response function relies on this supposition premise strictly that the error vector satisfies the supposition premise strictly that the error vector satisfies the white noise sequence vector, therefore, the first one is carry on the stable examination to time series variable of the model. This paper uses the EVIEWS6.0 software, comprehensive survey autocorrelation and leaning autocorrelation of Ecology Footprint total and total GDP, the two variable time series in ethnic minority autonomous region. The inspection result showed that the Ecology Footprint and the total GDP time series are the first order difference steady, therefore, when establishes VAR (2) model, we used iEF, iGDP separately replaces the total Carbon Footprint and total GDP as the two sequences to establish the model. The estimate result of VAR (2) model as follow: iGDP
0.77iGDP(�1) � 2.37iGDP(�2) � 2.17iEF (�1) � 8.62iEF(-2)+1046.72
R12 iEF
0.93
(5)
0.18iGDP(�1) � 0.49iGDP(�2) � 0.61iEF (�1) � 1.69iEF (�2)+321.44
R22
0.64
(6)
276
HUA Honglian et al. / Energy Procedia 17 (2012) 273 – 278
From the above VAR estimate model, the relations between economic growth and the Carbon Footprint are: x The influence of preceding phase of economic growth to present economic growth is positive, the impact of former phase of economic growth to present economic is negative, it means that the influence of economic basis to promote economic development is obvious. x The influence of preceding phase of Carbon Footprint to economic growth is negative, but the impact of former phase is positive, this means that the influence of Carbon Footprint to economic growth is a process from strengthen to weaken gradually. x The influence of preceding phase of economic growth to present Carbon Footprint is positive, the former phase of economic growth to present economic impact is negative, and this means that the economic basis will affect the Carbon Footprint. TABLE I. REGION
TOTAL CARBON EMISSION AND CARBON FOOTPRINT IN ETHNIC
MINORITY AUTONOMOUS
�
Carbon Consumption ˄10000 tons˅
Carbon Emission ˄10000 tons˅
Carbon Footprint ˄10000 hm2˅
2000
10494.7
27559
1721.384 1753.664
2001
10683.06
28072
2002
11364.86
29882
1866.971
2003
15082.84
39918
2497.35
2004
17626.56
46803
2930.028
2005
20699.09
54929
3438.316
2006
23539.41
62520
3914.152
2007
26588.15
70802
4435.068
29196.87
77785
4872.931
2008 TABLE II.
THE JUDGING RESULT OF LAG EXPONENT NUMBE
Lag
LogL
LR
FPE
AIC
SC
HQ
0
-141.885
NA
2.64E+11
31.97434
32.01817
31.87976
1
-131.186
14.26451*
6.28E+10
30.48581
30.61729
30.20207
2
-122.287
7.910477
2.66e+10*
29.39708*
29.61622*
28.92418*
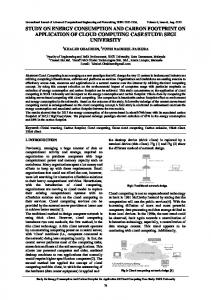
3) Dynamic analysis the relations between Carbon Footprint and economic growth: based on the VAR, used the generalized impulse response function analysis the dynamic response between Carbon Footprint and the economic growth. The results showed in Figure 1 and Figure 2. 800
3,000 2,000
400
1,000
0
0 -1,000
-400 -2,000 -3,000
-800 1
2
3
4
5
6
7
8
9
Figure 1ˊ Response of IEF to IGDP���
10
1
2
3
4
5
6
7
8
9
Figure 2ˊ Response of IGDP to IEF
10
HUA Honglian et al. / Energy Procedia 17 (2012) 273 – 278
p 3,000 2,000 1,000 0 -1,000 -2,000 -3,000 1
2
3 4 5 6 7 8 9 10 Figure 3. Response of IGDP to IGDP ���
Figure 1, Figure 2 and Figure3 are the generalized impulse response function curves simulation base VAR (2) and Analtic. In Figure 1, 2, 3, abscissa axis expression shock effect lag phase number (unit: year), the ordinate axis represents the response degree of dependent variable to the explanatory variable, the solid line is the impulse response function predicted value, the both sides dashed line were the two time of standard deviation belt of the impulse response function value positive and negative. In the model, the hypothesis lag phase of shock effect was 10 years. Figure 1 is a curves diagram of generalized impulse response function of the economic growth changes which caused by the impact of standard deviation of Carbon Footprint. When we give a standard deviation impact of Carbon footprint in present phase (Carbon Footprint increases), at the beginning of 20 months, the response of Carbon Footprint increases to economic growth is positive, but it weaken gradually and afterward in a short time, it become the negative response to the economic growth; In the second year and half ~forth year and half , there was the big forward response of Carbon Footprint increases to economic growth, in the 3rd year, the forward response achieves in a big way; When in the 4.5~7th year, there was a the long-term negative response of Carbon Footprint increases to economic growth, and then the interactive response begin converge and weaken stably. This phenomenon showed that there are long-term close relationship between Carbon Footprint and the economic growth, in short-term, the increase if Carbon Footprint will cause GDP increase; But in long-term, the function of Carbon Footprint by dies away, the economical meaning is: Carbon Footprint increases means that energy consumption increase, so, depends upon the massive energy consumption, economic growth can increase rapidly in the short-term, but when economic growth to the certain extent , massive energy consumption cannot bring the economic growth, even have the negative influence. Therefore, in process of economic development in the ethnic minority autonomous region, the economic growth pattern should not depend energy consumption extensively, but should consider the long-term policy, promote industrial structure adjustment and the guide the transformation of economic growth way. Figure 2 is a curves diagram of generalized impulse response function of the Carbon Footprint changes which caused by the impact of standard deviation of economic growth. When we give a standard deviation impact of economic growth in present phase (GDP increases), at the beginning of second year, the response of economic growth to Carbon Footprint increases is positive, the response is very strong at beginning, and then become negative response in a short time and both often appear alternately, and it weaken gradually; This phenomenon showed that there are long-term close relationship between Carbon Footprint and the economic growth, in short-term, the increase of GDP increase will cause Carbon Footprint increase, need more energy; But in long-term, the function of economic growth increase can decrease the Carbon Footprint, the economical meaning is: in the initial period of economic development, the in ethnic minority autonomous region, the economic growth mean the excessive energy consumption, therefore, in
277
278
HUA Honglian et al. / Energy Procedia 17 (2012) 273 – 278
this stage, economic growth will cause the increase of Carbon Footprint continually, but when economic growth Surpasses certain critical level, with the transformation of economic growth way and industrial structure's adjustment and optimization, economic growth will be advantageous to the Carbon Footprint drop. Therefore, in the process to realize sustainable development, we cannot neglect the function of economic development, must coordinated economic development and energy consumption. Figure 3 is the response situation and response way of standard deviation innovation of economic growth. the response of economic growth to an its own standard deviation innovation is positive in previous 1.8 years but weaken gradually and the presents the short time negative response; In the 2.5~4.2nd year, it is turn to the positive response, and in the third year it is achieving in a big way to the response; Hereafter, positive and negative response fluctuated, but the degree is weaken gradually. This indicated that the economic growth level is influence strongly by its lag value, the margin of fluctuation is big, and this means that the current economic basis has strong interrelatedness with its lag economy's growth. Compare Figure 3 and Figure 1, we can conclude that the influence of Carbon Footprint to economic growth and economic base to economic growth are similar in ethnic minority autonomous region, the showing economic growth is heavily reliant on the energy consumption. 4.
Conclusion
The above empirical analysis conclusion indicated that there is the strong interaction in long-term between economic growth and energy consumption in the ethnic minority autonomous region. This indicated that the economic development of ethnic minority autonomous region should reduce the level of dependency of energy, should adopts the long-term development policy, transform economic growth pattern, modify industrial structure and reduces the rate of heavy industry in the industry structure, improve the energy efficiency; At the same time, in realizes in the process of sustainable development, we cannot neglect economy's development, must coordinated the economic development and energy consumption. Acknowledgment Thanks for the support of Chinese National Social Sciences Foundation (07BMZ033). References [1] T. Wiedmann, J.Minx, “A Definition of Carbon Footprint.2007”. http://www·censa·org·uk/docs/ISA-UK_ReporJ. Clerk Maxwell, A Treatise on Electricity and Magnetism, 3rd ed., vol. 2. Oxford: Clarendon, 1892, pp.68–73. [2] P. Falkowski, R J. Scholes, E. Boyle,et al. “The Global Carbon Cycle: Atest of Our Knowledge of Earth as a System,” Science, vol. 290, 2000, pp:291~296. [3] Z.Rongqin, H. xianjin, “Carbon emission and carbon footprint of different land use types based on energy consumption of Jiangsu Province,” Geographical research, vol. 29,Sept.2010, pp:1639-1649 [4] Z.Rongqin, H. xianjin, Z. Taiyang, “Research on Carbon Emission Intensity and Carbon Footprint of Different Industrial Spaces in China,” Acta geographical sinica, vol. 65,Sept 2010, pp:1048-1056 [5] Energetics.The reality of carbon neutrality.www.energetics.com.au/file?node_id=21228 [6] X. Hongyu, C. Xiansheng, L. Kairong,et al, “The ecological footprint analysis of fossil energy and electricity” Acta ecologica sinica, vol. 28, Apr 2008, pp: 1729-1735


![How Big Is Your Carbon Footprint? - Energy Star [PDF]](https://m.moam.info/img/260x300/how-big-is-your-carbon-footprint-energy-star-pdf_647b4d40098a9ea74e8b4570.jpg)