May 17, 2007 - Results: estimated marginal costs of carbon sequestration through extending ..... Estimated total area of riparian zones and total cost of protecting ...... average yields of 59.4 bushels of wheat per acre, wheat-producing ...... afforestation of croplands at different price points below $100/t C ..... Planting Labor.
Carbon Sequestration through Changes in Land Use in Washington: Costs and Opportunities
Aaron Dushku, Sandra Brown, Timothy Pearson, Nick Martin, Silvia Petrova, Jonathan Winsten and John Kadyszewski
Ecosystem Services Unit 1621 N. Kent St, Suite 1200 Arlington, VA 22209
Title of the Report Name of primary author(s) or principal investigator Author’s company, organization, or affiliation Location of author’s company, organization, or affiliation (City, State) Name of Energy Commission/PIER Project Manager PIER Program Area PIER Program Area Lead Contract Number and Name (and Work Authorization name and number or Project name and number, if applicable) Publication Number (leave blank this information will be provided later by PIER) Publication Date (Month and Year)
Carbon Sequestration through Changes in Land Use in Washington: Costs and Opportunities Aaron Dushku, Sandra Brown, Timothy Pearson, Nick Martin, Silvia Petrova, Jonathan Winsten and John Kadyszewski Winrock International Arlington, Virginia
Guido Franco
Energy-Related Environmental Research Agreement number 500-02-004; Subcontract No. MR03-28D: “Baselines, Carbon Supply Curves, and Pilot Actions for Terrestrial Carbon Sequestration”
October 2005
Legal Notice This report was prepared as a result of work sponsored by the California Energy Commission (Energy Commission). It does not necessarily represent the views of the Energy Commission, its employees, or the State of California. The Energy Commission, the State of California, its employees, contractors, and subcontractors make no warranty, express or implied, and assume no legal liability for the information in this report; nor does any party represent that the use of this information will not infringe upon privately owned rights. This report has not been approved or disapproved by the Energy Commission, nor has the Energy Commission passed upon the accuracy or adequacy of this information in this report.
Winrock International_PIER-EA Final Reports (May 17, 2007)
i
Acknowledgements Brent Sohngen of Ohio State University contributed valuable analyses in the forest management section (Sohngen, B., J. Cathcart, and T. Ifie. 2005. Baselines, Carbon Supply Curves, and Pilot Actions for Terrestrial Carbon Sequestration in Washington; Report to Winrock International). Tony Ifie, Policy Advisor and EFSEC Designee for Executive Management at the Washington Department of Natural Resources, Jim Cathcart, Acting Forest Health & Monitoring Manager of the Oregon Department of Forestry and the rest of the WESTCARB Terrestrial Sequestration Working Group provided valuable inputs in the conceptual design of the methods and dataset acquisition. We would like to thank Don Nelson, Washington State University Extension Beef Specialist for the Pacific Northwest, and Tip Hudson, Washington State University Rangeland Extension Specialist, for assistance in the rangeland opportunity costs analysis. Dr. David “Sam” Sandberg and his staff of the Fire and Environmental Research Applications, USDA Forest Service, Pacific NW Research Station, Corvallis OR provided valuable help with using the FCCS data for the hazardous fuel component; and Dr. Roger Ottmar of the Pacific Wildland Fire Sciences Laboratory, USDA Forest Service Pacific Northwest Research Station, Seattle, WA, also provided valuable help with the FCCS data in the hazardous fuel component. We would also like to thank Winrock colleagues Sean Grimland, Sarah Walker and David Shoch for assistance in earlier phases of the analysis.
Citation Please cite this report as follows: Dushku, A., S. Brown, T. Pearson, N. Martin, S. Petrova, J. Winsten and J. Kadyszewski. 2005. Carbon Sequestration through Changes in Land Use in Washington: Costs and Opportunities. California Energy Commission, PIER Energy-Related Environmental Research. Publication number.
Winrock International_PIER-EA Final Reports (May 17, 2007)
ii
Table of Contents Preface viii Abstract ..........................................................................................................................................ix Executive Summary.......................................................................................................................1
Introduction .....................................................................................................................6
1. 1.1
Objectives of study .....................................................................................................6
Afforestation of rangelands and croplands...................................................................6
2. 2.1
Background.................................................................................................................6
2.2 Approach.............................................................................................................................8 2.2.1. Scale of analyses.........................................................................................................10 2.2.2. Washington land cover characterization..................................................................11 2.2.3.
Mapping suitability for afforestation with native species..................................14
2.2.4.
Species selection analysis......................................................................................17
2.2.5.
Modeling forest carbon sequestration potential .................................................17
2.2.6.
Carbon stock baselines in non-tree vegetation....................................................20
2.2.7.
Economic analyses.................................................................................................21
2.3 Results: carbon supply for rangelands and croplands.....................................................29 2.3.1 Carbon sequestration potential..................................................................................29 2.3.2
Total present value of costs...................................................................................31
2.3.3
Carbon supply for afforestation of range and crop lands ..................................33
Changes in forest management ......................................................................................40
3.
3.1 Background .........................................................................................................................40 3.2 Extending forest rotations..................................................................................................40 3.2.1 Approach.....................................................................................................................40 3.2.2
Data used in the analysis ......................................................................................44
3.2.2.1 3.2.2.2 3.2.2.3 3.2.2.4 3.2.2.5 3.2.3 3.3
Inventory and yield function parameters.......................................................44 Price data ..........................................................................................................46 Cost data ...........................................................................................................47 Taxes..................................................................................................................48 Biomass/carbon data ........................................................................................48
Results: estimated marginal costs of carbon sequestration through extending rotations..................................................................................................................49 Conservation of timber land in extended riparian buffers......................................52
3.3.1
Methods and analyses...........................................................................................52
Winrock International_PIER-EA Final Reports (May 17, 2007)
iii
3.3.2
4
Results: marginal costs of carbon conservation in riparian buffers...................55
Fuel load reduction on wildfire-prone areas .................................................................56 4.1
Introduction ................................................................................................................56 4.1.1
Magnitude of the problem ....................................................................................56
4.1.2
Approach and analysis of hazardous fuel reduction treatments.......................58
4.1.3
Objectives ...............................................................................................................61
4.2
Results: forested land at moderate to high fire risk .................................................61
4.3
Results: suitability for potential fuel reduction........................................................63
4.4
Results: moderate to high-risk forests treatable with CSCH...................................68
4.5
5.
4.4.1
Estimated biomass yield .......................................................................................68
4.4.2
Economic analysis and potential role of carbon emission reduction credits ....71 Analysis of low-severity and mixed-severity fire regime forests treatable with CSCH ......................................................................................................................................73
Next steps .........................................................................................................................75 5.1 Refinements to the analysis of carbon supply from fuel load reduction........................75 5.1.1 Refinement #1: Analysis of other HFR treatment types...........................................75 5.1.2 Refinement #2: GHG emissions from wildfire, and eligibility of HFR as a carbon offset activity..........................................................................................................76 5.2
Evaluation of carbon sequestration potential through afforestation using fastgrowing species and other forest management methods........................................77 5.2.1 Use of fast-growing species........................................................................................78 5.2.2 Other forest management methods...........................................................................78
References ......................................................................................................................................79
Tables Table ES-1. Summary of the quantity of carbon (million metric tons CO2 [MMT CO2]) and area (million acres) available at selected price points ($/t CO2)for several classes of activities on existing rangelands, croplands, and forestlands over 20-year, 40-year, and 80-year durations........................................................................................................................................ 3 Table 2-1. Land cover classification, areas and class generalization in Karl et al (1999) GAP Analysis. ...................................................................................................................................... 12 Table 2-2. Estimated rates of carbon sequestration of selected forest vegetation types............... 19 Table 2-3. Biomass carbon stocks in rangeland vegetation classes................................................. 21 Table 2-4. Revenue and costs associated with cattle ranching in Washington (data from CattleFax and T. Hudson and D. Nelson, Washington State University, 2005, pers. comm.). ....... 23 Winrock International_PIER-EA Final Reports (May 17, 2007)
iv
Table 2-5. Present value of current and future costs associated with sequestering carbon on Washington rangelands through afforestation......................................................................... 26 Table 2-6. Present value of the total costs for afforesting crop lands in Washington after different time intervals............................................................................................................................... 29 Table 3-1. Estimated yield function parameters or Washington. Yield at 120 years using the parameters and the maximum yield observed in FIA data is shown. .................................... 45 Table 3-2. Parameters used to calculate sawtimber proportion of stands for Washington. ......... 46 Table 3-3. Timber prices for RPA timber types in Washington (2005) ........................................... 47 Table 3-4. Regeneration cost estimates for Washington .................................................................. 47 Table 3-5. Tax rates used in Washington ($ per hectare per year) .................................................. 48 Table 3-6. Carbon biomass parameters (from Smith et al., 2003). All parameters are specific to the RPA type for all of Washington, although specific site classes are used to calculate growing stock volume (GSV) and carbon at 70 years. ............................................................. 49 Table 3-7. Net carbon sequestered and $ per ton for increasing rotation ages 5 – 10 - 15 years above economically optimal rotation ages in Washington (west-side of Cascades) ............. 50 Table 3-8. Aggregate estimated carbon potential with holding timber past economically optimal rotation periods for Washington. .............................................................................................. 51 Table 3-9. Net carbon sequestered and costs in $ per ton for setting aside mature forests in riparian zones in Washington.................................................................................................... 54 Table 3-10. Estimated total area of riparian zones and total cost of protecting currently mature areas in Washington. .................................................................................................................. 55 Table 4-1. Benefits, constraints and representative costs for HFR treatments. ............................. 59 Table 4-2. Distribution of forest area (ha) by forest type. ................................................................ 62 Table 4-3. Available biomass, as bone dry tons, per area (BDT/ha), area (ha), available pretreatment biomass (BDT) and quantity CSCH treatable biomass (BDT) according to scenario 1 and scenario 2............................................................................................................ 71 Table 4-4. Quantity of CO2 emissions reductions (t CO2/ha and t C/ha) that would need to be produced by HFR activities in order to cover estimated per-hectare subsidies needed for CSCH. .......................................................................................................................................... 73
Figures Winrock International_PIER-EA Final Reports (May 17, 2007)
v
Figure 2-1. Photographs of Washington crop lands (Photo credits: WA State Tourism, John Marshall)........................................................................................................................................ 7 Figure 2-2. Photographs of Washington rangelands (Photo credits: www.mckuster-ranch.com , WA State Tourism). ...................................................................................................................... 8 Figure 2-3. Flowchart of carbon supply curve analysis with key assumptions listed below each step............................................................................................................................................... 10 Figure 2-4. Broad land cover classes from NW Regional GAP analysis (top) and cropland cover classes from the NLCD map (bottom)....................................................................................... 14 Figure 2-5. Map showing dominant soils components with available STATSGO ‘woodprod’ data............................................................................................................................................... 15 Figure 2-6. Forest suitability scores cross-referenced to land cover classes. The higher the score the more suitable the site is for forests and vice versa............................................................. 16 Figure 2-7. Distribution of existing rangelands and all forest classes within the forest suitability classes........................................................................................................................................... 17 Figure 2-8. (a) Map showing dominant soils components with available STATSGO ‘rsprod’ (range productivity) data (maroon areas were filled with regression results); and (b) estimates of forage production for areas with ‘rsprod’ data. .................................................. 25 Figure 2-9. Carbon sequestration potential from afforestation with native species on suitable rangelands in Washington. ........................................................................................................ 30 Figure 2-10. Carbon sequestration potential from afforestation with native species on suitable crop lands in Washington. ......................................................................................................... 31 Figure 2-11. The present value of the total cost ($/ha) to afforest candidate rangelands............ 32 Figure 2-12. The present value of the total cost ($/ha) to afforest candidate croplands.............. 33 Figure 2-13. Costs of carbon sequestration through afforestation of suitable rangelands of Washington.. ............................................................................................................................... 34 Figure 2-14. Costs of carbon sequestration through afforestation of suitable croplands of Washington. ................................................................................................................................ 35 Figure 2-15. Carbon supply curves for afforestation of suitable rangelands in Washington: (top) areas available and (bottom) quantity available at different costs per ton carbon. ............... 36 Figure 2-16. Spatial distribution, at the county scale of resolution, of the total amount of carbon that could be sequestered by afforestation of rangelands after 20, 40, and 80 years. ............ 37 Figure 2-17. Carbon supply curves for afforestation of suitable crop lands in Washington: (top) areas available and (bottom) quantity available at different costs per ton carbon. ............... 38
Winrock International_PIER-EA Final Reports (May 17, 2007)
vi
Figure 2-18. Spatial distribution, at the county scale of resolution, of the total amount of carbon that could be sequestered by afforestation of croplands after 20, 40, and 80 years. ............. 39 Figure 3-1. Comparison of total carbon storage on the landscape and in forest products over a 300 year period for a high site Douglas Fir stand in western Washington. ........................... 44 Figure 3-2. Marginal cost curves for carbon sequestration through aging, including 5, 10, and 15 year rotation extension periods in Washington........................................................................ 52 Figure 3-3. Distribution of the costs of carbon sequestration for extending rotations 15 years in Washington. ................................................................................................................................ 52 Figure 3-4. Tons carbon per hectare stored in above-ground biomass and products for the baseline (blue) and set-aside (red) for high site Douglas fir stands in Washington region 1. ...................................................................................................................................................... 53 Figure 3-5. Costs of sequestering carbon in $/t C through expanding riparian zones in Washington. ................................................................................................................................ 56 Figure 4-1. National Interagency Fire Center statistics showing federal expenditures in millions of dollars from 1994 to 2002. ...................................................................................................... 57 Figure 4-2. Schematic of potential HFR treatments (adapted from USDA Forest Service Research & Development/Western Forestry Leadership Coalition 2003). ............................................ 59 Figure 4-3. Distribution of Washington’s forests at moderate and high risk for wildfires........... 63 Figure 4-4. Suitability for Potential Fuel Removal (SPFR) scores for Washington, with highest suitability assigned to areas close to roads, on gentle slopes, and close to existing power plants............................................................................................................................................ 65 Figure 4-5. Suitability for Potential Fuel Reduction (SPFR) scores for Washington forest lands at moderate and high risk of wildfire, and within 50 miles of existing power plants............... 66 Figure 4-6. Forests at moderate and high risk for wildfires per SPFR classes. .............................. 67 Figure 4-7. Forest types at moderate and high risk for wildfires per SPFR class. ......................... 67 Figure 4-8. Critical factors to determine forest lands suitable for CSCH fuel treatment: A – Slope less than 40%; B- Yarding distance less than 0.25mi; C- Distance from existing power plants less than 50 miles. ....................................................................................................................... 69 Figure 4-9. Available biomass in the CSCH treatable forest. .......................................................... 70 Figure 4-10. Critical factors to determine forest lands with low-severity and mixed-severity fire regimes, suitable for CSCH fuel treatment: A – Ponderosa pine and mixed xeric coniferous forest in Washington state; B – Slope less than 40%; C- Yarding distance less than 0.25mi; DDistance from existing power plants less than 50 miles. ......................................................... 74
Winrock International_PIER-EA Final Reports (May 17, 2007)
vii
Preface The Public Interest Energy Research (PIER) Program supports public interest energy research and development that will help improve the quality of life in California by bringing environmentally safe, affordable, and reliable energy services and products to the marketplace. The PIER Program, managed by the California Energy Commission (Energy Commission), annually awards up to $62 million to conduct the most promising public interest energy research by partnering with Research, Development, and Demonstration (RD&D) organizations, including individuals, businesses, utilities, and public or private research institutions. PIER funding efforts are focused on the following RD&D program areas: •
Buildings End-Use Energy Efficiency
•
Energy-Related Environmental Research
•
Energy Systems Integration
•
Environmentally Preferred Advanced Generation
•
Industrial/Agricultural/Water End-Use Energy Efficiency
•
Renewable Energy Technologies
Carbon Sequestration through Changes in Land Use in Washington: Costs and Opportunities is one of several final reports for the “Baselines, Carbon Supply Curves, and Pilot Actions for Terrestrial Carbon Sequestration” project (Agreement number 500-02-004, Subcontract No. MR03-28D) conducted by Winrock International. The information from this project contributes to PIER's Energy-Related Environmental Research program. For more information on the PIER Program, please visit the Energy Commission’s Web site www.energy.ca.gov/pier or contact the Energy Commission at (916) 654-5164.
Winrock International_PIER-EA Final Reports (May 17, 2007)
viii
Abstract This report presents potential carbon supply from several classes of activities in Washington’s forest, range and crop lands: afforestation of rangelands, afforestation of croplands, changes in forest management including extending rotations and widening riparian buffers, and hazardous fuel reduction to reduce emissions from wildfire in fire-prone forest ecosystems. For each activity, methods and results are presented for estimating the total quantity of carbon that could be sequestered, followed by an economic analysis summarizing total costs of converting lands or changing management to sequester carbon. Carbon supply curves are presented illustrating the total area of land that would be converted or put under different management, and total quantity of carbon thus sequestered, at different prices of carbon. The report concludes with a summary of next steps and further refinements for the second phase of the West Coast Regional Carbon Sequestration Partnership. Keywords: carbon sequestration, afforestation, forest management, hazardous fuel reduction
Winrock International_PIER-EA Final Reports (May 17, 2007)
ix
Executive Summary Introduction Of late there have been several estimates of the terrestrial carbon storage potential in regions of the United States based on biological and technical criteria coupled with coarse-scale consideration of the economic costs associated with changing land management practices. Recent work by Winrock International for California, and for all the states under the US Department of Energy’s Southeast Regional Carbon Sequestration Partnership, has focused on adding more detailed analysis of opportunities on both agricultural and forest lands; biological rates of carbon sequestration, taking into consideration variations in site conditions across the landscape; and incorporating more detailed analysis of all costs. Consideration of the varying carbon sequestration potential of different land classes and other economic factors yield more realistic estimates of carbon storage potential and associated costs. Realistic assessments of the potential for carbon sequestration from changes in land use can help policy makers and the private sector prepare for an uncertain regulatory future by providing estimates of the quantity of carbon credits that might be available at different price points for different classes of activities. Purpose The broad purpose of the project entitled “BASELINES, CARBON SUPPLY CURVES AND PILOT ACTIONS FOR TERRESTRIAL CARBON SEQUESTRATION” is to quantify terrestrial carbon sequestration opportunities across the West Coast Partnership region and estimate the quantity of carbon credits that might be available at different price points. This report focuses on the state of Washington. Project Objectives Methodologies developed by Winrock International in its work with Electric Power Research Institute and the California Energy Commission will be applied to develop carbon supply curves for the major classes of potential land-use and forest-based activities in Washington. Specifically: •
Using standard data from available data sources and available methodologies, estimate the amount of carbon that will be sequestered by a particular change in land use or management practice.
•
Prepare carbon supply curves for different classes of potential terrestrial projects, including afforestation of cropland, afforestation of rangeland, and changes in management of forestland.
Project Outcomes The state of Washington ‘s lands are classified into three main groups for the analyses presented here: forests, rangelands, and agricultural lands. Forests (about 20.2 million acres) include Winrock International_PIER-EA Final Reports (May 17, 2007)
1 of 95
conifers, hardwoods, and mixed classes; rangelands (about 11.7 million acres) include a variety of non-woody and woody ecosystems; and agricultural lands (about 9.6 million acres) include a wide range of non-woody crops such as wheat and hay and woody crops such as vineyards and orchards. The carbon supply associated with a potential change in land use was estimated through the following steps: (1) Identify the classes of land uses and the associated changes in management that could lead to significant increase in carbon stocks (2) Estimate the area for each potential change in land use (3) Estimate the quantities of carbon per unit area that could be sequestered for the change in land use over a given time period (4) Estimate the total costs (opportunity, conversion, maintenance, and measuring and monitoring) (5) Combine the estimated quantities of carbon per unit area with the corresponding area and cost to produce estimates of the total quantity of carbon that can be sequestered for a given range of costs, in $/metric ton C or $/metric ton CO2. For rangelands and croplands (lands growing wheat and hay), the potential carbon sequestration was estimated for afforestation using native species. Historical evidence suggests that in many areas, large tracts of forest may have once stood where grazing and agricultural lands now do. The general approach was to identify and locate existing rangelands and croplands where biophysical conditions could favor forests, estimate rates of carbon accumulation for the forest types projected to grow, and assign values to each contributing cost factor. The carbon supply is estimated for three time durations: 20 years, 40 years and 80 years of forest growth, to reflect the impact of activity duration on the likely supply and to provide an assessment for the near–term and longer-term planning horizons. For forestlands, potential carbon supply was estimated for three alternatives for 20-year and/or permanent contract periods: (1) allowing timber to age past economic maturity (lengthening rotation time); (2) increasing the riparian buffer zone by an additional 200 feet; and (3) hazardous fuel reduction in forests to reduce catastrophic fires, and subsequent use of fuels in biomass power plants. For estimating the costs of allowing timber to age and the costs of enhanced riparian zone management, estimates are based on specific counties for public and private landowners, and then extrapolated to all counties throughout the state. For the fuel reduction alternative, the analysis used a “Suitability for Potential Fuel Reduction (SPFR)” score on forest landscapes where potential exists for significant carbon loss from moderate to high intensity wildland fires. The SPFR scores were created in a GIS using slope, distance to biomass plants, and distance from roads as equal weighted factors in the decision-making process. Table ES-1 summarizes the amount of carbon and the area available for several classes of opportunities at three commonly used price points: • $2.40/t CO2 ($8.81/t C), • $10.00/t CO2 Winrock International_PIER-EA Final Reports (May 17, 2007)
2 of 95
($36.67/t C), and •$20.00/t CO2 ($73.33/t C). The full range of costs and potential carbon available are presented later in the report. At a price of $2.40/t CO2, no carbon could be sequestered by afforesting rangelands and croplands at 20 years, but after 40 years the amount goes up to 14.8 MMT CO2 and to about 2013 MMT CO2 at 80 years (Table ES-1). Higher prices per t CO2 make it possible to begin converting lands and sequestering carbon even with a 20-year time duration, and the total amount sequestered rises sharply to more than 1 billion MMT CO2 at 40 years and more than 2.5 billion MMT CO2 at 80 years (Table ES-1). Converting this total amount at 40 years to an approximate annual rate results in about 30 MMT CO2/ yr. Table ES-1. Summary of the quantity of carbon (million metric tons CO2 [MMT CO2]) and area (million acres) available at selected price points ($/t CO2)for several classes of activities on existing rangelands, croplands, and forestlands over 20-year, 40-year, and 80-year durations.
Quantity of C—MMT CO2
Activity
20 years
40 years
80 years
Area available—million acres 20 years
40 years
80 years
Rangelands-Afforestation •$2.40
0
14.8
2013
0
0.06
4.45
•$10.00
282
1031
2530
4.18
6.17
9.04
•$20.00
473
1219
2534
8.95
9.07
9.07
Croplands-Afforestation •$2.40
0
0
25.5
0
0
0.05
•$10.00
0
57.2
266
0
0.26
1.43
•$20.00
52.3
271
738
1.05
3.32
5.59
Forest lands-Lengthen rotations by 5 years (permanent contracts) •$2.40
6.0
•$10.00
7.2
•$20.00
13.5
Although Washington has substantial areas of forests, the cost of carbon sequestration from changing forest management practices is relatively high and the quantity of carbon that could be sequestered is relatively small at all price points (Table ES-1). All of the carbon available at prices of less that $10/t CO2 for extending rotations by 5 years is located on non-federal public lands; only when prices each between $10-20/t CO2 do private lands generate potential carbon Winrock International_PIER-EA Final Reports (May 17, 2007)
3 of 95
credits. If all of the private and non-federal public land nearing the economically optimal rotation period (1.46 million acres) were contracted to increase rotation ages by 15 years, 61.6 MT CO2 could be sequestered for average costs of $37/t CO2. The potential area of mature forests where the riparian buffer zone could be increased by an additional 200 feet was estimated at 34.9 thousand acres. The additional carbon that could be stored on these lands if the forests were conserved is 2.2 MMT CO2 at an average cost of $33.3/t CO2. From the forest hazardous fuel reduction analysis, the area of Washington forests at moderate to high risk for fire is estimated to be 13.3 million acres. A commonly used potential hazardous fuels treatment is “Cut-Skid-Chip-Haul” (CSCH), a treatment in which hazardous fuel is harvested in the woods, bunched and skidded to a landing, chipped into a chip van, and hauled to a biomass energy facility for electricity and/or heat generation. The area of moderate to high fire risk forestlands in the state to which this treatment could be applied (on lands with 32; Figure 2-7) could be afforested with mesic mixed conifer species and ponderosa pine.
2.2.4.
Species selection analysis
The carbon sequestration potential for any given grid cell was developed by first identifying the dominant forest vegetation types that exist in those suitability classes in other areas of the state. This is the way to select the kinds of tree species that would most successfully be planted on candidate sites. This analysis needed to be constrained because if sites in the northeastern part of the state are in the same suitability class as ones in the southwestern part, they could be assigned the same dominant forest vegetation type, even if this would not be the case in reality. To prevent this, we constrained the species selection step with a map of Holdridge Life Zone classes of the state created by Lugo et al. (1999). In this way, the dominant forest vegetation type was mapped for all suitability classes in each Holdridge Life Zone.
2.2.5.
Modeling forest carbon sequestration potential
Existing models of forest growth were considered, including CRYPTOS and CACTOS models (Wensel et al., 1986) and Forest Vegetation Simulator developed by the U.S. Forest Service. Given the data requirements for these models, they were deemed to be less useful for application to the large scale of this effort. Therefore, models were developed to estimate Winrock International_PIER-EA Final Reports (May 17, 2007)
17 of 95
directly rates of forest carbon accumulation on a per unit area basis, and that would require a manageable suite of inputs: forest type and forest suitability class. To simplify, other factors influencing forest growth (e.g. site preparation, planting density, management) were held constant. The carbon accumulation numbers applied to this analysis were prepared to be conservative yet fully transparent and supported. Where possible the numbers are taken from the US Department of Energy’s 1605b greenhouse gas reporting program’s look-up tables (http://www.pi.energy.gov/pdf/library/AppendixPartIForestry0321.pdf). Where look-up table values were not applicable, carbon accumulation data was taken from the published literature. For the analysis, carbon stock densities are required for years 20, 40 and 80, so literature values were used in a growth model to derive values for these years. The Chapman-Richards function (Richards 1959; Pienaar and Turnbull 1973), a popular sigmoid-shaped biological growth model, has been used in related reports and found to be appropriate as it is simple to use, transparent, and data are available for parameterization. The Chapman-Richards function of the following form was chosen to model biomass carbon accumulation over time:
yield = a × (1 − e( − k ×age ) )1 (1− m ) Parameters for Chapman-Richards models were estimated to tailor carbon yield curves for each vegetation class, and passing through the previously determined age:biomass/ha points. • • • • •
“yield” is expressed in metric tons of biomass “age” is expressed in years “a” (asymptote) determined from literature “m” parameter set iteratively at 0.7 (fraction of asymptote (final yield) at which growth rate peaks), back calculation for “k” (rate at which the asymptote is approached)
The age at which mean annual increment (MAI) peaks, roughly the age at which stand volume begins to level off (here assumed to be the age at which yield = 80% of the asymptote) was determined in consultation with Josephson (1962), referencing empirically-derived yield tables, and the USFS Silvics of North America for species growing in Washington (Burns and Honkala 1990). All values reported here include the carbon in above- and belowground live biomass. Where a single forest class had significant coverage across a wide range of forest suitability classes (>10 classes) in a Holdridge Life Zone, the forest class was further broken down into productivity classes (high, medium, and low productivity). The cumulative distribution of the areas across the life zone’s suitability classes was then divided into equal area low, medium and high productivity classes. The carbon sequestration estimates are shown in Table 2-2.
Winrock International_PIER-EA Final Reports (May 17, 2007)
18 of 95
Table 2-2. Estimated rates of carbon sequestration of selected forest vegetation types.
Forest type
Subalpine forest
Northwest Regional Gap Analysis Categories Subalpine fir Engelmann spruce Mixed subalpine coniferous forest
Example Species
Engelmann spruce, Subalpine fir
Prod. Class
Biomass carbon (t C/ha) at age: Source 20
40
80
High
50.65
85.7
159.5
Mid
40.85
62.75
114.65
116
285
501
Smithwick et al.2002, ChapmanRichards
1605b
Mixed coastal forest
Coastal coniferous forest Coastal lodgepole pine Mixed coastal forest Grand fir
Grand fir, Douglas fir, Sitka spruce, lodgepole pine
Jeffrey Pine
Jeffrey pine
Jeffrey Pine
38.42
134.87
254.09
Burns and Honkala 1990, Smith et al. 2003, Cairns et al.1997
Lodgepole Pine
Lodgepole pine
Lodgepole Pine
25.2
53.3
95
1605b
Ponderosa Pine
Ponderosa pine
Ponderosa Pine
28.8
46
76.1
1605b
Douglas fir
Mesic Douglas fir
Douglas fir
High
49.6
180.7
391.4
1605b
Mid
39.5
132.5
315.5
Low
29.3
84.2
239.5
High
65.5
231
467.7
Mid
51.6
173
399
Low
37.7
115
329
Western Hemlock
Western Hemlock
Western hemlock
Winrock International_PIER-EA Final Reports (May 17, 2007)
19 of 95
1605b
Forest type
Northwest Regional Gap Analysis Categories
Example Species
Prod class
Biomass carbon (t C/ha) at age: Source 20
40
80
Mixed mesic forest
Mountain Hemlock Western Redcedar Mixed mesic coniferous forest Coniferous forested riparian Deciduous forested riparian Whitebark pine Mesic mixed forest Miixed riparian
Douglas fir, Moutain hemlock, Western redcedar
57
161
350
Smithwick et al. 2002, ChapmanRichards
Mixed xeric forest
Mixed xeric coniferous forest
Ponderosa pine, western larch, Douglas fir
22
55
96
Smithwick et al.2002, ChapmanRichards
Bigleaf maple, cottonwood, aspen
50.2
84.5
161.5
1605b
Western Larch Xeric Deciduous Forest Xeric Douglas Fir Xeric Mixed Forest Mesic deciduous forest
2.2.6.
Mesic deciduous forest Deciduous forested riparian
Carbon stock baselines in non-tree vegetation
The rangeland vegetation classes from the Northwest regional gap analysis were combined into categories based on biomass. Biomass values for each of the categories were obtained from Forest Inventory and Analysis data (USFS) and from the literature. The biomass carbon values and the sources of the data are given in Table 2-3. Winrock International_PIER-EA Final Reports (May 17, 2007)
20 of 95
Table 2-3. Biomass carbon stocks in rangeland vegetation classes.
Vegetation type
Northwest Regional Gap Analysis Categories
Biomass carbon (t C/ha)
Source
Wet Grasslands
Alpine meadow Wet meadow
5.9
Prichard et al., 2000
Mesic Grasslands
Subalpine meadow Gramminoid/Forb Riparina
2.4
Brown and Archer, 1999
Xeric Grasslands
Xeric grasslands
0.6
Winrock unpublished data
Shrub/Tree
Pinyon pine Moutain mahogany Utah juniper Western juniper
25.5
FIA analysis
Shrub
Big sagebrush Shrub-dominated riparian Bitterbrush Other sagebrush Rabbitbrush salt-desert shrub Upland shrubland
5.1
Martin et al., 1981
2.2.7.
Economic analyses
All economic decisions involve trade-offs. If activity X is forgone in order to undertake activity Y, then the value of undertaking activity X must be considered as the opportunity cost of undertaking activity Y. Simply put, the opportunity cost is the most highly valued alternative to the activity being considered. In this case, the activity being considered is afforestation of range and crop land in Washington. Therefore, the profitability per hectare in Washington represents the opportunity cost of producing carbon on that land (i.e. afforestation). The ultimate cost of producing carbon on crop or range land is going to differ from field to field and county to county, primarily based on the quality of the soil and growing conditions, which directly influences both yields (i.e. opportunity costs) and carbon yields (i.e. afforestation). In the economic analysis, the “price” a farmer/rancher would need to receive to take a parcel of land out of agriculture/rangeland and put it in some other carbon sequestering use needs to be estimated. That “price” must be equal to or greater than the return the farmer/rancher is currently receiving from the agricultural use of that land. Therefore, the “price” will have to be equal to the marginal return to the farmer from that parcel of land under consideration. That marginal return is the estimated revenue less the input costs for the agricultural enterprise in Winrock International_PIER-EA Final Reports (May 17, 2007)
21 of 95
question. Fixed costs of production are not a factor in this analysis because it is unlikely that a farmer will enroll all land in a carbon sequestration program, but only marginal parcels. Fixed costs for the farm, then, would remain the same. The economic analysis methodology for estimating the opportunity costs of afforestation projects on range and crop land is based on widely available data on prices, costs, and yields of the major crops produced in the state. We have intentionally designed this methodology to be easily replicable across states. In doing so we have foregone some degree of local specificity regarding costs and prices of crop production, but we feel that the simplicity and replicability of this approach outweighs the small margins of error caused by using regional cost and price data. To calculate the total cost of afforesting rangeland and cropland, the variables considered were opportunity costs, one-time conversion costs, management, costs and measurement and monitoring costs. The economic analysis for rangelands is practically identical to that used for California (Brown et al. 2004) and that for croplands the same as that for the Southern States regional partnership (Brown and Kadyszewski, 2005a). Here we briefly describe the approaches for estimating total costs and the local values used in the analyses. Rangelands The most highly valued alternative to afforestation is cattle ranching. (An alternative to afforestation of rangelands could be conversion to urban development, and depending upon the price of real estate, the opportunity cost for this alternative could be high. We did not consider this alternative in our analysis.) Therefore, the profitability per acre of cattle ranching in Washington represents the opportunity cost of producing carbon (i.e. afforestation). The profitability of cattle ranching varies greatly from year to year and from ranch to ranch. This is due primarily to weather conditions and cyclical fluctuations in the price of beef. Unfortunately annual enterprise budgets for cattle ranching, which indicate profitability, are not officially kept in Washington. Because of this, we used input from recent Cattle-Fax 1 publications and from personal communication with rangeland extension specialists to calculate an average annual profitability value for Washington cattle ranching (Table 2-4). The revenue estimates that reported in Table 2-4 reflect long-term average prices received for cattle. After subtracting total costs of production from revenue, an average annual profit per cow is estimated to be $94.75.
From personal communication with Don Nelson 2005. Washington State University, Extension Beef Specialist for Pacific Northwest; and Tip Hudson 2005. Washington State University Rangeland Extension Specialist.
1
Winrock International_PIER-EA Final Reports (May 17, 2007)
22 of 95
Table 2-4. Revenue and costs associated with cattle ranching in Washington (data from Cattle-Fax and T. Hudson and D. Nelson, Washington State University, 2005, pers. comm.).
Economics of Ranching in Washington Revenue Total
$/animal
Calf
$600.00 $510.00
Cull cows
$425.00
Total Revenue
$63.75
Assumption 85% wean rate 15% cull rate
$573.75
Costs in $/animal Pasture
$130.00
Supplemental feed
$151.00
Other operating and fixed costs
$198.00
Total Costs
$479.00
Mean annual profit/animal (Revenue – Costs)
$94.75
Other than the wide swings in the price received for cattle, the most critical variable in determining ranching profitability is the forage production potential of the rangeland. Forage production determines the carrying capacity of the land. Higher forage production can support more cows per acre and therefore results in higher profits per acre. Moisture and soil conditions are the primary predictors of rangeland productivity and are the drivers of the methodology described below. Western rangeland specialists use an average of 791 lbs. of forage dry matter (DM) to represent the monthly requirements for cattle being fed on rangeland forages (L. Metz 2003, USDA-NRCS, Davis, CA, pers. comm.). This monthly requirement is termed an animal unit month (AUM) and it is used as a measure of the carrying capacity of a parcel of rangeland. Therefore, if one acre of rangeland produces 791 lbs. of forage DM over the course of one month, that acre is said to produce one AUM of forage. This translates into an annual per cow forage requirement of 9,492 lbs. DM (12 times the AUM). This forage requirement estimate (i.e. AUM of 791 lbs.) and the average annual per cow profitability of $94.75 was used to estimate the profitability potential (i.e. opportunity cost) for all Washington rangelands, as explained next. For rangeland that produces only 100 lbs. of forage DM per acre, almost 95 acres will be required to support one head of cattle for a year. The annual per acre profitability of this lowproducing rangeland is estimated to be only $1.00 (i.e. $94.75/95). High producing rangeland Winrock International_PIER-EA Final Reports (May 17, 2007)
23 of 95
of 2,000 lbs. DM per acre per year will require only 4.75 acres to support one head. In this case the annual per acre profitability is $19.96 (i.e. $94.75/4.75). The relationship between annual average per cow profitability and annual average per cow forage DM requirements yields a constant relationship indicating that each lb of forage DM is equal to $ 0.009982 in ranch profits. This average profitability figure per lb of forage production is used to project the profitability of all Washington rangelands. The model used to estimate the forage DM production for each pixel of Washington rangeland is described in the following section. The modeling methodology that was developed to estimate forage production for all Washington rangelands used forage production estimates from the State Soil Geographic Database (STATSGO). The forage production estimates were then translated into a livestock carrying capacity for the land and combined with the average per cow profitability (Table 2-4) to estimate the average annual opportunity cost of afforestation for each pixel of rangelands on the map. Because forage production from STATSGO was not available for the full extent of a state’s rangelands, a multivariate regression was run using the variables of aspect, slope, elevation, mean annual precipitation, mean annual temperature and soil available water content (based on the approach developed for California). These data were extracted from 5180sample locations in both Washington and Oregon where STATSGO data were available for the dominant soil components, and a highly significant relationship as reflected in low P values was derived. Figure 2-8a shows areas where forage production data were unavailable from STATSGO and where the regression analysis was used to fill in the gaps. And Figure 2-8b shows the range of forage production in areas where STATSGO data were available. Most of the mapped rangelands have low productivity (less than 600 lb/ac.yr) and would require about 16 acres to support one animal. Conversion costs represent the estimated cost for establishing tree plantings on rangelands in Washington. Based on information from timber companies in California, the cost of establishing forests varies from $300 to $600 per acre. The variability stems mostly from the moisture, soil texture, and slope of the site. For this analysis, an average value of $450 per acre was used. Another cost included in the analysis is an expected maintenance cost that is projected to be incurred for a period of 5 years from the beginning of the activities to ensure that enough tree seedlings survive to generate a well-stocked stand. Activities expected (depending upon local conditions) include replanting seedlings that died, weeding (or herbicide application), possibly fertilizing and adequate fencing to control livestock incursion until the trees get established. Annual maintenance costs are estimated to be approximately $8/ac.yr during the first 5 years of the activities.
Winrock International_PIER-EA Final Reports (May 17, 2007)
24 of 95
(a)
(b) Figure 2-8. (a) Map showing dominant soils components with available STATSGO ‘rsprod’ (range productivity) data (maroon areas were filled with regression results); and (b) estimates of forage production for areas with ‘rsprod’ data. Winrock International_PIER-EA Final Reports (May 17, 2007)
25 of 95
The final cost category is the costs of measuring and monitoring the carbon production over the life of the activity. The average annual M&M costs associated with carbon production contracts is estimated to equal $1.60/ac for 20-year projects, $1.08/ac for 40-year projects, and $0.80/ac for 80-year projects, based on Winrock's experience with measuring and monitoring many afforestation activities throughout the US. Several factors affect the magnitude of the cost including which pools are measured and monitored (in this case we assume only aboveground biomass), frequency of monitoring (once every five years over duration of project), area, and whether the lands are contiguous or dispersed (assumed here to be contiguous). The area of the activity is an important factor and economies of scale exist for M&M costs; therefore, per-acre M&M costs may be significantly higher for smaller activities. Because the economic analysis is considering afforestation activities that are 20, 40, and 80 years in duration, the annual opportunity cost estimates must be projected into the future (20, 40, and 80 years) and then discounted to obtain a present value (PV) estimate of the annual stream of profits from farming that would be foregone to allow for afforestation. The real discount rate used in this analysis is 4 percent (6% discount rate minus 2% inflation rate). The costs that are incurred only at the beginning of the project are not discounted. These include the conversion cost and the contract cost (currently assumed to be zero because data are not available) and are added to the total present value costs. The resulting numbers represent the present value of all of the current and future (for the life of the carbon project) costs associated with sequestering carbon on rangelands through afforestation (Table 2-5). Table 2-5. Present value of current and future costs associated with sequestering carbon on Washington rangelands through afforestation. Forage production Lbs/acre.yr 100 500 1000 1500 2000
20 year $1,298 $1,432 $1,599 $1,767 $1,934
40 year $1,312 $1,507 $1,751 $1,995 $2,239
80 year $1,317 $1,552 $1,847 $2,142 $2,437
Crop lands The economic analysis for croplands involves estimating the profitability of crop production for the major relevant crops of Washington using USDA county-level area and yield data. The crops that are selected to be included in the analysis are the crops that meet both of the following criteria: (1) represent a significantly large area in the state, and (2) have an average profitability that is low enough to allow carbon projects to be a possible alternative (i.e. commodity as opposed to high-value crops). The two crops that meet these criteria for Washington are wheat and hay. Although there are many additional types of crops produced in Washington, this analysis has intentionally considered only wheat and hay for several reasons. First, these crops cover the majority of cropland throughout the state. Second, of all the crops grown in the state, these ‘conventional’ or ‘commodity’ crops represent the most likely crops to be foregone for carbon Winrock International_PIER-EA Final Reports (May 17, 2007)
26 of 95
projects due to their relatively lower profitability. Land producing higher-value crops is, by definition, going to have greater average profitability and therefore be less likely to be used for afforestation. The main technical reasons why the higher-value crops were not included in this analysis is that they tend to cover smaller areas and are not distinguished clearly on any landuse or land-cover maps and thus are difficult to identify; row crops such as wheat and hay are relatively well-defined on land-use maps. The area and the average yield for each county within Washington were collected from the USDA National Agricultural Statistics Service (NASS) for the years 2000-2004. NASS's annual program focuses on agricultural production for mainstream crops, livestock and associated inventories. The program is based on a series of sample surveys to collect farm level data to produce the State and U.S. crop forecasts and estimates published in the NASS Agricultural Statistics Board reports. Profits, or marginal returns (MR) to the land, per area of land can be calculated with the expression, MR = PY – CY + G; where P is the price per unit for each commodity received by the farmer, Y is the expected yield of that crop, C is the variable cost of production per unit, and G is the amount of money received as government payments or subsidies for producing that crop. Estimates of the total price (P) received by the farmer are based on estimates of future market prices for the year 2005 through 2014. Estimates of future prices for the major U.S. crops are published by the Food and Agriculture Policy Research Institute (FAPRI). The mean of the actual and projected prices for the years 2005-2014 are used as the price in the opportunity cost calculations for this analysis. An alternative method would be to us the mean price for each crop and the standard deviation to define a normal distribution of prices from which prices are drawn randomly in a Monte Carlo-type analysis. The costs of production for each of the major crops in each county are calculated by multiplying the reported average yield for the crop by the variable costs of production. It is important to note that the costs of production used in this analysis represent the variable costs and do not include the fixed costs of production. As such, this provides a more accurate depiction of the decision landowners will face when considering carbon projects for two reasons. First, landowners will most often be considering carbon projects on some, but not all their land. In this case, they will still have the machinery necessary for crop production and will incur fixed costs for this despite converting some land to carbon production. Second, the costs associated with owning the land will continue to be incurred regardless of the decision to undertake carbon projects. Therefore, as stated above, the profit or opportunity costs estimated in this analysis represent income over variable costs. The variable costs of production for each of the major crops are taken from the enterprise budgets prepared by the extension specialists for each crop. The yield used for each crop in each county is the average of the reported county yields for the years 2000 through 2004. As mentioned above, these data come from the USDA-NASS database. The county-specific yields Winrock International_PIER-EA Final Reports (May 17, 2007)
27 of 95
for each crop generate the variability in estimated profitability associated with crop production across the state. For most of the major Washington crops included in this analysis, wheat and hay, government payments (G) are applicable only to wheat. For wheat, like other subsidized crops, G consists of up to three components. These are loan deficiency payments received per unit of production, counter-cyclical payments per unit of production, and direct payments per area of production. The loan deficiency payment and counter-cyclical payment are conditional based on the price received for the crop. The direct payment is received regardless of price or yield. The standard formulae for calculating each of the government payments and the total G are applied in this analysis. Any given area of cropland is likely to have a rotation of crops produced on it over a number of years for agronomic and economic reasons. This analysis has used USDA-NASS data on planted area for each crop in each county to calculate the average percentage of hectares planted to both wheat and hay from 2000-2004. This average for each county is used to estimate a weighted average profitability for crop production in each county. By using county-specific yield and area data, combined with prices and per unit costs that are constant across the region, this analysis is able to produce relatively specific estimates of opportunity costs with a simplified and replicable analytical framework. The profitability (i.e. opportunity cost) estimates for each crop in each county are then weighted by the average percentage of cropland planted to each crop in each county from 2000 through 2004. This averaging process is necessary to account for the frequency of crop rotations on agricultural land. Each county then ends up with a unique opportunity cost for foregoing crop production for afforestation. This estimated opportunity cost could be viewed as the minimum amount necessary to induce landowners to afforest agricultural land. However, the reduced risk associated with a carbon contract relative to the various risks inherent in agricultural production could make this estimated opportunity cost greater than the minimum amount necessary for more risk-averse land owners to pursue carbon projects. A risk aversion factor is built in to this analysis for use if and when quantitative information on risk aversion becomes available. Added to the opportunity cost are the costs of converting the land to trees, managing the land for afforestation, and measuring and monitoring carbon production on that land as was done for rangelands and described above. Finally, a present value analysis is performed using the same time intervals and discount rates as for rangelands described above. The results of this analysis, in terms of present value of the total costs for afforesting crop lands in Washington, are shown in Table 2-6.
Winrock International_PIER-EA Final Reports (May 17, 2007)
28 of 95
Table 2-6. Present value of the total costs for afforesting crop lands in Washington after different time intervals. Mean Median Minimum Maximum
20 years $2,612 $2,439 $1,961 $3,486
40 years $3,226 $2,974 $2,278 $4,498
80 years $3,629 $3,324 $2,484 $5,167
2.3 Results: carbon supply for rangelands and croplands 2.3.1 Carbon sequestration potential Based on the analyses of carbon sequestration potential and productivity across suitability and Holdridge Life Zone classes, carbon sequestration grids were derived for all rangelands and croplands. On candidate areas, new grids of additional carbon that could be sequestered were obtained by subtracting the current carbon stocks (Table 2-3) from the potential carbon stocks after different time intervals (Table 2-2). The amount of carbon sequestered at any of the time intervals is always lower in the drier east side of the state than in the moister west side (Figures 2-9 and 2-10). Even after 80 years, the maximum carbon stocks that can be attained by afforestation of rangelands and croplands in the eastern part of the state range between 50 to 100 t C/ha. In contrast, this value is attained within 20 years on lands in the western, more humid part of the state.
Winrock International_PIER-EA Final Reports (May 17, 2007)
29 of 95
Figure 2-9. Carbon sequestration potential from afforestation with native species on suitable rangelands in Washington.
Winrock International_PIER-EA Final Reports (May 17, 2007)
30 of 95
Figure 2-10. Carbon sequestration potential from afforestation with native species on suitable crop lands in Washington.
2.3.2
Total present value of costs
The total costs in $/ha, for afforesting rangelands and croplands are mapped in Figures 2-11 and 2-12. The present value of the costs increases through time. Common costs on rangelands tend to be less than $1,600/ha through the 40-year period, but then remain generally below $2,000/ha up to 80 years (Figure 2-11).
Winrock International_PIER-EA Final Reports (May 17, 2007)
31 of 95
Figure 2-11. The present value of the total cost ($/ha) to afforest candidate rangelands.
The present value for costs of sequestration for croplands are considerably higher than for rangelands as expected (Figure 2-12). Very few cropland areas have cost of less than $2,000/ha, and much of the cropland has cost in the range of $2,500-$3,500/ha up to 40 years. After 80 years, costs go as high as $4,500-5,000/ha.
Winrock International_PIER-EA Final Reports (May 17, 2007)
32 of 95
Figure 2-12. The present value of the total cost ($/ha) to afforest candidate croplands.
2.3.3
Carbon supply for afforestation of range and crop lands
Figures 2-13 and 2-14 show the spatial distribution (at 30 m resolution) of the cost per t C for afforesting rangelands and croplands after 20, 40, and 80 years. After 20 years, much of the rangeland available for afforestation supplies carbon at costs of between $20 and $75/t C. The costs per t C decrease through time, so that after 80 years much of the rangeland, especially located towards the western part of the state, could be afforested and supply carbon at costs of less than $10/t C (or $180
Private lands
0
Public lands
Figure 3-3. Distribution of the costs of carbon sequestration for extending rotations 15 years in Washington.
3.3 Conservation of timber land in extended riparian buffers 3.3.1
Methods and analyses
This section examines the potential for riparian zone management to increase carbon sequestration. For this analysis, it is assumed that 200' riparian buffers are required on all timberland in Washington. The costs of excluding currently mature timber from harvesting for Winrock International_PIER-EA Final Reports (May 17, 2007)
52 of 95
the indefinite future are estimated. This means that the new riparian zones are treated as setasides, and only economically mature timber at the current time are considered. The potential carbon sequestration associated with setting aside timberland can be seen through Figure 3-4 below. The figure presents the carbon situation for a riparian zone set-aside (red line) versus harvesting that stand in the same rotation period indefinitely (blue line). For a stand that is initially near the rotation age of 47 years, if the stand is set aside, carbon accumulates along the red line from the year of the set-aside forward. If the stand is harvested, some carbon is stored in wood products and some is emitted initially. Over the entire time period analyzed , the set-aside stand holds more carbon than is held by the harvested stand. Although storage occurs in wood products, holding stands in set-asides appears to sequester more carbon in the long-run than harvesting forests – at least for these relatively productive Douglas Fir stands in Washington. In this analysis, the carbon is discounted, such that early carbon gains are more valuable than future carbon gains. Thus, the set-aside stand holds more "present value" carbon than the harvested stand, even though these stands have similar average carbon storage in the longer run (i.e., > 400 years). The set-aside stand shown in Figure 3-4 is estimated to hold approximately 89 t of "present value" carbon.
350 300
Tons C/ha
250 200 150 Set-aside
100
Baseline Rotation
50 0 1
101
201
301
401
501
601
701
801
Year
Figure 3-4. Tons carbon per hectare stored in above-ground biomass and products for the baseline (blue) and set-aside (red) for high site Douglas fir stands in Washington region 1.
Table 3-9 presents estimates of the tons of carbon gained and the costs for riparian zone protection in Washington. These estimates assume that the land would otherwise be harvested at economically optional rotation ages, and they assume that the harvests would occur in the Winrock International_PIER-EA Final Reports (May 17, 2007)
53 of 95
relatively near future (i.e. the next 5 – 10 years). Carbon gains depend only on the site class, and thus are the same for each region (assuming the same site classes). The estimates of costs, however, differ due to differences in stumpage prices estimated for the different regions. Table 3-9. Net carbon sequestered and costs in $ per ton for setting aside mature forests in riparian zones in Washington.
T C per hectare
$ per t C
All Regions
Region 1
Region 2
Region 4
Douglas Fir Hi
89.2
$130
$148
$115
Douglas Fir Med
69.6
$154
$175
$129
Douglas Fir Low
44.0
$99
$113
$83
Pond. Pine Hi
28.7
$114
$119
$156
Pond. Pine Med
20.5
$111
$116
$153
Fir/Spruce Hi/Med
28.1
$99
$100
$98
Fir/Spruce Low
35.7
$102
$110
$101
Hem/Sp Med
57.0
$238
$306
$239
Hem/Sp Med
62.0
$164
$211
$165
Hem/Sp Low
45.3
$127
$164
$127
Lodgepole
26.0
$59
$77
$62
Red Alder
25.3
$64
$66
$62
The total costs per hectare of setting aside timberland are estimated as the current stumpage value of mature timber on each hectare, assuming the timber is near the optimal rotation age, plus the present value of bare land. These estimates provide a lower bound estimate of what it would cost individuals interested in purchasing set-asides to negotiate with landowners for the rights to hold the timber on the land indefinitely, for example through a conservation easement. The costs per ton are estimated by dividing total tons gained into the total costs. It is also useful to estimate how much land is available in riparian areas for protection. To accomplish this, stream lengths through different types of land uses in each county in the two states were estimated. The stream lengths through forested areas were extracted from these data, and used to estimate the total area of land in a set-aside encompassing an additional 100 Winrock International_PIER-EA Final Reports (May 17, 2007)
54 of 95
feet of land on each side of the stream. The data included information on the types of forests, allowing us to attach the economic value and carbon sequestration estimates from the tables above directly to specific stream segments. The estimates of costs and carbon sequestration assume that land is currently of merchantable age, however, the riparian area data did not distinguish age classes. It was therefore assumed that the riparian zones have the same distribution of age classes as the rest of forests in each county. Thus, the total stream length within in each county was adjusted to reflect the proportion in the county that is merchantable, according to the USDA Forest Service FIA data.
3.3.2
Results: marginal costs of carbon conservation in riparian buffers
The results of the analysis of potential costs of sequestering carbon through riparian zone setasides are shown in Table 3-10. Currently, it is estimated that there are 14,119 hectares of mature forests in riparian zones within Washington. If these areas were set-aside, the estimated costs would be approximately $5,268 per hectare, or $74.4 million in total. Approximately 610,000 t C could be sequestered with this action, for an average cost of $122 per t C. The distribution of costs by county is shown in Figure 3-5. As with holding timber longer than optimal rotation periods, costs tend to be lower in counties on the east-side of the Cascades due to lower overall site values, lower productivity and thus lower opportunity costs of not harvesting the timber. Table 3-10. Estimated total area of riparian zones and total cost of protecting currently mature areas in Washington.
Washington Riparian Stream lengths (million meters)
23.2
Total Potential Area (hectares)
141,469
Mature Potential Area (hectares)
14,119
Total Carbon (million tons)
0.61
Total Cost (million $)
$74.4
Average Cost per ton ($/t C)
$122.33
Average Cost per hectare ($/ hectare)
$5,268
Winrock International_PIER-EA Final Reports (May 17, 2007)
55 of 95
< $90.00 $90 - $100 $100 - $110 $110 - $120 $120 - $130 $130 - $140 $140 - $150 $150 - $160 $160 - $170 > $170 0
Figure 3-5. Costs of sequestering carbon in $/t C through expanding riparian zones in Washington.
4 Fuel load reduction on wildfire-prone areas 4.1 Introduction Fires have a significant effect on carbon stocks in forests. Fire management techniques that reduce carbon emissions by reducing the risk of wildfire through removal of biomass fuels potentially offer an opportunity to reduce emissions and thus supply carbon credits. Not only would reductions in catastrophic forest fires reduce carbon and non-CO2 GHG emissions from burning, but the use of the biomass to generate electricity would offset emissions from fossil fuel-generated energy. The objective of this section is to produce a first-order approximation of the areas and carbon stocks of forests suitable for fuel reduction to reduce their fire risk, and their location relative to existing power plants.
4.1.1
Magnitude of the problem
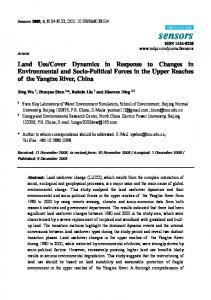
The last century has seen the transformation of many western forest ecosystems from relatively open, healthy forests in which periodic low-intensity ground fire played an important ecosystem function, to densely stocked, fire-prone forests in which catastrophic crown fires burn hundreds of thousands of acres each fire season. This has resulted in escalating fire suppression budgets, loss of timber, wildlife, recreational and ecosystem values, lost property values, skyrocketing insurance costs, and loss of life. Fires appear to be increasing in size and intensity, resulting in greater losses of forest area and billions of tax dollars spent each year for fire control. As reported by the National Interagency Fire Center, 103,387 fires consumed 4.5 million acres in 1960; by the year 2000, 122,827 fires burned almost twice as much—8.4 million acres—while federal expenditures rose from $845 million in 1994 to $1.7 billion in 2002 (Figure 4-1).
Winrock International_PIER-EA Final Reports (May 17, 2007)
56 of 95
Fire Suppression Costs For U.S. Federal Agencies, 1994 to 2002 1,800
1,661
Millions of Dollars
1,600 1,362
1,400 1,200 1,000
918
845 800
679 523
600 340
400
256
329
200 0 1994
1995
1996
1997
1998
1999
2000
2001
2002
Time
Figure 4-1. National Interagency Fire Center statistics showing federal expenditures in millions of dollars from 1994 to 2002.
The USDA Forest Service (USFS) in 1937 adopted policy of “fast, energetic and thorough suppression of all fires in all locations” (Chase 1989). A more recent scientific consensus suggests that low-intensity ground fire played a natural and important role in many Western forest ecosystems (e.g. Schoennagel et al 2004). Instead of having a healthy fire return interval of 15 or 20 years depending on forest type, a combination of logging, fire suppression and other factors have altered fire regimes and resulted in a fundamentally different forest landscape in which accumulated woody fuels create conditions for infrequent but intense and large-scale fires that can permanently alter ecosystems (Pyne et al 1996). This has led to a debate among landowners and public land managers about how to manage fire across boundaries, and how to return natural low-intensity fire to these forest ecosystems – starting from a present condition of accumulated fuels that makes it impossible simply to forego fire suppression, let fires burn, or introduce prescribed fire without first undertaking treatments to reduce fuel loads. A national consensus is beginning to develop among government, industry, community and environmental stakeholders that something must be done to reduce fuel loads and return forests to more natural fire regimes; nonetheless, the problem is complex and the barriers to a large-scale solution are political, administrative, environmental, and perhaps most significantly economic. The necessary fuel reduction treatments tend to be labor-intensive and very costly, the value of the material removed relatively low, and agency budgets to pay for treatment increasingly constrained. Creative utilization strategies for understory biomass and smalldiameter timber are needed, together with a broad portfolio of approaches and sources of revenue to offset the costs of fuel treatment. A recent assessment of forests across 15 Western states, conducted under the auspices of the National Fire Plan, found that approximately 67 million acres are at moderate to high risk of
Winrock International_PIER-EA Final Reports (May 17, 2007)
57 of 95
wildfire (Fire Regime Condition Class 2 and 3) and 28 million acres at the highest risk level 2 (FRCC 3) . These figures include only those acres considered accessible for some type of treatment to reduce hazardous fuels. The 28 million acres in FRCC 3 could yield 345 million bone dry tons (BDT) in removals, with the greater proportion (70%) of the volume in larger diameter classes (over 7” considered merchantable sawtimber), but the greater number of stems in the < 7” submerchantable biomass category (USDA Forest Service Research & Development/Western Forestry Leadership Coalition 2003). This hints at both the scale of the wildfire risk/hazardous fuels problem in the West, and one of the key economic barriers: a huge quantity of submerchantable material requiring treatment and/or removal to reduce fire risk, but constituting relatively little volume or value to pay the high cost of handling such a large number of stems. In Washington alone, 8.5 million acres in FRCC 2 and 3 require hazardous fuel reduction and would yield an estimated 242 million BDT, of which 2.5 million acres are in FRCC 3 and would yield an estimated 63 million BDT (USDA Forest Service Research & Development/Western Forestry Leadership Coalition 2003).
4.1.2
Approach and analysis of hazardous fuel reduction treatments
A range of potential hazardous fuel reduction (HFR) treatments and technologies is available to address the fire risk problem. Prescribed fire is a relatively low-cost way to reduce fuel loading and ultimately perhaps the preferred treatment if the goal is to reintroduce fire into forest ecosystems. Prescribed fire is fairly constrained in its use today because of the potential for fire escape (especially at the wildland-urban interface), relatively short windows of appropriate conditions, and air quality and sediment yield concerns. Indeed, to treat FRCC 3 forest lands, prescribed fire is probably an option only following some mechanical treatment to reduce fuel loads (USDA Forest Service Research & Development/Western Forestry Leadership Coalition 2003). One could envision a range of available HFR treatments, each with different constraints, costs, yield of merchantable and submerchantable material and thus revenues, air quality impacts, ground impacts, and greenhouse gas emission impacts (Figure 4-2, Table 4-1).
2
Fire Regime Condition Class (FRCC) is a measure of how much a forest has departed from natural wildland fire conditions (Schmidt et al 2002). The fire regime in Class 2 areas is moderately altered from the historical range; moderate levels of restoration treatments such as fire or mechanical treatments would be required to begin managing a more natural fire cycle. In Class 3 areas, fire regimes have been significantly altered and there is a high risk of losing key ecosystem components in a wildfire. Due to high fuel loadings, mechanical treatments are expected to be needed before the reintroduction of fire (USDA Forest Service Research & Development/Western Forestry Leadership Coalition 2003).
Winrock International_PIER-EA Final Reports (May 17, 2007)
58 of 95
Felling
Roadside burn
Pile burn
Rx fire
Bunching/piling
Removal from site
Submerchant able
Chip
Merchantable
Preliminary processing
Mastication
Biomass energy “CSCH” generation
Haul
Haul
Value-added (primary and secondary) processing
Figure 4-2. Schematic of potential HFR treatments (adapted from USDA Forest Service Research & Development/Western Forestry Leadership Coalition 2003). Table 4-1. Benefits, constraints and representative costs for HFR treatments.
Hazardous fuels reduction treatment
Product yield
Benefits
Constraints
Representative costs
Rx fire
No
Less expensive, re-introduces fire
Air quality, ground impacts, fire escape (WUI), seasonal restrictions, immediate CO2 emissions to atmosphere
$35-300/acre, 3 average $92/acre $23-223/acre4
Masticate – leave on site
No
Efficient, useful for less accessible sites where fuel removal not a goal
Leaves fuel on site, gradual CO2 emissions to atmosphere
$100-1,000/acre
Cut-pile-burn
No
Less expensive, can be used on inaccessible or steep sites
Leaves fuel on site, air quality, immediate CO2 emissions to atmosphere
$100-750/acre
Cut-lop-scatter
No
Less expensive, can be used on inaccessible or
Leaves fuel on site, gradual CO2 emissions
$105-280/acre5
3
USDA Forest Service Research & Development/Western Forestry Leadership Coalition, 2003.
4
Chalmers and Hartsough, no date.
Winrock International_PIER-EA Final Reports (May 17, 2007)
59 of 95
2
2
Cable yarding for biomass removal
Yes
Cut-skid-chip-haul Yes (for submerchantable biomass)
“CSCH”
Cut-skid-processload-haul (for merchantable)
Yes
steep sites
to atmosphere
Makes less accessible or steeper sites treatable
Expensive, ground impacts
$80-130/CCF
Removes fuel from site; some product value to offset costs; allows renewable energy generation; greatest CO2 benefit
More expensive; limited to gentler slopes, areas closer to roads for removal, limited haul distance to biomass plant
$34-48/BDT + haul cost 1 $0.35/BDT.mile
Greatest product value to offset costs; removal of merchantable material may be necessary to reduce fire risk (Crowning Index) and meet spacing or forest health goals
More expensive; limited to gentler slopes, areas closer to roads for removal, limited haul distance to processing facility; environmental controversy/frequent litigation
Variable
4
$560-1,634/acre6
The present analysis is confined to a single HFR treatment – cut-skid-chip-haul, or “CSCH” because this appears to be the practical way to remove fuel from the forest while at the same time being available for transportation to a biomass energy power plant. We attempt to estimate the total area of Washington forest lands at moderate and high fire risk, how much of this area meets a series of constraints making it feasible to treat using CSCH, how much biomass could be removed from this area using CSCH and be available to existing biomass power plants, and what might be the economics of using CSCH on those forested acres. Thus the focus is primarily on submerchantable biomass, and the use of forest fuels for generating heat and power in biomass energy facilities.
5
Fight et al. 2004, Barbour et al 2004.
6
Fried et al 2003.
Winrock International_PIER-EA Final Reports (May 17, 2007)
60 of 95
The approach chosen here is necessarily a simplification of the reality of HFR as practiced today, in which a variety of treatments can be applied for different locations, terrain, slope or other conditions. Perhaps most importantly, most HFR prescriptions call for a mix of submerchantable and merchantable material removal, both for economic reasons and to target a desired future forest condition that is defined in terms of residual spacing or basal area, residual fuel loading, reduced ladder fuels to prevent ground fires from moving into the crown, and reduced crown density or crown-touching to prevent crown fires from being sustained or spreading over long distances (Fried et al 2003). While diameter limits are sometimes applied, it is rarely appropriate to exclude all merchantable material to meet these desired future conditions. Accordingly, different treatment types, technologies, and product yield mean different economics of HFR and different types of sites that become treatable either in technical terms (e.g. treatments available for steep slopes) or in economic terms (e.g. treatments that yield more merchantable material, offsetting costs and allowing the contractor to remove more submerchantable biomass to reduce ladder fuels or treat lands on the margin of the maximum haul distance from a biomass energy facility). There is a large literature focused on the economics of different treatments, models to estimate costs of treatment (STHARVEST and others), and models to estimate quantities of biomass available from a given area or the best locations to site biomass energy facilities (FIA Biosum, Coordinated Resource Offering Protocol, and others) (Fight et al 2003, 2004; Fried, Barbour and Fight 2003; Fried et al 2002, 2003; Barbour et al 2001, 2004; Christensen et al 2002; Chalmers and Hartsough, no date; Mater 2005).
4.1.3
Objectives
The four primary objectives of this study are: 1) Identify areas of forestland in the state with moderate to high fire risk. 2) Conduct a multi-criteria evaluation to identify forestlands suitable for fuel removal. This analysis assigned a Suitability for Potential Fuel Reduction (SPFR) score to all forested areas, based on criteria affecting the feasibility of treating these lands, removing and transporting fuels for biomass energy generation. 3) Conduct more detailed analysis of one potential HFR treatment, “Cut-Skid-Chip-Haul,” and assess the area of moderate to high fire risk forestlands in the state to which this treatment could be applied, how much biomass fuel this might generate for use in power plants, and at what cost. 4) Identify areas of low-elevation ponderosa pine and mid-elevation mixed coniferous forests that could be treated for fuel reduction with “Cut-Skid-Chip-Haul” to mitigate potential extreme fire behavior and to restore these forests to their historical fire regime.
4.2 Results: forested land at moderate to high fire risk The first step in this analysis was to identify forest areas at moderate to high risk of fire that were suitable for fuel removal to reduce that risk. Forested areas were extracted from the Washington GAP analysis layer (USGS, GAP Analysis Program 2005). There were fifteen forest types recognized in the GAP dataset, dominated by mixed mesic coniferous forest, mesic Douglas-fir and ponderosa pine forests (Table 4-2). Winrock International_PIER-EA Final Reports (May 17, 2007)
61 of 95
Table 4-2. Distribution of forest area (ha) by forest type.
Forest type
Northwest Regional GAP Analysis category
Mixed Mesic
Mixed Mesic Coniferous Forest
Area (ha) statewide 3,088,400
Mesic Mixed Forest
652,500
Mesic Mixed Forest
652,500
Deciduous Forested Riparian
321,500
Mixed Riparian
68,600
Coniferous Forested Riparian
4,800
Douglas fir
Mesic Douglas-fir
1,301,500
Ponderosa Pine
Ponderosa Pine
1,108,900
Subalpine
Mixed Subalpine Coniferous Subalpine Fir
Mixed Xeric
620,600 20,400
Xeric Douglas-fir
283,900
Mixed Xeric Coniferous
236,400
Xeric Mixed
106,400
Xeric Deciduous Mixed Coastal
Mixed Coastal
Mesic Deciduous
Mesic Deciduous
32,300 172,300 66,700
A map of all forest types across the state, called “Forest,” was created and used to separate forests at moderate and high wildfire risk (Figure 4-3). In the next step, a fuel characteristic class system (FCCS) GIS layer (pixels of 1 km x 1 km resolution), developed by the Fire and Environmental Research Applications team (FERA) of the USDA Forest Service - Pacific Northwest Research Station - Pacific Wildland Fire Sciences Laboratory, was used to identify fuel-beds that have moderate and high fire behavior potential and are at high wildfire risk. The FCCS layer represented physical properties of wildland fuelbeds and associated fuel characteristics and fire potential indexes. The three-digit FCCS Fire Potential code, based on three key attributes (scaled from 0-9) of fire behavior, crowning and available fuel potential, was used to rank the fuelbeds for fire hazard. For example, a fuelbed with a FCCS Fire Potential code of 743 means that the potential for fire intensity or spread rate is above average (7), potential for crown fire is below average (4), and potential for available Winrock International_PIER-EA Final Reports (May 17, 2007)
62 of 95
fuel consumption is below average (3) (Sandberg at al 2001; Ottmar at al 2003; Sandberg 2003). Fuelbeds were ranked according Fire Behavior Potential (FBP) into three classes: low (0 -3), moderate (4-6) and high (7-9) (Roger Ottmar, Pacific Wildland Fire Science Laboratory USDA Forest Service PNW Research Station, pers comm. 9/13/05). A new map was generated called “Fire Risk Rank,” and was combined with the “Forest” map to produce a map showing Washington forestlands at moderate and high wildfire risk (Figure 4-3).
Figure 4-3. Distribution of Washington’s forests at moderate and high risk for wildfires.
4.3 Results: suitability for potential fuel reduction A multi-criteria evaluation was conducted to identify forestlands suitable for fuel removal. Three factor maps were used in the decision support tool for a Multi-Criteria Evaluation module (MCE): distance from roads, distance from power plants, and slope. The analysis was constrained to a radius of 50 miles from existing power plants, representing a general rule-ofthumb for maximum hauling distance for low-value biomass fuel. These factor maps were combined to create a single raster map showing Suitability for Potential Fuel Removal (SPFR) scores.
Winrock International_PIER-EA Final Reports (May 17, 2007)
63 of 95
The first factor analyzed was distance from roads. A road layer for the Census 2000 TIGER Line was downloaded from the ESRI Data Disclaimer web site, including all major state, interstate highways and local roads statewide. Also, a railroad layer at scale 1:24,000 was downloaded from Washington State Department of Transportation (WSDOT 2005). Both transportation layers were combined to create a layer representing all roads. The Euclidean distance module in ArcView was used to create a distance map from the linear features of all roads. This map was standardized into a range from 0 to 255 using the “FUZZY” module in GIS software Idrisi Kilimanjaro (Eastman 2003), so that the starting point for most suitable areas was 100 meters away from the roads to avoid a risk of fire close to roads. The greatest travel distance to reach a road was assigned the lowest suitability score (0), and the least travel distance the highest suitability score (255), indicating that as yarding distance increases, cost of removal increases and suitability for fuel removal thus decreases (Figure 4-4). The second factor analyzed was slope. A slope map in degrees at 1,000 m resolution (same resolution as the FCCS layer) for the state of Washington was derived from a 30m DEM. Slope ranges between 0.0and 32.30 degrees for the state of Washington, and was standardized with a fuzzy classifier to range of 0 to 255, with 255 representing the gentlest slope (easiest access and least ground impact from fuel removal, thus most suitable) and 0 the steepest slope (least suitable) (Figure 4-4). The third factor analyzed was distance from existing power plants. Locations of electricity generating facilities within the state of Washington with greater than 0 MWh annual biomass/wood net generation in 2000 were obtained from the Emissions & Generation Resource Integrated Database (U.S. Environmental Protection Agency, 2003). A point file was created using the latitude and longitude information for each plant, then the Euclidean distance module in ArcView was used to create a distance map from the point locations of electricity generating plants. The distance map was standardized to a scale of 0 to 255, with the greatest travel distance to reach a power plant assigned the lowest suitability score (0) and the least travel distance the highest suitability score (255), indicating that as the distance to the nearest power plant increases, cost of hauling fuel increases and suitability for fuel removal thus decreases (Figure 4-4). All three factor maps were used as inputs for the MCE module, a GIS decision making tool in Idrisi Kilimanjaro software. The output of this module was a SPFR score map on a standard scale from 0 to 255, where 0 represents the least suitable areas and 255 the most suitable areas for potential fuel reduction accounting for distance to roads, slope and distance to power plants (Figure 4-4).
Winrock International_PIER-EA Final Reports (May 17, 2007)
64 of 95
Figure 4-4. Suitability for Potential Fuel Removal (SPFR) scores for Washington, with highest suitability assigned to areas close to roads, on gentle slopes, and close to existing power plants.
The range of the SPFR scores for the “Fire Risk Forest”, locations of the existing eight power plants in Washington and the buffer zone of 50 miles around them, are shown in Figure 4-5. The SPFR scores for Washington forests at moderate and high wildfire risk indicated the suitability for treating these forestlands, removing and transporting the fuels to biomass energy generation facility, based on three factors: distance from roads, slope and maximum distance of 50 miles from power plants. The highest suitability is assigned to forest close to roads and power plants, and on gentle slopes.
Winrock International_PIER-EA Final Reports (May 17, 2007)
65 of 95
Figure 4-5. Suitability for Potential Fuel Reduction (SPFR) scores for Washington forest lands at moderate and high risk of wildfire, and within 50 miles of existing power plants.
The forest types that dominate in different ranges of SPFR scores were examined. A histogram of the area of forests shows few areas of forest in the lowest SPFR classes (less than 80), with the area of forest gradually increasing until reaching its peak at SPFR = 171, then slowly declining through the rest of the SPFR classes (Figure 4-6). SPFR scores for the forests at risk of wildfire range from 7 to 255. The fifteen forest categories according to the Northwest Regional Gap Analysis classification system were categorized into the ten forest types shown in Table 4-2. Seven of these forest types were represented in the “Fire Risk Forest” map, with the predominant forest type across all SPFR scores being mixed mesic forest. Sub-alpine forests are present at lower SPFR scores, but dwindle to a relatively small proportion of the area in the higher SPFR classes. Mesic Douglas fir, in contrast, increases in the higher SPFR classes. There is minor representation of the Ponderosa pine forest type for SPFR scores above 85 and of mesic deciduous forest above 95. The rest of the forest types are represented in relatively small proportions through the whole range of the SPFR scores (Figure 4-7).
Winrock International_PIER-EA Final Reports (May 17, 2007)
66 of 95
180,000 160,000 140,000
Area (ha)
120,000 100,000 80,000 60,000 40,000 20,000 0 242
227
212
197
182
167
152
137
122
107
92
77
62
47
31
7
SPFR score
Figure 4-6. Forests at moderate and high risk for wildfires per SPFR classes.
100%
Forest type
80%
60%
40%
20%
0% 252 247 242 237 232 227 222 217 212 207 202 197 192 187 182 177 172 167 162 157 152 147 142 137 132 127 122 117 112 107 102 97 92 87 82 77 72 67 62 57 52 47 42 37 31 26 15 7 SPRF score
Mixed Mesic forest
Sualpine forest
Mixed Xeric forest
Mixed Coastal forest
Mesic deciduous forest
Ponderosa Pine
Mesic Douglas Fir
Figure 4-7. Forest types at moderate and high risk for wildfires per SPFR class.
Winrock International_PIER-EA Final Reports (May 17, 2007)
67 of 95
4.4 Results: moderate to high-risk forests treatable with CSCH 4.4.1
Estimated biomass yield
In the third component of this analysis, we looked in more detail at one potential hazardous fuels treatment, “Cut-Skid-Chip-Haul” (CSCH), a treatment in which hazardous fuel is harvested in the woods, bunched and skidded to a landing, chipped into a chip van, and hauled to a biomass energy facility for electricity and/or heat generation. The objective was to assess the area of moderate to high fire risk forestlands in the state to which this treatment could be applied, how much biomass fuel this might generate for use in power plants, and at what cost. In this analysis, the following crucial constraints for CSCH treatment were applied sequentially to identify the area of moderate to high fire risk forest available for CSCH: •
Maximum slope constraint. Assumes only lands of < 40% slope may be treated with CSCH (Fight et al 2003; Fried et al 2002; Fried et al 2003; Fried, Barbour and Fight 2003). Steeper slopes may be treated in other ways (e.g. cut-pile-burn), but do not allow CSCH due to machinery and equipment access, ease of removal, and ground impacts from harvest and skidding.
•
Maximum yarding distance constraint. Assumes only lands within 0.25 miles (400 meters) of existing roads may be treated with CSCH. This is used as a general rule of thumb for the maximum distance low-value material would be skidded to a landing where a chipper and chip van is parked (Bob Rynearson, WM Beaty & Associates, pers comm. September 2005).
•
Maximum haul distance constraint. Assumes only lands within 50 miles of existing power plants may be treated with CSCH due to transport cost. This maximum haul distance may be considerably affected by the volume/value of merchantable material in the prescription, but for a simplified CSCH treatment targeting only low-value submerchantable material, it is assumed that haul distance cannot exceed 50 miles.
•
Minimum block size to justify move-in costs of equipment and personnel. A general rule of thumb is that a treatment block must be at least 80-100 acres to justify move-in costs, although this number may be slightly less if equipment is already sited nearby for another project (Bob Rynearson, WM Beaty & Associates, pers comm. September 2005).
Constraints were applied sequentially so that only lands meeting all constraints were available for CSCH treatment. Forests at moderate and high wildfire risk were superimposed on a slope map and all forestlands of > 40 % slope were excluded (Figure 4-8 A). To meet the requirement of maximum 0.25 miles yarding distance, a buffer layer was created, rasterized and overlaid with the moderate and high fire risk forest on gentle slopes to exclude any lands further than 0.25 miles from roads (Figure 4-8 B). Finally, the constraint map of 50 mile radii from existing power plants was overlaid on the earlier maps to exclude forests beyond this haul distance (Figure 4-8 C). The fourth constraint of minimum block size proved difficult to apply at this stage of the analysis. In theory it would be possible to exclude as uneconomic all lands, meeting the three above constraints, but without sufficient contiguous area to meet a minimum 80- or 100-acre Winrock International_PIER-EA Final Reports (May 17, 2007)
68 of 95
minimum treatment block constraint. However, at the relatively coarse level of resolution of 1 2 km per pixel used in this analysis, a single pixel represented 100 hectares or 247 acres, so it was not possible to exclude blocks of only 80-100 acres.
Figure 4-8. Critical factors to determine forest lands suitable for CSCH fuel treatment: A – Slope less than 40%; B- Yarding distance less than 0.25mi; C- Distance from existing power plants less than 50 miles.
Considering only lands meeting all these constraints, the total area accessible for CSCH across Washington moderate and high fire risk forestlands would be approximately 2.3 million hectares. Available biomass (short tons/acre) for each fuelbed was calculated from the FCCS data set using the available fuel potential index (dimension/scaled) multiplied by 10 (David Sandberg, USDA Forest Service - Pacific Northwest Research Station, pers. comm. August 2005). The available biomass (short tons/acre) was multiplied by 1.016 to convert to metric tons, and 7 then divided by 0.4 to convert to available biomass (BDT/ha) (Figure 4-9). The total biomass stocking, including trees, on Washington forest lands at moderate to high fire risk and accessible for CSCH treatment, would be approximately 855 million BDT (Table 4-3). This value 7
All numbers are reported in hectares. To convert ha to acres, multiply by 2.47. To convert BDT/ha into BDT/acre, multiply by 0.4. Winrock International_PIER-EA Final Reports (May 17, 2007)
69 of 95
represents estimated total biomass stocking in the forests at moderate and high risk of wildfire based on the Fire Behavior Potential index.
Figure 4-9. Available biomass in the CSCH treatable forest.
The total fuel available for removal would be much less than this quantity, as not all biomass on the land will be removed through treatment. Actual percent removal will be highly variable by stand, pre-treatment condition and desired future condition (D. Goehring and D. McCall, PG&E Natural Resources, pers comm. September 2005), making it difficult to assign a percent removal across a broad scale such as a state or region. Over the landscape as a whole, more than 50% removal of the pre-treatment fuel loading may be needed to significantly reduce fire risk (Torching Index and/or Crowning Index; Fried et al. 2002, 2003). Furthermore, more than 50% removal, as a landscape average, is likely to be needed to reach a stand-level residual basal area of 80-125 ft2/acre, often used in HFR prescription scenarios (Fried et al. 2002). A 15-state strategic assessment of fuels reduction assumed a removal prescription of reducing stand density to 30% of maximum Stand Density Index (SDI) for a given stand, or averaged across the landscape, 70% reduction in SDI (USDA Forest Service Research & Development/ Western Forestry Leadership Coalition 2003). Given the uncertainty in fuel available for removal, two scenarios were considered to help understand the relationship between potential fuel removal and the subsequent carbon benefits associated with that removal. The first scenario assumed that regardless of pre-treatment condition and desired future condition of the forest stand, the CSCH will remove 10 BDT biomass per hectare (4 BDT/ac). The second scenario assumed that 20 BDT biomass per hectare (8 BDT/ac) will be removed. Results of these scenarios are presented in Table 4-3. Winrock International_PIER-EA Final Reports (May 17, 2007)
70 of 95
Table 4-3. Available biomass, as bone dry tons, per area (BDT/ha), area (ha), available pre-treatment biomass (BDT) and quantity CSCH treatable biomass (BDT) according to scenario 1 and scenario 2.
Classes available fuel loads
Very High
Available Biomass
Area (ha)
Pre-Treatment
Scenario 1
Scenario 2
biomass (BDT)
10 BDT
20 BDT
CSCH removal
CSCH
(BDT /ha)
removal
457
457,500
209,169,000
4,575,000
9,150,000
455
959,600
436,291,736
9,596,000
19,192,000
High
396
182,700
72,393,048
1,827,000
3,654,000
Moderate
254
259,500
65,913,000
2,595,000
5,190,000
244
84,100
20,506,944
841,000
1,682,000
150
191,100
28,638,246
1,911,000
3,822,000
114
196,800
22,494,240
1,968,000
3,936,000
2,331,300
855,406,214
23,313,000
46,626,000
Low
Total
In the first scenario, biomass of approximately 23 million BDT would be available to biomass energy facilities in Washington from CSCH treatments to reduce fire risk on approximately 2.3 million ha forest lands. This implies an initial loss of forest carbon due to HFR treatment of approximately 11.5 million t C 8 -- although this initial loss is obviously offset by potentially great savings in CO2 and non-CO2 greenhouse gas emissions due to reduction in the probability, severity and extent of wildfire attributable to the HFR treatment. The second scenario results in approximately 47 million BDT available biomass associated with approximately 23.5 million t C initial removals. The total carbon stocks for the Washington forest at moderate and high risk of wildfire is approximately 428 million t C (Table 4-3).
4.4.2
Economic analysis and potential role of carbon emission reduction credits
Costs for CSCH range widely depending on the treatment prescription, presence or absence of merchantable material in the prescription, region of the country, and the factors identified above (slope, yarding distance, haul distance, etc.). Here the values quoted in a recent broadscale strategic assessment covering 15 states and a wide range of experience with HFR were use as a guide: the treatment analogous to CSCH had a cost range of $34-48/BDT (USDA Forest Service Research & Development/Western Forestry Leadership Coalition 2003). Assuming
8
Carbon stocks are calculated as 50% of biomass.
Winrock International_PIER-EA Final Reports (May 17, 2007)
71 of 95
from above that biomass of approximately 23 million BDT would be removed from the forest lands in scenario 1, treating all these forest lands would have a total cost of approximately $792 million (low) to approximately $1.2 billion (high). Treating these forest lands in scenario 2 would have a cost of approximately $1.6 billion (low) to approximately $2.2 billion (high). The value of this biomass for purchase by biomass facilities may be estimated at $36/BDT (Fried et al. 2003), although market prices for fuel will vary somewhat by region depending on the number of biomass plants in operation and thus competition for fuel. For both scenarios, we estimate the amount of revenue that CSCH on the forest lands in question would generate, and/or subsidy required, to remove the available biomass to biomass energy facilities. In the first scenario, with removal of approximately 23 million BDT biomass from Washington forest lands at moderate and high fire risk, the fuel would have a value of approximately $839 million, and thus range from generating a net revenue of approximately $46 million (if value = $36/BDT and cost = $34/BDT), to requiring a total subsidy of approximately $280 million to treat all these lands (if value = $36/BDT and cost = $48/BDT). In the second scenario, with removal of approximately 47 million BDT biomass, the fuel would have a value of approximately $1.7 billion, and thus range from generating a net revenue of approximately $93 million (if value = $36/BDT and cost = $34/BDT), to requiring a total subsidy of approximately $560 million to treat all these lands (if value = $36/BDT and cost = $48/BDT). To attempt to investigate whether removal of hazardous fuel that results in reduced fire intensity and reduced carbon emissions (i.e. conservation of forest carbon stocks) makes economic sense, the following first-order calculations are presented. Assuming the higher costs for biomass removal as described above, to treat the 2.33 million ha estimated to be treatable using CSCH would require a per-hectare subsidy of $120 ($280 million total subsidy divided by 2.33 million ha) for removal of 10 BDT/ha, or $240 ($560 million divided by 2.33 million ha) for removal of 20 BDT/ha. Assuming commonly used prices of CO2, would emissions reductions attributable to HFR activities be sufficient so that the sale of carbon credits from these projects could cover the per-hectare subsidy required? Depending upon the price of carbon assumed (two commonly used values are $2.40/t CO2 and $10/t CO2), the quantity of carbon emissions that would need to be reduced through HFR to cover the per-hectare subsidies needed – essentially, to make high-cost CSCH a break-even activity – varies from as little as about 3 t C/ha to as much as 27 t C/ha (Table 4-4). Whether HFR could produce this order of magnitude of emissions reductions depends on baseline emissions from fires of varying intensities, and whether HFR prior to fire reduces the intensity of fires. In an analysis conducted for this project, the differences between net carbon emissions from medium-intensity fires and low-intensity fires across all forest types in Washington ranged from 8 to 30 t C/ha; the difference in emissions between high-intensity and lowintensity fires ranged from 16 to 80 t C/ha (Brown and Kadyszewski, 2005b). In other words, if HFR resulted in low-intensity forest fires rather than medium-intensity fires, there would be a reduction in carbon emissions attributable to HFR of 8-30 t C/ha; if the reduction was from high-intensity to low-intensity fires, the reduction in emissions would be 16-80 t C/ha. The reduction in emissions attributable to HFR in order to cover the per-hectare subsidies required, Winrock International_PIER-EA Final Reports (May 17, 2007)
72 of 95
3-27 t C/ha, is well within this range for a change from medium- to low-intensity fires, and much lower for a change from high- to low-intensity fires. Thus it appears, in a preliminary analysis, that the order of magnitude in emissions reductions attributable to HFR, assuming commonly used prices for carbon offsets, is within the realm of practicality to cover subsidies needed for HFR – adding support to the argument for qualifying fuel reduction activities as carbon offset projects. It should be emphasized that this preliminary analysis needs further research and discussion, including collection of additional data on emissions from wildfires of varying severity, and what reductions in fire severity and/or emissions should be attributable to pre-fire HFR treatment. Table 4-4. Quantity of CO2 emissions reductions (t CO2/ha and t C/ha) that would need to be produced by HFR activities in order to cover estimated per-hectare subsidies needed for CSCH.
Subsidy
$2.4/t CO2
$10/t CO2
t CO2/ha
t C/ha
t CO2/ha
t C/ha
$120/ha
50
14
12
3.3
$242/ha
100
27
24
6.5
4.5 Analysis of low-severity and mixed-severity fire regime forests treatable with CSCH The fourth component of this analysis addressed fire risk issues in the forest lands that are designated with low-severity and mixed-severity fire regimes. Decades of fire suppression practices, resulting in unnatural fuel accumulation and severe wildfire in western forests, are particularly associated with the dry ponderosa pine forest type (Schoennagel et al. 2004). According to Schoennagel et al., dry ponderosa pine forests are in urgent need of ecological restoration and fire mitigation. Historically, frequent and low-intensity fire maintained open stands in low-elevation ponderosa pine; the surface fuel layer, dominated by grasses and needles, usually dries easily, resulting in frequent low-intensity surface fires. Disturbing this historical fire regime in these forests through fire suppression has resulted in build-up of ladder fuels at intermediate heights that carry ground fires into the crown, where they can lead to large, catastrophic fires. Mixed-severity fire regimes occur mostly at mid elevation, in forest stands with variable tree species and densities defined as mixed conifer forests. For these forests accumulated fuel and climate affect the frequency, severity and size of fires. The impact of suppression practices on fuel loads in these forests varies depending on the tree composition of the forest stand. To restore historical stand structure of ponderosa pine and mixed conifer forests, mechanical HFR treatments are recommended. For this part of the analysis, forest areas with low-severity and mixed-severity regimes that need CSCH treatment were identified based on a re-classification of the Washington GAP’s classification used above. Two forest categories were recognized from the GAP analysis data: ponderosa pine forest and mixed xeric coniferous forest (Figure 4-10). The fire risk rank map derived from the FCCS data set was not considered in this part of the analysis because a large part of the ponderosa pine and mixed xeric coniferous forests were ranked as a low-risk Winrock International_PIER-EA Final Reports (May 17, 2007)
73 of 95
category. Another reason for excluding the FCCS data from this part of the analysis was inconsistency of non-forest area (such as development and agriculture) in FCCS and Washington GAP data sets. The total area of the ponderosa pine and mixed xeric forests in Washington was estimated at approximately 1.3 million hectares. As above, applying the sequential factors of slope, yarding distance and 50-mile radius from existing power plants to these forest lands resulted in an estimate of approximately 495 thousand hectares of dry ponderosa pine and mixed xeric forests that would be available for CSCH treatment (Figure 4-10). How much biomass fuel would need to be removed to restore the historical stand structure and fire regime in the dry ponderosa pine and mixed xeric coniferous forests is unknown at this time and will be pursued in phase 2 of this work.
Figure 4-10. Critical factors to determine forest lands with low-severity and mixed-severity fire regimes, suitable for CSCH fuel treatment: A – Ponderosa pine and mixed xeric coniferous forest in Washington state; B – Slope less than 40%; C- Yarding distance less than 0.25mi; D- Distance from existing power plants less than 50 miles. Winrock International_PIER-EA Final Reports (May 17, 2007)
74 of 95
5. Next steps This report has presented the results of carbon supply analyses for several potential activities in Washington: afforestation of rangelands, afforestation of crop lands, changes in forest management including extending rotations and widening riparian buffers, and hazardous fuel reduction to reduce emissions from wildfire in fire-prone forest ecosystems. The final section outlines further characterization work that is needed, both to refine these analyses and to evaluate additional carbon sequestration opportunities for the state and region. The focus is on refinements to the analysis of fuel load reduction, and on afforestation using fast-growing species such as hybrid poplar as a means to sequester carbon and/or provide fuel for biomass energy generation.
5.1 Refinements to the analysis of carbon supply from fuel load reduction The preliminary analysis presented in Section 4 highlights needs for further research, policy discussion, and consensus-building among the diverse stakeholders with an interest in forests and fire. Further research and analysis is needed, particularly in the following two areas.
5.1.1 Refinement #1: Analysis of other HFR treatment types In reality a much greater range of treatment types than only CSCH (as used in this report) is available for fuel reduction and/or removal. Each treatment type has its own ideal conditions for use, constraints on use, costs, product yield and thus revenue to offset costs, and environmental (air quality, sedimentary, and greenhouse gas emission) implications. Some treatments leave the fuel on site or simply change its form, but may be applied on sites that are relatively more inaccessible either from a technical (terrain, slope, distance to roads) or economic (hauling distance) point of view. Thus a more comprehensive model is needed to answer the questions: •
What factors in addition to slope, yarding distance, distance to biomass plants determine the choice of treatment type and technology—minimum size of treatment block to justify move-in costs, mix of diameter classes to be removed, volume and number of stems in the submerchantable and merchantable categories, distance to processing facilities for merchantable material, other factors?
•
What is an appropriate decision rule for each factor? In treating the slope factor, this analysis assumed CSCH could be applied on slopes < 40%. An analysis based on meeting constraints ignores the other side of each decision rule: excluding lands of > 40% slope or > 0.25 miles yarding distance only means these lands are not available for CSCH, not that they are excluded from all HFR treatment. On slopes > 40% or at greater distance from roads, other treatments might be available that leave fuel on site but still reduce fire hazard (cut-pile-burn, cut-lop-scatter, prescribed fire etc.).
•
What are commonly accepted cost ranges for each treatment type and technology, in $/acre or $/bone dry ton (BDT) for submerchantable material and $/MBF or $/CCF for merchantable?
Winrock International_PIER-EA Final Reports (May 17, 2007)
75 of 95
•
What revenues are available from utilization of submerchantable and merchantable material from these projects, and what effects do revenues have on the factors and decision rules used to select treatments? For example, by how much will a greater volume of merchantable material in the prescription increase the yarding distance or distance to a processing facility that is economically feasible?
Most HFR treatments in fact involve a mix of submerchantable and merchantable material, with the value of merchantable material sometimes “subsidizing” the high cost of removing a large number of submerchantable stems, and both submerchantable and merchantable being part of the prescription to achieve a desired condition of spacing, residual basal area per acre, improved forest health, improvement in Torching Index and Crowning Index, etc. Including merchantable material would make more acres accessible for treatment. Thus the estimates here, focusing only on one objective and a single treatment targeting the submerchantable biomass fuel, can be taken as conservative.
5.1.2 Refinement #2: GHG emissions from wildfire, and eligibility of HFR as a carbon offset activity The suggestion that HFR might produce sufficient emissions reductions to pay for currently uneconomic CSCH treatments, if these emissions reductions were marketable at commonly used prices for CO2 credits, is a starting point for further study. This suggestion was based on first-order estimates of the difference in CO2 emissions between low-, medium- and highintensity fires, and the assumption that HFR treatment might be credited with turning what would have been a high- or medium-intensity (perhaps crown) fire into a low-intensity (perhaps ground) fire. If so, the emission reductions could be credited to the HFR treatment and potentially marketed as a carbon-offset project. To substantiate this hypothesis, several areas of study are needed. First, work is needed to develop baselines for various wildfire-prone forest types. These baselines will serve as the reference case against which activities to reduce fires would be compared to estimate the potential carbon credits. Such baselines need to include field data and models to quantify the likelihood of fires occurring (e.g. fire-return interval) as well as the effects of fire on greenhouse gas emissions for the forests under different intensities of fire (how much of carbon stock is burned by fire intensity and stand structure). Field data might include measurements of postfire forest carbon stocks for comparison to unburned areas; measurements in past fires of varying intensities; measurements of areas where fuel loads were reduced prior to fire to quantify how much treatment reduced the loss of carbon stocks; and evaluation of non-CO2 greenhouse gas emissions such as CH4 and N2O, also likely to be released in wildfires though to varying extents depending on the type and intensity of fires. Second, further scientific research as well as policy discussion and consensus-building are needed around the question of what reductions in fire intensity and/or greenhouse gas emissions should be attributable to pre-fire HFR treatment. Intuitively reducing ladder fuels or crown density should reduce the probability, intensity, and extent of wildfires and thus the loss of forest carbon stocks and other greenhouse gas emissions; but by how much? With a probabilistic phenomenon such as fire, it is not possible to demonstrate that an area treated with Winrock International_PIER-EA Final Reports (May 17, 2007)
76 of 95
HFR would have burned in the absence of treatment, and released X tons of CO2 equivalent to the atmosphere; nor in the with-treatment scenario is the goal necessarily to avoid fire and its associated emissions, only to reduce the intensity of fire or its extent. Many fire models are currently in use to evaluate probability and impacts of fire under different assumptions, but these models produce highly variable outputs and consensus among models is lacking, and most do not address greenhouse gas emissions from fire. Therefore the process of deciding what types of HFR treatments should be eligible to qualify as carbon offset projects, and assigning values to the greenhouse gas emission reductions attributable to HFR, will involve considerable scientific as well as political consensus-building – even among stakeholders who more or less agree it would be desirable to reduce fuel loads and treat more acres by improving the overall economics of HFR through qualifying these projects for CO2 credit markets. Bringing this refinement together with the last, different HFR treatments and technologies could be evaluated in terms of their greenhouse gas emission impacts: for example, “CSCH” would be assigned a triple emission reduction benefit through reduced emissions from wildfire, reduced emissions from fossil fuel-generated electricity due to electricity generation in biomass facilities, and enhanced carbon sequestration in the residual forest stand. Prescribed fire or cutpile-burn could be assigned a quantifiable benefit for reducing the incidence or intensity of wildfires, but would still put a greater portion of the forest carbon removed in the treatment into the atmosphere. When potential utilization of both submerchantable biomass and merchantable material from HFR treatments is considered, emissions reduction credits become one of a set of values – along with merchantable material, biomass fuel value, green power incentives, and even other marketed ecosystem services enhanced by these treatments -- that would improve the overall economics of HFR and help federal, state and private landowners to mount a more effective response to the wildfire problem. Finally, further work would then be needed to develop carbon accounting methods and field protocols for actually quantifying the potential carbon credits for a variety of fuel treatments by forest types. This calculation would include the reduction in greenhouse gas emissions from displacing some quantity (MWh) of electricity that would otherwise be generated using fossil fuels. Such methods and protocols would need to be cost effective, transparent, and reproducible. These refinements will be addressed through additional field data collection, modeling, analysis, and stakeholder discussions in the second phase of the West Coast Regional Carbon Sequestration Partnership.
5.2 Evaluation of carbon sequestration potential through afforestation using fast-growing species and other forest management methods. In the first phase of this work, the analysis of afforestation potential on rangelands and croplands looked only at the use of planting native species for forest restoration (see Section 2 above). Two other possibilities exist that will be investigated in Phase 2 of the West Coast Regional Carbon Sequestration Partnership. Winrock International_PIER-EA Final Reports (May 17, 2007)
77 of 95
5.2.1 Use of fast-growing species Instead of considering only native species for afforestation activities, fast growing tree species such as hybrid poplar will be investigated. Land suitable for planting such species will be assessed based on existing data, other publications in the region, and partners. Hybrid poplar is already being grown in parts of Oregon and Washington and its extent could be increased. Plantations of hybrid poplar grow fast with up to about 100 t C/ha after 10 years. The potential carbon supply for planting fast growing species on rangelands and crop lands will be investigated including estimating the opportunity costs (as described above), the costs for planting and managing the plantations, and the revenues from the products (pulp, timber, or biomass fuel) plantations. The analysis will be done in a GIS as done for native species and a comparison of the carbon supply from native versus fast-growing species will be preformed.
5.2.2 Other forest management methods In phase 1 of this work, afforestation of rangelands and croplands considered only the planting of native species for forest restoration. However, it is possible that forest could be grown for timber products. Simulating the growing of trees for timber production affects two components of the carbon supply analysis: the quantity of carbon sequestered and the costs. The effects on the quantity of carbon and the costs will be investigated across the region in phase 2. The quantity of carbon sequestered in the living component of forests grown for timber production will be less than that for forest grown for restoration. However this decrease in the long term average in living trees can be made up in part by the carbon in the harvested wood that is converted to long term wood products. The balance between these two main pools of live and wood products will vary by forest type and will be investigated in detail in phase 2. Cost will also be different between forests grown for timber and for restoration. When grown for timber, there will be revenues from the sale of timber as well as for the carbon. The analysis of the potential carbon sequestration for the region by afforestation for timber species will incorporate all these factors to arrive at new estimates of the carbon supply and the results compared to those generated in this report.
Winrock International_PIER-EA Final Reports (May 17, 2007)
78 of 95
References Barbour, R. James; Fight, Roger D.; Christensen, Glenn A.; Pinjuv, Guy L.; and Nagubadi, Rao V. 2004. Thinning and prescribed fire and projected trends in wood product potential, financial return, and fire hazard in Montana. Gen. Tech. Rep. PNW-GTR-606. Portland, OR: U.S. Department of Agriculture, Forest Service, Pacific Northwest Research Station. Barbour, R.J., R.D. Fight, G. A. Christensen, G.L. Pinjuv, and V. Nagubadi. 2001. Assessing the Need, Costs, and Potential Benefits of Prescribed Fire and Mechanical Treatments to Reduce Fire Hazard in Montana and New Mexico. USDA Forest Service – Pacific Northwest Research Station: A report to the Joint Fire Sciences Program, October 5, 2001. Bartolome, J.W., W.E. Frost, N.K. McDougald and M. Connor. 2002. California guidelines for residual dry matter (RDM) management on coastal and foothill annual rangelands. University of California, Division of Agriculture and Natural Resources, Rangeland Monitoring Series, Pub. 8092. Brown, J.R. and S. Archer. 1999. Shrub invasion of grassland: recruitment is continuous and not regulated by herbaceous biomass or density. Ecology 80: 2385-2396. Brown, S. and J. Kadyszewski (Project Coordinators). 2004. Carbon Supply Curves for the Pilot Region: Arkansas, Louisiana and Mississippi. Report Submitted to the Electric Power Research Institute (EPRI) by Winrock International in April 2004. Brown, S. and J. Kadyszewski (Project Coordinators). 2005a. Carbon Supply from Land-Use Change and Forestry for Georgia. Report Submitted to the Electric Power Research Institute (EPRI) by Winrock International in January 2005. Brown, S. and J. Kadyszewski (Project Coordinators). 2005b. Baseline Greenhouse Gas Emissions and Removals for Forest and Agricultural Lands in Washington. Report Submitted to the West Coast Regional Carbon Sequestration Partnership by Winrock International. Brown, S., A. Dushku, T. Pearson, D. Shoch, J. Winsten, S. Sweet, and J. Kadyszewski. 2004. Carbon Supply From Changes In Management of Forest, Range, and Agricultural Lands of California. Publication Number: 500-04-068F. Winrock International, for the California Energy Commission, PIER Energy-Related Environmental Research, March 2004. Available online at http://www.energy.ca.gov/pier/final_project_reports/50004-068.html Burns, R. M., and B. H. Honkala, tech. coords. 1990. Silvics of North America: 1. Conifers; 2. Hardwoods. Agriculture Handbook 654. U.S. Department of Agriculture, Forest Service, Washington, DC. vol.2, 877 p. Cairns, M. A., S. Brown, E. H. Helmer, and G. A. Baumgardner. 1997. Root biomass allocation in the world’s upland forests. Oecologia 111, 1-11.
Winrock International_PIER-EA Final Reports (May 17, 2007)
79 of 95
Cassidy, K., Dvornich, K., Grue, C. and M. Smith. 1999. Washington GAP Analysis dataset. Online at http://www.fish.washington.edu/naturemapping/wagap/public_html/ Chalmers, S.R. and B.R. Hartsough. No date. Thinning and Prescribed Fire As Methods to Reduce Fuel Loading -- a Cost Analysis. Chase, R. A. 1989. Policy in Practice: U.S. Forests. Forum for Applied Research and Public Policy, Summer 1989: 54 – 56. Christensen, G.A., R.D. Fight and R.J. Barbour. 2002. Simulating Fire Hazard Reduction, Wood Flows, and Economics of Fuel Treatments with FVS, FEEMA, and FIA Data. USDA Forest Service Proceedings RMRS-P-25. 2002. In: Crookston, Nicholas L.; Havis, Robert N., comps. 2002. Second Forest Vegetation Simulator Conference; 2002 February 12–14; Fort Collins, CO. Proc. RMRS-P-25. Ogden, UT: U.S. Department of Agriculture, Forest Service, Rocky Mountain Research Station. Eastman, R. 2003. IDRISI Kilimanjaro Guide to GIS and Image Processing: multi-criteria/multiobjective decision wizard. ClarkLabs, Inc. Clark University, Worcester, Massachusetts. Fight, R.D.; Zhang, X.; Hartsough, B.R. 2003. User’s guide for STHARVEST, software to estimate the cost of harvesting small timber. Gen. Tech. Rep. PNW-GTR-582. Portland, OR: U.S. Department of Agriculture, Forest Service, Pacific Northwest Research Station. Fight, Roger D.; Barbour, R. James; Christensen, Glenn, A.; Pinjuv, Guy L.; Nagubadi, Rao V. 2004. Thinning and prescribed fire and projected trends in wood product potential, financial return, and fire hazard in New Mexico. Gen. Tech. Rep. PNW-GTR-605. Portland, OR: U.S. Department of Agriculture, Forest Service, Pacific Northwest Research Station. Fried, J.S., G. Christensen, D. Weyermann, R.J. Barbour, R. Fight, B. Hiserote, and G. Pinjuv. 2003. Modeling opportunities and feasibility of siting wood-fired electrical generating facilities to facilitate landscape-scale fuel treatment with FIA BioSum. In: Bevers, Michael; Barrett, Tara M., comps. 2004. Systems Analysis in Forest Resources: Proceedings of the 2003 Symposium; October 7-9, Stevenson,WA. Proceedings RMRS-P000. Ogden, UT: U.S. Department of Agriculture Forest Service. Rocky Mountain Research Station. Fried, J.S., R.J Barbour and R.D. Fight. 2003. FIA BioSum: Applying a Multiscale Evaluation Tool in Southwest Oregon. Journal of Forestry, March 2003. Fried, J.S., R.J. Barbour, R.D. Fight, G. Christensen, and G. Pinjuv. 2002. Small Diameter Timber Alchemy: Can Utilization Pay The Way Towards Fire Resistant Forests? In: Narog, M. G., technical coordinator. Proceedings of the 2002 Fire conference on managing fire and fuels in the remaining wildlands and open spaces of the Southwestern United States. Gen. Tech. Rep. PSW-GTR-189, Pacific Southwest Research Station, U.S. Department of Agriculture Forest Service, Albany, California.
Winrock International_PIER-EA Final Reports (May 17, 2007)
80 of 95
Higgins, P.A.T., R.B. Jackson, J.M. des Rosiers and C.B. Field. 2002. Root production and demography in a California annual grassland under elevated atmospheric carbon dioxide. Global Change Biology 8: 841-850. Josephson, H.R. 1962. Interpetation of Yield Table Data in Terms of Forest Survey Site Classifications. USDA Forest Service internal memo. Karl, J., P. Tanimoto & S. Mann. 1999. A Northwest Regional Land Cover Classification. Prepared by Conservation Imaging, Inc. in cooperation with the USGS/BRD National Gap Analysis Program, March 15, 1999. ftp://ftp.gap.uidaho.edu/products/regional/nw_lc.zip Lugo, A.E, S.L. Brown, R. Dodson, T.S. Smith and H.H. Shugart. 1999. The Holdridge life zones of the coterminous United States in relation to ecosystem mapping. Journal of Biogeography 26: 1025-1038. Available online at http://www.winrock.org/GENERAL/Publications/The%20Holdridge%20life%20zone s%20of%20the%20coterminous%20United%20States%20in%20relation%20to%20ecosyste m%20mapping%20(1999).pdf Martin, R.E., D.W. Frewing and J.L. McClanahan. 1981. Average biomass of four Northwest shrubs by fuel size class and crown cover. USDS-FS Research Note PNW-374. pp 6 Mater, Catherine M. 2005. Lakeview CROP: A New Resource Offering Protocol for Solid Wood and Energy Production. Presentation by Mater Engineering, Ltd. to the Lakeview Biomass Project/Oregon Solutions Team meeting, Lakeview OR, June 29-30, 2005. Micheli, E.R. and J.W. Kirchener. 2002. Effects of wet meadow riparian vegetation on streambank erosion. 2. Measurement of vegetated bank strength and consequences for failure mechanics. Earth Surface Processes and Landforms 27: 689-697. Miller, D.A. and R.A. White. 1998. A Conterminous United States Multi-Layer Soil Characteristics Data Set for Regional Climate and Hydrology Modeling. Earth Interactions, 2. [Available on-line at http://EarthInteractions.org]. Data last viewed on the Penn State's Earth System Science Center website 03/25/03 at http://www.essc.psu.edu/soil_info/index.cgi?soil_data&conus&data_cov&awc&imag e Miller, J.D., and S.R. Yool. 2002. Modeling fire semi-desert grassland/oak woodland: the spatial implications. Ecological Modeling 153 (3): 229-245. Morais, M. 2001. HFire.net http://www.physics.ucsb.edu/~complex/research/hfire/welcome.html Nichols, T. 1989. Policy in Practice: U.S. Parks. Forum for Applied Research and Public Policy, Summer 1989:50 52. Northwest Habitat Institute web site. 2003. (http://www.nwhi.org), Northwest Habitat Institute, Corvallis, OR. Winrock International_PIER-EA Final Reports (May 17, 2007)
81 of 95
Ottmar R.D., D.V. Sandberg, S.J. Prichard, C.L. Riccardi. 2003. Fuel Characteristic Classification System. Presentation at the 2nd International Wildland Fire Ecology and Fire Management Congress http://ams.confex.com/ams/FIRE2003/techprogram/paper_67236.htm Pienaar, L.V. and K.J. Turnbull. 1973. The Chapman-Richards generalization of Von Bertalanffy’s growth model for basal area growth and yield in even-aged stands. Forest Science 19 (1): 2-22. Pierce, L, F. Watson, W. Newman, A. Rocha and J. Nelson. Aboveground biomass of the maritime chaparral community, Ft.Ord, Monterey, California. http://home.csumb.edu/p/piercelars/world/marchapbiomass_v2.htm Prichard, S.J., D.L. Peters and R.D. Hammer. 2000. Carbon distribution in subalpine forests and meadows of the Olympic Mountains, Washington. Soil Science Society of America Journal 64: 1834-1845. Pyne, S.J. 2000. Briefing 18 – Fire Planet: The Politics and Culture of Combustion, The CornerHouse 400(18). Pyne, S.J., P.L. Andrews, and R.D. Laven. 1996. Introduction to Wildland Fire, 2nd Ed. Wiley Publishers, New York, NY. Richards, F.J. 1959. A flexible growth function for empirical use. Journal of Experimental Botany 10(29):290-300. Riggan, P.J. and P.H. Dunn 1982. Harvesting chaparral biomass for energy – an environmental assessment. In: C.E. Conrad and W.C. Oechel (eds) Dynamics and management of Mediterranean-type ecosystems. Proceedings of Symposium, 1981, San Diego, CA. Gen. Tech. Rep. PSW-58. USDA-FS. Pp 149-157. Row, C. and R.B. Phelps. 1996. Wood Carbon Flows and Storage after Timber Harvest. In: Samplson, R.N. and D. Hair (Editors). Forests and Global Change, Volume 2: Forest Management Opportunities for Mitigating Carbon Emissions. American Forests. Washington, DC. Sandberg D. V. 2003. Fire Potential Rating for Wildland Fuelbeds. Presentation at the 2nd International Wildland Fire Ecology and Fire Management Congress http://ams.confex.com/ams/FIRE2003/techprogram/paper_67075.htm Sandberg, D.V., R. Ottmar and G.H. Cushon. 2001. Chiracterizing fuels in the 21st Century. International Journal of Wildland Fire 10: 381-387 Schlesinger, W.H. 1997. Biogeochemistry: An Analysis of Global Change. Academic Press, San Diego, CA. Schmidt, Kirsten M.; Menakis, James P.; Hardy, Colin C.; Hann, Wendall J.; Bunnell, David L. 2002. Development of coarse-scale spatial data for wildland fire and fuel management. Winrock International_PIER-EA Final Reports (May 17, 2007)
82 of 95
Gen. Tech. Rep. RMRS-GTR-87. Fort Collins, CO: U.S. Department of Agriculture, Forest Service, Rocky Mountain Research Station. Schoennagel T. T. T Veblen and W. H. Romme. 2004. The interaction of Fire, Fuels, and Climate across Rocky Mountain Forests. BioScience 54 (7): 661-676 Schwarz, G.E. and R.B. Alexander. 1995. State Soil Geographic (STATSGO) Data Base for the Coternimous United States. U.S. Geological Survey. Reston, VA. Last viewed online 03/30/04 at http://water.usgs.gov/lookup/getspatial?ussoils Smith, J.E., L.S. Heath, and J.C. Jenkins. 2003. Forest Volume-to-Biomass Models and Estimates of Mass for Live and Standing Dead Trees of U.S. Forests. US Department of Agriculture, Forest Service, Northeastern Research Station, General Technical Report NE-298. Northeastern Research Station. Smithwick, E.A.H., M.E. Harmon, S.M. Remillard, S.A. Acker and J.F. Franklin. 2002. Potential upper bounds of carbon stores in forests of the Pacific Northwest. Ecological Applications 12: 1303-1317. Thornton, P.E., S.W. Running, and M.A. White. 1997. Generating surfaces of daily meteorological variables over large regions of complex terrain. Journal of Hydrology, 190:214-251. USDA –National Agricultural Statistics Service (NASS). 2004. 2004 Washington Annual Bulletin. Online at http://www.nass.usda.gov/wa/annual04/annual04.pdf USDA Forest Service Research & Development/Western Forestry Leadership Coalition. 2003. A Strategic Assessment of Forest Biomass and Fuel Reduction Treatments in Western States. USDA Forest Service, FIA. Forest Inventory and Analysis Database. (See: www.fs.fed.us/fia) USDA Forest Service. 2002. Forest Inventory and Analysis Database (See: www.fs.fed.us or http://ncrs2.fs.fed.us/4801/fiadb/rpa_tabler/webclass_rpa_tabler.asp). U.S. Environmental Protection Agency. 2003. The Emissions & Generation Resource Integrated Database (EGRID) version 2.01. Available online at http://www.epa.gov/cleanenergy/egrid/index.htm. USGS. GAP Analysis Program. 2005. http://www.gap.uidaho.edu/projects/default.htm WSDOT. 2005. Washington State Department of Transportation GeoData Distribution Catalog: http://www.wsdot.wa.gov/mapsdata/geodatacatalog/default.htm USGS. 2004a. National Elevation Dataset 30m x 30m tiles for Washington. Data available from U.S. Geological Survey, EROS Data Center, Sioux Falls, SD or online at http://seamless.usgs.gov/
Winrock International_PIER-EA Final Reports (May 17, 2007)
83 of 95
USGS. 2004b. National Land Cover Dataset for Washington. Data available from U.S. Geological Survey, EROS Data Center, Sioux Falls, SD or online at http://seamless.usgs.gov/ Van Tuyl, S., B.E. Law, D.P. Turner and A.I. Gitelman. 2005. Variability in net primary production and carbon storage in viomass across Oregon forests-an assessment integrating data from forest inventories, intensive sites, and remote sensing. Forest Ecology and Mangement 209: 273-291. Wensel, L. C., P. J. Daugherty, and W. J. Meerschaert. 1986. CACTOS User's Guide: The California conifer timber output simulator. Div. of Ag. Sci. Univ. of Calif., Berkeley, Bulletin 1920. http://www.cnr.berkeley.edu/~wensel/cactos/cactoss.htm Winjum, J.K., S. Brown and B. Schlamadinger. 1998. Forest harvests and wood products: sources and sinks of atmospheric carbon dioxide. Forest Science 44: 272-284.
Winrock International_PIER-EA Final Reports (May 17, 2007)
84 of 95