iterative approach described in the Introduction requires the solution of a large NLP (nyx + nu variables, nyx equality constraints and mx inequality constraints, ...
Case studies for a first-order robust nonlinear programming formulation Elaine T. Hale and Yin Zhang Technical Report TR06-06 Department of Computational and Applied Mathematics Rice University, Houston, Texas, 77005, U.S.A. May, 2006
Abstract In this paper, we conduct three case studies to assess the effectiveness of a recently proposed first-order method for robust nonlinear programming (Ref. 1). Three robust nonlinear programming problems were chosen from the literature using the criteria that results calculated using other methods must be available and the problems should be realistic, but fairly simple. Our studies show that the first-order method produced reasonable solutions when the level of uncertainty was small to moderate. In addition, we demonstrate a method for leveraging a theoretical result to eliminate constraint violations. Since the first-order method is relatively inexpensive in comparison to other robust optimization techniques, our studies indicate that under moderate uncertainty the first-order approach may be more suitable than other methods for large problems. Keywords: robust optimization, nonlinear programming, first-order robustness, design under uncertainty, safety constraints
1
Introduction
While sometimes used to refer to probabilistic optimization, in this paper, robust optimization refers to the deterministic problem of optimizing an objective function while also ensuring that some set of constraints will be satisfied even if one or more parameters deviate from their nominal values. We concentrate
1
specifically on the robust nonlinear programming (rNLP) problem: min φ (y, u, sˆ)
y,u∈U
(1)
s.t. F (y, u, s) = 0 G (y, u, s) ≤ 0, ∀s ∈ S,
where y ∈ Rny are state variables, u ∈ Rnu are control variables and s ∈ S ⊂ Rns is a vector of uncertain parameters with sˆ its nominal value. φ is a scalar objective function while F ∈ Rny and G ∈ Rm . This problem, the robust analog of a nonlinear programming problem (NLP), is a semi-infinite optimization problem since there are an infinite number of constraints (one set for every s ∈ S). Note that the distinction between y and u variables is often natural (once the independent variables u are specified F may be used to solve for the dependent variables y), however this formulation may be used even if it is not (Ref. 1). Much previous work on rNLP has directly addressed the full semi-infinite problem. A common iterative approach alternates between the NLP defined by the original objective function subject to the constraints holding at some number of discrete parameter values (multi-period programming), and solving the m feasibility (inner) problems max Gi (y, u∗k , s)
y,s∈S
s.t. F
(y, u∗k , s)
(2)
= 0,
where u∗k is the optimal value of the first problem. The inner problems yield worst-case parameter values s∗i,k ³ ´ ∗ ∗ (and the corresponding state variables yi,k ). Once determined, all of the s∗i,k such that Gi yi,k , u∗k , s∗i,k ≥ 0 are added to the discretization in the first problem and the entire process repeats (Ref. 2–7). It is widely recognized that this is an expensive approach—methods proposed for reducing the computational burden include introducing heuristics for dropping parameter values from the discretization, aggregating the inner problems using KS functions, and collapsing the two stages by introducing the KKT conditions for the inner problems as constraints in the outer problem (Ref. 7). There have also been several papers that start with the general rNLP formulation, but eventually arrive at a finite nonlinear programming problem by assuming that the constraints are either convex or monotonic with respect to the parameters (Ref. 8–10). A sensitivity analysis approach was proposed by Takamatsu et al. (Ref. 11), see Section 5. A recent paper by Zhang proposes a method for calculating first-order rNLP (1-rNLP) solutions that only require the solution of a single (but larger) nonlinear program (Ref. 1). The obvious drawbacks of the approach are that the full semi-infinite problem is not solved, and the parametric uncertainty must be of 2
the form
n o s ∈ S, S = sˆ + τ Dδ : kδkp ≤ 1 ,
(3)
where D ∈ Rns ×ns , δ ∈ Rns , and τ is a scalar. However, if the amount of uncertainty is moderate and fits reasonably within the framework of Equation 3, one should expect to get a good approximate solution for relatively little cost. The purpose of this paper is to investigate these claims. In particular, we address the following questions via three case studies taken from the literature: the design of a three-bar truss, the design of a heat exchanger network and the design of a reactor-separator system. 1. How do first-order robust solutions compare with other robust solutions found in the literature with respect to optimality and feasibility? 2. How does the computational complexity of the first-order robust formulation compare with that of other formulations and solution methods? 3. When is the first-order robust formulation preferred over other methods? 4. Can the theoretical results in (Ref. 1) be leveraged to further ensure robust feasibility? The case studies were chosen primarily because they have already been solved using other methodologies— robust designs for the truss and reactor-separator were calculated using iterative schemes similar to the description above; a sensitivity analysis approach was previously applied to the heat exchanger network. In addition, the truss problem was chosen for its simplicity, the heat exchanger network demonstrates the limits of the first-order method with respect to uncertainty set size, and the reactor-separator example is a standard test problem (Ref. 5, 8, 12–14). The reactor-separator is also important because the particular instance cited (Ref. 14) gives results for three different uncertainty sets: two that fit the assumptions of Zhang and one that does not. The rest of this paper is organized as follows. In Section 2 we introduce the first-order robust formulation and a theoretical result that bounds the inequality constraint violations. Section 3 summarizes the notation and approaches used in the remainder of the paper. The three case studies are given in Sections 4 to 6. Finally, we conclude with Section 7.
3
2
A Robust Nonlinear Programming Formulation
Here we briefly summarize the results of Zhang (Ref. 1). Let n o S = Sτ = sˆ + τ Dδ : kδkp ≤ 1 , τ > 0, 1 ≤ p ≤ ∞.
(4)
Then if [Fy (y, u, s)]ij =
∂Fi (y, u, s) , i, j = 1, 2, . . . , ny , ∂yj
(5)
and all other derivatives of interest are defined similarly, the first-order robust formulation for Equation 1 given in (Ref. 1) is min φ (y, u, sˆ)
y,ys ,u∈U
s.t. F (y, u, sˆ) = 0
(6)
Fy ys + Fs = 0 ° ° Gi (y, u, sˆ) + τ °eTi (Gy ys + Gs ) D°q ≤ 0, i = 1, . . . , m, where 1 1 + = 1, p q
(7)
Fy , Fs , Gy and Gs are evaluated at (y, u, sˆ) and ei ∈ Rm is the ith column of the the identity matrix. (Note that if p = 1 then q = ∞ and vice-versa.) In addition, we have the following result, a proof of which is given in (Ref. 1) for the case that D = I. Theorem 2.1. Let (ˆ y , yˆs , u ˆ) be feasible for Equation 6 with τ > 0. Assume that in the set Sτ : (i) y (ˆ u, s) is implicitly defined as a differentiable function of s via the equation F (y, u ˆ, s) = 0 and (ii) every row of (Gy ys + Gs ) (y (s) , u ˆ, s) is (p, q)-Lipschitz continuous modulo to L. Then L G (y (ˆ u, s) , u ˆ, s) ≤ τ 2 2
µ
¶ max
||δ||p ≤1
2 kDδkp
, ∀s ∈ Sτ .
(8)
Thus, for any feasible solution to Equation 6, u ˆ, that also satisfies the assumptions of Theorem 2.1 we have a bound on the maximum violation of any of the inequality constraints. In addition, assuming that ° ° τ °eTi (Gy ys + Gs ) D°q > 0, ∀i = 1, . . . , m, there will be a neighborhood about sˆ, S˜τ , such that G (y (ˆ u, s) , u ˆ, s) ≤ 0, ∀s ∈ S˜τ .
4
(9)
3
Methodology
There are several conventions followed throughout the three case studies that follow. We outline them here so as to avoid repetition in the remainder of the paper. First, for all of the problems the uncertainty sets will be of the form p = ∞ (box uncertainty) or p = 2 (ellipsoidal uncertainty). Thus q = 1 or q = 2, respectfully. No matter what q is, the resulting ° ° τ °eTi (Gy ys + Gs ) D°q term is not continuously differentiable at 0, which violates standard assumptions for nonlinear programming. Therefore, whenever applicable, the following approximations are used, with ² = 1E-8: kxk1 ≈
n q X
x2i + ²2
i=1
v u n uX kxk2 ≈ t x2i + ²2 .
(10)
i=1
Secondly, while it will not be discussed in what follows, some attempt was made to scale the various equations and variables within each problem in order to improve the numerical results. Thirdly, results for other rNLP methods are cited from other papers; the first-order robust solutions were calculated using the AMPL modeling language and the NLP solvers MINOS and SNOPT (Ref. 15–17). We chose not to reproduce the results of the other papers since the solution methods used were complex enough that exact reproduction would be difficult to impossible, especially if one of the purposes was to calculate reliable computational times. Since all of the methods rely on solving various NLPs, computational time can be qualitatively compared by considering the number and size of the NLPs involved for each method. Finally, given a robust solution, (ˆ y , u∗ ), first-order robust or otherwise, simulation will refer to the notion of choosing a series of random s ∈ S for some S (maybe different from the one used to calculate u∗ ), and for each such parameter value calculating y from F (y, u∗ , s) = 0 and the corresponding G (y, u∗ , s). Plots of these results along with the first-order approximations of these quantities (y ≈ yˆ + yˆs (s − sˆ) and ³ ´ ˆ y yˆs + G ˆ s (s − sˆ)) are used to provide insight into the performance of the G (y, u∗ , s) ≈ G (ˆ y , u∗ , sˆ) + G first-order robust formulation versus other rNLP methods. In all of the plots, actual values are represented by x’s and first-order approximations are represented by o’s. The individual values of s chosen from S are referred to as samples. The simulations presented in this paper were completed in Matlab using results imported from AMPL.
5
10"
10"
10"
2
1
3
z
1
α
z
P 2
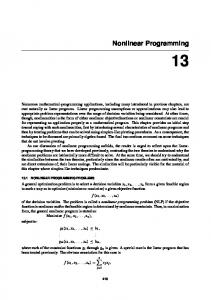
Figure 1: Three-Bar Truss. The three bars are labeled 1, 2 and 3. A force of magnitude P is applied at the given node in the direction specified by angle α. The subsequent displacement of that node is defined by the distances z1 and z2 .
4
Design of a Three-Bar Truss
The objective of the first case study is to minimize the weight of the truss shown in Figure 1 assuming that it must be able to withstand a force of magnitude P applied to the free node at any angle α in some given range (Ref. 2). As the lengths of the bars are given by the geometry of the problem, the weight of the truss is determined by the cross-sectional areas b1 , b2 and b3 . These are also the control variables u in the notation of Section 2. Assuming that the same material is to be used for each bar, the objective of the problem is √ √ min 10 2 b1 + 10 b2 + 10 2 b3 .
(11)
The truss is considered satisfactory if the stress on each bar and the displacement of the free node are kept below some threshold values, and if the bars are not expected to buckle, for all α ∈ A ⊂ R. The displacements z1 and z2 (state variables) are calculated from the force balance: √
2 × 10⁶ b1 + b3 4 b1 − b3
b1 − b3 z1 √ = P z2 b1 + b3 + 2 2b2
6
cos α . sin α
(12)
The stress constraints are: 5 × 10⁵ |z1 + z2 | ≤ 5 × 10³
(13)
106 |z2 | ≤ 2 × 10⁴
(14)
5 × 10⁵ |z2 − z1 | ≤ 5 × 10³
(15)
−10 (z1 + z2 ) ≤ π 2 βb1
(16)
−10z2 ≤ π 2 βb2
(17)
and the buckling constraints are:
−10 (z2 − z1 ) ≤ π 2 βb3 ,
(18)
1 4π
≈ 0.079577 because the bars are assumed
where β is related to the moments of inertia of the bars and is
to be cylindrical. The inequalities limiting the amount of displacement are:
z1 ≤ δ1
(19)
z2 ≤ δ2 .
(20)
As in (Ref. 2) P = 4 × 10⁴ lb and we consider two cases: h π πi C1: A = − , , δ1 = δ2 = 0.005” 4 2 h πi C2: A = 0, , δ1 = 0.005”, δ2 = 0.004”. 2 Taking C1 first, we can write the problem in the form of Equation 6 by letting £ y = z1
z2
¤T
£ , u = b1
b2
b3
¤T
, s=α
(21)
n o ° ° π , τ = 3ˆ s, S = sˆ + τ δ : °δ °p ≤ 1 , 8
(22)
and
sˆ =
where p can be any number 1 to ∞ since s is a scalar. φ (y, u, s), F (y, u, s) and G (y, u, s) are readily determined by making the appropriate substitutions and moving all of the equality and inequality constraint terms to one side. For C2 we need only change the values of δ1 and δ2 and set
sˆ =
π , τ = sˆ. 4 7
(23)
The resulting first-order robust formulation was solved for both C1 and C2, with the nominal solutions for these cases serving as initial guesses. (The nominal problem is defined by setting s = sˆ, τ = 0, and excluding the equality constraint containing ys .) The nominal and first-order robust results are given in Table 1, along with the results given in Kwak and Haug’s paper (Ref. 2). Table 1: Three-bar truss designs: nominal, first-order robust, and Kwak and Haug’s results for C1 and C2. The zˆ’s are the displacements when the load is applied at the nominal angle α ˆ. Desc.
Weight
b1
b2
b3
zˆ1
zˆ2
C1 C1 C1 C2 C2 C2
282.36 440.20 320.45 125.89 427.80 340.00
12.148 12.959 11.309 8.8875 15.164 11.314
0.0000 1.9082 0.04475 0.0022 2.4981 2.0000
7.8183 16.818 11.319 0.0127 13.320 11.314
5.00E-3 3.72E-3 4.62E-3 5.00E-3 2.67E-3 3.54E-3
1.08E-3 1.64E-3 1.90E-3 4.00E-3 2.11E-3 2.83E-3
Nom 1-R K&H Nom 1-R K&H
∂ zˆ1 ∂α -3.5E-3 -1.1E-3 -1.9E-3 -2.7931 -3.0E-3 -3.5E-3
∂ zˆ2 ∂α 6.0E-3 2.8E-3 4.6E-3 2.7921 2.4E-3 2.8E-3
Kwak and Haug’s results were obtained with an iterative approach like the one described in the Introduction. The distinctiveness of their algorithm lies in how they update their guess for u. After identifying the inequality constraints that are currently violated for some value of the parameters, they linearize the corresponding inner problem (Equation 2), apply the KKT conditions and simplify, ultimately presenting the following update NLP for u (u(j+1) = u(j) + δu): min φu δu
δu,λi
s.t. − eTi Gy + λTi Fy = 0, i ∈ I ¡ T ¢ ei Gu − λTi Fu δu ≤ ∆Gi , i ∈ I,
(24)
where I is the index set of the violated inequality constraints, s¯i and y¯i were the optimal arguments of the corresponding inner problems and the derivatives are calculated at s¯i , y¯i and u(j) . In practice, the NLP is simplified before it is solved. In particular, the equality constraints are solved for λi , the result is substituted back into the inequality constraints, and the result is a linear program (LP) in δu. The purpose of this LP is to minimize the increase of the objective function while ensuring an appropriate reduction in the violated inequality constraints (∆Gi , i ∈ I). In practice, it is not solved to completion, but rather a step-size restriction is imposed (Ref. 2). Keeping this in mind it is possible to make a few preliminary remarks concerning the results shown in Table 1. In particular, it seems that the first-order robust approach tends to overestimate the effect of α 8
2a) 1−Robust Angles and Displacements 1.4 0.7 0 −0.7 −3 x 10
α (rad)
α (rad)
1a) Kwak and Haug Angles and Displacements 1.4 0.7 0 −0.7 −3 x 10
z1
z1
5 0
5 0
−3
z2
10 5 0 −5
−3
x 10 z2
x 10
0
25
sample
50
10 5 0 −5
0
25 sample
50
£ ¤ Figure 2: Simulation results for C1. 50 random angles taken from A = − π4 , π2 (uniformly) and the corresponding displacements zi , i = 1, 2. In the displacement plots, the dashed lines represent δi , i = 1, 2. x 103
1b) Kwak and Haug Stresses
0
2b) 1−Robust Stresses
0 x 104
2 bar 2
bar 2
2 1 0
0 x 103
x 10
bar 3
5 0 0
x 104
1
3
bar 3
x 103
bar 1
5
bar 1
5
25 sample
50
5 0 0
25 sample
50
Figure 3: Simulation results for C1. The stresses on each bar (x’s) and the corresponding first-order approximations (o’s) for the series of angles shown in Figure 2. The dashed lines (at the top if not visible) represent the maximum stresses allowed by the stress constraints. on the system since the first-order robust trusses are both heavier (and thus represent more conservative solutions) than the corresponding semi-infinite trusses. In addition, the 1-Robust sensitivities of z with respect to α are uniformly smaller than Kwak and Haug’s which indicates that the lighter semi-infinite solutions are probably not first-order robust. To see if these observations hold up, we simulate this system as described in Section 3 using both robust solutions (first-order and semi-infinite). The results for C1 are shown in Figures 2 through 4. The results for C2 are very much the same (except that buckling is not at all an issue for either design in this case), and so are not shown. Assuming that Kwak and Haug managed to find the global semi-infinite solution to this problem, the 9
1c) Kwak and Haug Buckling Constraints
2c) 1−Robust Buckling Constraints 10 bar 1
bar 1
10 5 0
0 2
bar 2
bar 2
0.1
5
0
1 0
10 5 0
bar 3
bar 3
−0.1
0
25 sample
50
10 5 0 0
25 sample
50
Figure 4: Simulation results for C1. The buckling constraints for each bar plotted following the same conventions as Figure 3. plots demonstrate that the first-order solution had to be the more conservative of the two because the firstorder predictions computed for the semi-infinite case do not satisfy the displacement constraints or the stress limit on bar 3. In contrast, all of the first-order predictions satisfy the constraints in the first-order robust case, as expected. In these plots the conservativeness of the solution is indicated by the tendency of the actual values to fall below the first-order approximations. Taken as a whole, the plots show that both designs are satisfactory (all design criteria are met for all values of the parameter). From the table we recall that the semi-infinite designs of Kwak and Haug are more efficient. But there was a computational cost for obtaining the lighter design—for C1 Kwak and Haug’s approach required 17 iterations, where each iteration required the solution of 5-6 small “inner” NLP’s (nonlinear objective and two nonlinear equality constraints in three variables) and 1 LP in three variables, plus the work it took to derive the LP’s, which mainly consists of evaluating partial derivatives with respect to b and z and solving a 2×2 linear system. In addition, this approach relies heavily on one’s ability to solve the inner problems (Equation 2) to global optimality. In contrast, the first-order robust design was obtained from a single NLP with 7 variables, 4 equality constraints and 8 inequality constraints. Furthermore, first-order feasibility over the entire parameter range is guaranteed as long as a feasible solution is found (that is, there is no global optimality requirement). For both approaches, it is generally wise to conduct a simulation similar to the one presented here. For the first-order approach the main reason for this is that one does not know if the first-order predictions will overestimate or underestimate the constraint violations. For the semi-infinite approach, the simulation may be able to find a bad parameter value and corresponding constraint violation that was missed due to the non-global nature of standard NLP solvers. In both cases, the simulations proceed readily from the 10
T
nm
Rnm
Snm
A
nm
Tn(m−1)
Figure 6: Exchanger mn.
Heat
Figure 5: Heat exchanger network to be optimized. Picture from (Ref. 11). NLP model and a pseudo-random number generator.
5
Design of a Heat Exchanger Network
The second example to be considered is the design of the heat exchanger network presented in (Ref. 11) and depicted in Figure 5. This network is subdivided by hot streams, such that each exchanger is given two subscripts: the first denotes which hot stream flows through it, and the second tells us if it is the first, second or third exchanger that the hot stream encounters. There are four hot streams with initial temperatures T10 , T20 , T30 and T40 . For an arbitrary exchanger, exchanger nm, we have the situation depicted in Figure 6, and the following relations hold. The heat transfer area, Anm (in ft2 ) must be
Anm
r ¡ n ¢ ln = Unm Gnm 1 − rn / (wcp )nm
"¡
Tn(m−1) − Snm (Tnm − Rnm )
¢# ,
(25)
where rn is the heat flow rate of the nth hot stream (in BTU h−1 ◦ F−1 ), (wcp )nm is the heat flow rate of the cold stream, Unm is the overall heat transfer coefficient of the exchanger, Gnm is a geometric correction factor, Tn(m−1) is the inlet temperature of the hot stream, Tnm is the outlet temperature of the hot stream, and Rnm and Snm are the inlet and outlet temperatures, respectively, of the cold stream. We also have that at steady state, the heat lost by the hot stream equals the heat gained by the cold
11
stream, that is: ¡ ¢ rn Tn(m−1) − Tnm = (wcp )nm (Snm − Rnm ) .
(26)
Once the individual exchangers are integrated into a network, we have that each exchanger’s Tn(m−1) and Rnm will either be equal to some other exchanger’s hot or cold outlet temperature, or must be specified. In Takamatsu et al., the optimization problem is then given (for a general system with N hot streams and an index set Subn for each such subsystem n ∈ {1, 2, . . . , N }) as
min
A,R,S,T
N X
X
Anm
n=1 m∈Subn
s.t. R = BS + b Tn0 = cn , n = 1, . . . , N Anm
rn ¡ ¢ ln = U Gnm 1 − rn / (wcp )nm
"¡
Tn(m−1) − Snm (Tnm − Rnm )
¢#
(27)
¡ ¢ rn Tn(m−1) − Tnm = (wcp )nm (Snm − Rnm ) Sˆout − δ ≤ Sout ≤ Sˆout + δ, n = 1, . . . , N, ∀m ∈ Subn , ∀U Gnm ∈ U where the objective is to minimize the total heat exchanger area while requiring that the cold stream outlet temperatures Sout (for the entire system) will be near some specified setpoints Sˆout for any U Gnm = Unm Gnm values in some set U. For the particular geometry shown in Figure 5, we have that N = 4, Sub1 = Sub3 = Sub4 = {1, 2} , Sub2 = {1, 2, 3} , S 21 500 ˆ Sout = S31 , Sout = 450 , δ = 10, S41 400
(28)
B is a connection matrix of zeros and ones, and the values of the remaining parameters, which are b, cn , rn , (wcp )nm and the nominal values of U Gnm , are given in Table 2. Takamatsu et al.’s approach to this problem is to start with a nominal solution (a solution to Equation 27 with δ = 0 and U = {UˆG}) and then use sensitivity analysis to find an approximately robust solution. In particular, the following optimization problem is solved for a given deviation in the parameter values,
12
Table 2: Model parameter values for the heat exchanger network in (Ref. 11). n 1
cn 400
rn × 10−4 150
2
530
150
3
600
150
4
500
150
nm 11 12 21 22 23 31 32 41 42
δU G. min
δA,δSout
bnm 180 130 0 0 0 0 0 0 150
N X
(wcp )nm × 10−4 100 100 135 135 100 100 135 100 135
X
UˆGnm 100 100 135 135 100 100 135 100 135
δAnm
n=1 m∈Subn
s.t. δSout = f (δA, δU G)
(29)
δA ≥ 0 |δSout | ≤ δ, where the deviation variables δA and δSout are defined as the difference between the values of the corresponding variables in the final design and the nominal solution, and the function f (δA, δU G) represents the approximation of the deviations δSout using sensitivity analysis about the nominal optimum. In Takamatsu et al., the individual parameter deviations δU Gnm were taken as −0.3UˆGnm in the first case, and as −0.5UˆGnm in the second. This approach contrasts markedly with both the full semi-infinite robust optimization problem, and with the approach taken by this paper in at least two respects: 1. It assumes a particular parameter deviation, rather than an infinite set of parameter deviations. 2. Largely because of the first point, its purpose is to calculate one-sided engineering overdesign factors (δA ≥ 0), rather than the best deviations (in either direction) that result in a sufficiently robust system. In addition, the linearization performed by Takamatsu et al. differs from that proposed here. Takamatsu et al. linearize the entire optimization problem about the nominal solution (via the KKT conditions), whereas in this work just the constraints are linearized and only with respect to the uncertain parameters about the final, robust solution (at convergence). 13
The first result of note is that we were not able to reproduce Takamatsu et al.’s nominal solution. In that paper, Takamatsu et al. indicate that they solved the nominal problem using a multilevel technique dating from 1965 and a coordinating algorithm (for integrating the hot stream subsystems) based on the conjugate gradient method (Ref. 11). The resulting solution is shown in Figure 7. Our nominal solution is shown in Figure 8. Note that this solution was found by both SNOPT and MINOS, even when Takamatsu et al.’s nominal solution was used as the starting guess. The two solutions are qualitatively different (we found three of the original exchangers to be unnecessary in the nominal case) and our solution has a significantly improved objective function value. takamatsuVars.dat, Total Area: 82564 T12=328
R12=130
S12=235
5840
T23=355
13145 T30=600
T11=398 R11=180
157
S11=183
S41=400
T40=500 9144
S23=319
7682
S31=450 T20=530
T10=400 T42=299 R42=150
7225
T22=445 S42=252
S22=276 1229
T31=512
17015
S32=429
21127
S21=500
T21=467 T41=390
T32=374
Figure 7: Takamatsu et al.’s nominal solution. Heat exchanger areas are at the center of the circles and are in ft2 ; temperatures are in ◦ F. In order to obtain robust results as per Section 2 that are somewhat compareable to the results of Takamatsu et al., the uncertainty set U for the parameters U Gnm was defined as n o U = UˆG + τ diag(UˆG)δ |kδk∞ ≤ 1 ,
(30)
where diag(·) takes a vector and returns the diagonal matrix whose nonzero elements, in order, are the elements of the given vector. Thus, for a given value of τ , U corresponds to the hyperbox obtained by placing ± (τ · 100) % bounds on each individual U Gnm about its nominal value. 14
snopt_nom.dat, Total Area: 70071 T12=331
R =130 12
S =233
S =400
12
5640
13252
41
T =355 23
T30=600
T =400
T40=500
11
R =180 11
S =180 11
S =442 23
20627
T42=325
4180
544
31
T31=595
T10=400
R42=150
S =450
T20=530
T22=530 S42=221
S22=221
25828
S32=500
S21=500
T21=530 T41=389
T32=344
Figure 8: Improved nominal solution. Heat exchanger areas are in ft2 ; temperatures are in ◦ F. Note that exchangers 11, 21 and 22 have been eliminated. With u and y from Section 2 consisting of the heat exchanger areas and temperatures respectively, and both lower and upper bounds on the value of Sout , it is only possible to solve the first-order robust problem corresponding to Equation 27 for τ ≤ 0.1 (approximately). This is not too surprising since the robust formulation considers an entire hyperbox of potential parameter values whereas Takamatsu et al. consider a single worst-case point. Therefore, in addition to the solution for τ = 0.1 with both bounds in place, we also generate 1-rNLP robust solutions for Equation 27 with the upper bound on Sout removed. This corresponds to the likely situation that we are most interested in the final temperatures of the outlet cold streams being above some minimum values. For this case we solved the first-order robust problem with τ = 0.3 and τ = 0.5 so as to include the worst-case points considered by Takamatsu et al. The first-order robust results, and Takamatsu et al.’s results are summarized in Table 3 and are denoted “1R” and “T.”, respectively. The heat exchanger areas, the total area required for the network (which is also the value of the objective function) and the value of Sout when U Gnm = UˆGnm , according to the model, are shown for each solution. Later we will also refer to the engineering over-design case, that is, the heuristic method of increasing each exchanger area by a certain percentage. This was the base case used by Takamatsu et al. as a comparison; they cite this approach as adding 13.7% to every heat exchanger area for the τ = 0.3 case (OD30) and 33.7% for the τ = 0.5 case (OD50). Applying this approach to 15
Takamatsu et al.’s nominal solution results in designs of 93,875 ft2 and 110,388 ft2 of total heat exchanger area, respectively. The corresponding nominal outlet temperatures are 505, 465, and 413◦ F for OD30 and 510, 484 and 428◦ F for OD50. Table 3: Heat exchanger network designs. After the two nominal solutions, heat exchanger areas are given in units of percent change from nominal if the given exchanger has a nonzero area in the nominal solution; otherwise the actual area is reported. The percentages for the T. solutions are based on T. Nom.; the percentages for the 1R solutions are based on 1R Nom. Desc. A11 A12 A21 A22 A23 A31 A32 A41 A42 P Anm ˆ S21 Sˆ31 Sˆ41
T. Nom. 157 5840 21127 1229 9144 7682 17015 13145 7225 82564
1R Nom. 0 5640 0 0 20627 544 25828 13252 4180 70071
1R10 1734 -92.5 0 0 -1.34 -100 +10.5 +41.3 -74.5 70831
T. 30 +0 +0 +0 +0 +0 +14.1 +0 +17.4 +0 85934
1R30 0 +7.13 0 0 +29.7 -100 +23.3 +25.2 -25.3 84362
T. 50 +0 +0 +0 +0 +0 +40.0 +0 +43.3 +0 91328
1R50 0 +7.31 0 0 +52.3 -100 +54.4 +54.1 -61.1 99394
500 450 400
500 450 400
499 449 400
498 460 412
517 464 418
495 475 426
529 477 433
By examining the table we see that a) a robust solution for τ = 0.1 is obtained with very little cost in terms of the objective function value (+1%), b) for the solutions intended to deal with 30% changes in U Gnm , the first-order robust solution has the smallest total area and c) Takamatsu et al.’s solution actually has the smallest overall area in the 50% change case, however, their nominal value for Sˆ21 seems dangerously low. Also, as noted before, there are qualitative differences between the various solutions. To see what these solutions actually mean for the plant, we present simulation results as described in Section 3. Figure 9 presents such results for the first-order robust problem with τ = 0.1 and both bounds on Sˆout in place; Figures 10 and 11 give results for all three approaches, for 30% and 50% changes in U Gnm , respectively. All of the plots use randomly generated, independent and uniformly distributed deviations in the individual values of U Gnm . For Figure 9, the deviations were chosen from the set n o ∆U G = 0.1diag(UˆG)δ | kδk∞ ≤ 1 , as one would expect based on Equation 30. However, for Figures n o 10 and 11, the deviations for U G were chosen from the sets ∆U G = − τ2 UˆG + τ2 diag(UˆG)δ | kδk∞ ≤ 1 with τ = 0.3, 0.5 in order to make the trials more fair to the Takamatsu et al. solutions. In particular, since only −30% and −50% changes in U G were considered in that paper, it seems reasonable to restrict ourselves to the the hyperbox defined by that point and the nominal value. 16
S21
510 500 490
S31
460 450 440
S41
410 400 390 0
25
50
sample
Figure 9: First-order robust results for τ = 0.1 and both bounds on Sout in place. (a) OD30 S21
500
500 480
460
460 S31
480
440
440
420
420
420
420
400 380
400 380
1
25
sample
50
1
25 sample
50
(c) 1R30
520 S21
(b) T. 30
520
S41
S41
S31
S21
520
500 480
Figure 10: Simulation results for maximum negative deviations in UG of 30%. Both upper and lower bounds for Sout are shown, but only the lower bound was applied in the first-order robust case.
S31
460 440 420
S41
420 400 380 1
25 sample
50
Notice that for τ = 0.1 (Figure 9), the first-order robust solution behaves both as expected and as desired—the first order predictions and the actual outlet temperatures stay within the proscribed bounds. However, we are not quite as lucky with τ = 0.3 and 0.5. While the first-order predictions stay above the 17
(a) OD50 S21
500
480
480
440
440
S31
470
400
400
440
440
400
1
25
sample
400 360
50
1
25 sample
50
(c) 1R50
530 S21
500
470
360
(b) T. 50
530
S41
S41
S31
S21
530
500 470
S31
480
Figure 11: Simulation results for maximum negative deviations in UG of 50%. Both upper and lower bounds for Sout are shown, but only the lower bound was applied in the first-order robust case.
440 400
S41
440 400 360
1
25
sample
50
lower bound, as required, the actual temperatures are sometimes in violation. However, this is not entirely unexpected. Recall from Section 2 that our only guarantee is that
G (y (ˆ u, s) , u ˆ, s) ≤
L 2 τ 2
µ
¶ 2 max kDδkp ,
||δ||p ≤1
(31)
where L is the Lipschitz constant for Gy ys + Gs , for all s ∈ Sτ . Thus, here we can expect maximum violations (in absolute value) of the lower bound of L 1352 τ 2 , 2
(32)
since p = ∞. In fact, if we plot the maximum deviaitons found from simulation versus τ 2 , we obtain Figure 12, which clearly shows the expected linear relationship. But how does the first-order robust solution stack up against the alternatives proposed by Takamatsu
18
35
S21
25
500 480
20 S31
460
15
440 420
10
S21
420
S31
5
S41
Max Violation of Lower Bound (ºF)
520 30
S41 0
400 380
0
0.1
0.2
0.3
1
τ2
25
sample
50
Figure 13: Simulation results for the firstorder robust solution corresponding to τ = 0.4164, where τ = 0.3 for simultation.
Figure 12: Maximum bound violation for various values of τ , plotted against τ 2 . The slope of the lines provide estimates for 1352 Li /2 for each lower bound constraint i.
et al.? For 30% uncertainty, the first-order robust approach outperforms the two alternatives on every count: frequency and magnitude of the violations and objective function value. For 50% uncertainty, the results are more mixed. Takamatsu’s solution does very poorly with S21 and S22 in terms of violations, but the over-design results compare very well against the first-order results. It would require more analysis (and information) in order to determine whether or not the over-design is worth the extra 10994 m2 in heat exchanger area. However, this is not entirely the point. The first-order robust approach was formulated mainly for moderate amounts of uncertainty, and ±50% changes are certainly not moderate. However, these severe levels of uncertainty and the resulting constraint violations present an opportunity to demonstrate how the theory may be leveraged to provide robustness for somewhat larger values of τ . For instance, if you ° ° estimate Li and the minimum value of °eTi (Gy (ˆ y , u∗ (τ ) , sˆ) ys + Gs (ˆ y , u∗ (τ ) , sˆ)) D°q that you expect to encounter as you solve the 1-rNLP problem for various values of τ near its current value, Ai , for each inequality constraint, then an approximate overestimate for τ of ατ with
(α − 1) ≥
Li τ 2Ai
µ
¶ 2 max kDδkp , i = 1, . . . , m
||δ||p ≤1
(33)
will approximately ensure no violations for the case that τ is the actual level of uncertainty. This result comes from the observation in (Ref. 1) that (taking for simplicity the case when there are no equality
19
constraints—the result is easily generalized): ° ° Li 2 Gi (ˆ u, sˆ + τ Dδ) ≤ Gi (ˆ u, sˆ) + τ °eTi Gs (ˆ u, sˆ) D°q + τ 2 kDδkp , 2
(34)
for any feasible solution to the 1-rNLP problem, u ˆ. Thus, enforcing the constraint ° ° Gi (ˆ u, sˆ) + ατ °eTi Gs (ˆ u, sˆ) D°q ≤ 0
(35)
will result in no constraint violations as long as the uncertainty set is accurately described by Sτ and ° ° ° ° Li 2 ατ °eTi Gs (ˆ u, sˆ) D°q ≥ τ °eTi Gs (ˆ u, sˆ) D°q + τ 2 kDδkp . 2
(36)
° ° ° ° y, u ˆ, sˆ) ys + Gs (ˆ y, u ˆ, sˆ)) D°q ) with Ai Equation 33 is obtained by replacing °eTi Gs (ˆ u, sˆ) D°q (or °eTi (Gy (ˆ and rearranging the results. For this case study and τ = 0.3, a calculation like this (the values for Li were estimated to be 0.01107, 0.01016 and 0.01155, respectively, from the slopes of the least-squares lines in Figure 12, and the Ai were ° ° estimated to be 78.0, 73.1 and 86.7 by taking the minima of the °eTi (Gy (ˆ y, u ˆ, sˆ) ys + Gs (ˆ y, u ˆ, sˆ)) D°q values calculated from the 1-rNLP solutions corresponding to τ = 0.3, 0.4 and 0.5) yields α ≥ 1.3880, and the corresponding simulation results (the solution was calculated using τ = 0.4164 but the uncertainty level in the simulation is just τ = 0.3) are shown in Figure 13. Notice that indeed, the types of violations observed in Figure 10c have been eliminated. (For purposes of comparison, the scales on the plots in Figure 13 were made to match those in Figure 10 as closely as possible, and as in that figure, deviations in U G o n were chosen from the set ∆U G = − τ2 UˆG + τ2 diag(UˆG)δ | kδk∞ ≤ 1 .) The cost for this improvement in performance is essentially 8658 m2 or an extra 10.3% in total heat exchanger area since the total area required for the τ = 0.4164 solution is 93,020 ft2 .
6
Design of a Reactor-Separator System
Our final case study is the design of a reactor-separator system as studied by Rooney and Biegler in Example 3 of (Ref. 14). The process is depicted in Figure 14. The purpose of the system is to chemically
20
convert reactant A to product C via the reaction system A
k
1 −→
B
k3 ↓
k4 ↓
D
E
k
2 −→
C (37)
which consists of four first-order elementary reactions. The uncertain parameters are the reactions rates ki , i = 1, . . . , 4 with units of time−1 . As in (Ref. 14) we are concerned with the following robust program in the variables V (the volume of the reactor in m3 ), F (the flow rate out of the reactor in mol/time), δ (the fraction of species A and B that is recycled back to the reactor), β (the fraction of species D and E that is recycled back to the reactor) and xa , xb , xc , xd , and xe (the mole fraction of each species at the reactor outlet). min 10V 2 + 5Fmax s.t. Fa0 − xa F (1 − δ) − ca0 V (k1 + k3 ) xa
=0
− xb F (1 − δ) + ca0 V (k1 xa − (k2 + k4 ) xb ) = 0 − xc F + ca0 V k2 xb
=0
− xd F (1 − β) + ca0 V k3 xa
=0
− xe F (1 − β) + ca0 V k4 xb
=0
xa + xb + xc + xd + xe
=1
(38)
xc F ≥ 40 F ≤ Fmax 0 ≤ δ ≤ 1, 0 ≤ β ≤ 1 ∀ (k1 , k2 , k3 , k4 ) ∈ K 3
The known parameters are Fa0 = 100 mol/time, the inlet molar flow rate, and ca0 = 10 mol/m , the concentration of species A at the inlet (and the molar concentration throughout the entire system). In (Ref. 14) the authors compare the full (semi-infinite) solutions of Equation 38 for several different uncertainty sets K. In particular, they simulate a set of data and use it to estimate three different types of statistical confidence regions K for the reaction rates: 1. Individual confidence regions for each ki (Equation 4 in (Ref. 14)), which results in a box uncertainty set K (expressible in the form of Equation 3 with p = ∞). 2. A joint confidence region derived from a Taylor series expansion about the nominal estimates for the 21
Figure 14: Reactor-separator system. Picture from (Ref. 14). ki ’s (Equation 5 in (Ref. 14)), resulting in an ellipsoidal uncertainty set K (expressible in the form of Equation 3 with p = 2). 3. A joint confidence region derived from the (nonlinear) likelihood ratio test (Equation 6 in (Ref. 14)), resulting in a possibly non-convex, nonlinear confidence region K, which cannot be expressed in the form of Equation 3. They then solved Equation 38 using a standard iterative approach. These results (Example 3 in (Ref. 14), the “Robust Controls” case) along with the corresponding first-order robust results for y = (xa , xb , xc , xd , xe , F ) and u = (V, δ, β) (the distinction between control and state variables mentioned although not needed in (Ref. 14)) are shown in Table 4. Note that only V , F and Cost are reported in (Ref. 14), and that the statistical data needed to calculate the box and ellipsoidal confidence regions is available in (Ref. 14).
Form. Nom. Full 1-R Full 1-R Full
Set Type N/A Box Ell. Nlin.
Table 4: Robust Designs for the Reactor-Separator System V Fmax Cost (m3 ) (mol/t) ($×103 ) δ β xa xb xc xd xe 19.08 413.9 570.8 0.974 0.000 0.364 0.414 0.097 0.065 0.060 20.88 468.3 670.5 — — — — — — — 20.71 468.3 663.2 0.992 0.000 0.345 0.413 0.107 0.069 0.066 19.98 434.3 616.5 — — — — — — — 19.57 430.8 598.3 0.978 0.000 0.358 0.412 0.101 0.067 0.062 19.55 425.2 594.8 — — — — — — —
Based solely on the fact that the 1-rNLP solutions have consistently lower cost as compared to the corresponding full semi-infinite solutions, it seems that the first-order robust formulation is underestimating the actual uncertainty effects in some sense. But how do the 1-rNLP system designs perform in the presence of the nonlinear uncertainty assumed most realistic by Rooney and Biegler? To find out, we generate random values of the parameters k by the same process that was used in (Ref. 14): for every random 22
xcF (mol/time)
46
a) nominal
c) ellipsoid
b) box
44 42 40
F (mol/time)
38 480 460 440 420 400 380 360
0
50 sample
100 0
50 sample
100 0
50 sample
100
Figure 15: Simulation results for the reactor-separator problem. The first row plots of the amount of product (species C) produced for the a) nominal, b) box uncertainty and c) ellipsoidal uncertainty cases. In all of the plots the dotted line marks the boundary of the ≥ 40 mol/time constraint. The second row is similar, but contains plots of F. In these plots the dotted lines in the middle of the data represent the nominal values for each case; the dotted lines above the data, when present, are the maximum values as calculated by the first-order robust formulations. value so desired, simulated experimental data like that shown in Table A1 of (Ref. 14) is generated and used to calculate a maximum likelihood estimate for k, which serves as a sample of k from the desired nonlinear probability distribution. The data generation step proceeds as follows. Given a true value of k, k ∗ , values of the mole fractions xa , . . . , xe are calculated for various CSTR residence times (ca0 V /F ) using the given model without recycle (δ = β = 0). Then zero mean measurement noise of known covariance Vm∗ (generated using the Matlab function mvnrnd) is added to the mole fractions. Since we could not determine the original values of k ∗ and Vm∗ , they were taken to be the maximum likelihood estimates corresponding to the data given in (Ref. 14). The results are shown in Figure 15. All six figures correspond to the same series of pseudo-random k-values. Three simulations are represented: the a) nominal case and the first-order robust solutions calculated with b) box and c) ellipsoidal uncertainty. Simulations using the results in (Ref. 14) are not given because the information given in that paper does not allow one to uniquely identify their solutions. Briefly, the figures show that frequent constraint violations are to be expected with the nominal design, the box uncertainty case is overly conservative, and the ellipsoidal uncertainty case is roughly an improvement over both of the others (few violations and not overly conservative). Note that even with a 23
full solution for the rNLP problem subject to a nonlinear confidence region for the parameters, we would expect some number of violations inversely proportional to the confidence level α. However, the number of violations obtained in the first-order robust, ellipsoidal uncertainty case may be too frequent in some cases. Depending on the physics and economics of the process it may be advantageous to back-off a little bit more using the procedure outlined in Section 5. In conclusion, while our results for this case study are approximate in the sense that we were not privy to the true values of k ∗ or Vm∗ , or to the full semi-infinite solutions (other than the optimal values of V and Fmax ), it seems that the first-order robust formulation does give two reasonably robust designs—one that is overly conservative and another that should be acceptable either on its own or after a slight adjustment via approximation and leverage of the relevant Lipschitz constant as outlined in Section 5. This case study also raises two issues for future work. First, in the case when there is some discretion available to the modeler, does it matter how the variables are split between the y (state) and u (control) vectors? If so, do the differences tell us something about which split should be used in the control system? Second, in (Ref. 14), the problem is also solved with the controls indexed across the various discrete values of the parameters. These solutions represent the case when the controls may be used to counteract the effects of the parametric uncertainty, which is often referred to as the two-level problem (Ref. 9, 18). Is it possible to come up with “first-order” formulations for these sorts of problems?
7
Conclusions
This paper presents the results of applying the first-order robust nonlinear programming formulation presented in (Ref. 1) to three small engineering design problems: the design of a truss, of a heat exchanger network and of a reactor-separator system. In some cases, the formulation over-estimated the impact of the uncertain parameters; in others the impact was under-estimated. In addition, in the latter case (primarily in Section 5), the violations were shown to be related to the uncertainty set size as predicted by theory. Overall, the methodology seems to do well when the level of uncertainty is moderate, as predicted in (Ref. 1). Small case studies were chosen for this work because a) it seemed appropriate to start with several small problems and b) the relevant literature is generally restricted to small problems. However, the firstorder formulation used in this work should be suitable for much larger problems than most other proposed approaches. In particular, the first-order formulation requires the solution of just a single NLP with ny (1 + ns ) + nu variables, ny (1 + ns ) equality constraints and m inequality constraints. In contrast, the 24
iterative approach described in the Introduction requires the solution of a large NLP (ny x + nu variables, ny x equality constraints and mx inequality constraints, where x is the number of parameter values in the current discretization) and m small NLP’s (ny +ns variables and ny equality constraints) for each iteration. While x can vary greatly, for the purpose of concreteness, consider the case of an initial discretization consisting of the extreme points of a box uncertainty set. This corresponds to one parameter value for each vertex of the box or x = 2ns , which is easily much larger than 1 + ns (the corresponding factor for the first-order case), even for moderate ns . In addition to solving the rNLP problems presented in this work, Monte Carlo simulations were used to compare designs. Overall, the authors recommend this technique for evaluating various robust designs. Data obtained in this way or from an actual system may also be used to reduce the number of constraint violations using the technique outlined in Section 5. (Several constants in the theoretical bounds on the violation are estimated and used to enlarge the uncertainty set by some appropriate amount.) Two additional questions were raised by the third case study which should be investigated further: 1. How do different designations of the variables as states and controls affect the first-order robust results? 2. Can the first-order robust formulation be extended in any way to two-level problems (when a subset of the controls can be chosen so as to compensate for a subset of the uncertain parameters)?
8
Acknowledgements
The authors would like to recognize funding from NSF Grants DMS-0405831 and DMS-0240058.
References 1. ZHANG, Y., A general robust-optimization formulation for nonlinear programming, J. Optim. Theory Appl., To appear. 2. KWAK, B. M., and E. J. HAUG, J., Optimum design in the presence of parametric uncertainty, J. Optim. Theory Appl., Vol. 19, No. 4, pp.527–546, 1976. 3. FLOUDAS, C. A., and GROSSMANN, I. E., Synthesis of flexible heat exchanger networks with uncertain flowrates and temperatures, Comput. Chem. Eng., Vol. 11, No. 4, pp.319–336, 1987. 4. BAHRI, P. A., BANDONI, J. A., and ROMAGNOLI, J. A., Operability assessment in chemical plants, Comput. Chem. Eng., Vol. 20, No. Suppl., pp.S787–S792, 1996. 25
5. OSTROVSKY, G. M., VOLIN, Y. M., and SENYAVIN, M. M., An approach to solving a two-stage optimization problem under uncertainty, Comput. Chem. Eng., Vol. 21, No. 3, pp.317–325, 1997. 6. DARLINGTON, J., PANTELIDES, C. C., RUSTEM, B., and TANYI, B. A., An algorithm for constrained nonlinear optimization under uncertainty, Automatica, Vol. 35, pp.217–228, 1999. 7. RASPANTI, C. G., BANDONI, J. A., and BIEGLER, L. T., New strategies for flexibility analysis and design under uncertainty, Comput. Chem. Eng., Vol. 24, pp.2193–2209, 2000. 8. GROSSMANN, I. E., and SARGENT, R. W. H., Optimum design of chemical plants with uncertain parameters, AIChE J., Vol. 24, No. 6, pp.1021–1028, 1978. 9. HALEMANE, K. P., and GROSSMANN, I. E., Optimal process design under uncertainty, AIChE J., Vol. 29, No. 3, pp.425–433, 1983. 10. VALAPPIL, J., and GEORGAKIS, C., Accounting for batch reactor uncertainty in the nonlinear MPC of end-use properties, Proc. Sys. Eng., Vol. 49, No. 5, pp.1178–1192, 2003. 11. TAKAMATSU, T., HASHIMOTO, I., and OHNO, H., Optimal design of a large complex system from the viewpoint of sensitivity analysis, Ind. Eng. Chem. Process Des. Develop., Vol. 9, No. 3, pp.368–379, 1970. 12. TAKAMATSU, T., HASHIMOTO, I., and SHIOYA, S., On design margin for process system with parameter uncertainty, J. Chem. Eng. Japan, Vol. 6, No. 5, pp.453–457, 1973. 13. ROONEY, W. C., and BIEGLER, L. T., Incorporating joint confidence regions into design under uncertainty, Comput. Chem. Eng., Vol. 23, pp.1563–1575, 1999. 14. ROONEY, W. C., and BIEGLER, L. T., Design for model parameter uncertainty using nonlinear confidence regions, AIChE J., Vol. 47, No. 8, pp.1794–1804, 2001. 15. FOURER, R., GAY, D. M., and KERNIGHAN, B. W., AMPL: A Modeling Language for Mathematical Programming, Duxbury Press, Australia, second edition, 2003. 16. MURTAGH, B. A., and SAUNDERS, M. A., MINOS 5.5 User’s Guide, Technical Report SOL 83-20R, Dept. of Operations Research, Stanford University, Revised July 1998. 17. GILL, P. E., MURRAY, W., and SAUNDERS, M. A., User’s guide for SNOPT 5.3: A Fortran package for large-scale nonlinear programming, 1997. 26
18. ROONEY, W. C., and BIEGLER, L. T., Optimal process design with model parameter uncertainty and process variability, AIChE J., Vol. 49, No. 2, pp.438–449, 2003.
27