Case Studies in Gaussian Process Modelling of Computer Codes Marc C. Kennedy, Clive W. Anderson, Stefano Conti and Anthony O’Hagan Department of Probability and Statistics, The Hicks Building, University of Sheffield, Sheffield S3 7RH, UK Abstract: In this paper we present a number of recent applications in which an emulator of a computer code is created using a Gaussian process model. Tools are then applied to the emulator to perform sensitivity analysis and uncertainty analysis. Sensitivity analysis is used both as an aid to model improvement and as a guide to how much the output uncertainty might be reduced by learning about specific inputs. Uncertainty analysis allows us to reflect output uncertainty due to unknown input parameters, when the finished code is used for prediction. The computer codes themselves are currently being developed within the UK Centre for Terrestrial Carbon Dynamics. Keywords: Bayesian emulator, Sensitivity analysis, Uncertainty analysis, Carbon budget, Vegetation model 1. INTRODUCTION Complicated physical processes are increasingly studied by means of sophisticated mathematical models implemented within computer codes. Before relying upon the explanatory and predictive abilities of any computer simulation, however, a variety of validatory checks should be carried out. The practical complications casting most serious doubts on how adequately and realistically a computer model reproduces reality usually arise from: vague or controversial beliefs about the value of some of the code’s parameters; availability of limited and/or inaccurate driving data; restrictions due to the CPU cost required for actually running the program; and incomplete representation of reality by the model. In order to identify and attenuate the main sources of uncertainty hampering a program’s performance several statistical methods have already been proposed in the classical literature (see [1] for an extensive review). The Bayesian Perspective Over the past decade interesting results have been obtained from addressing problems related to computer model uncertainty in a Bayesian fashion. In particular, a convenient and flexible strategy is based on assigning a semi-parametric Gaussian process prior to the program’s response; details of the technique can be found e.g. in [2]. Preliminary emulation of a code by such means has already been fruitfully exercised on simulators of Further author information: (Send correspondence to Marc Kennedy E-mail:
[email protected])
nuclear radiation releases [3] and on models for vehicle crash and spot welding [4]. Besides relevant specific findings, results from these case-studies emphasise how widely applicable and enlightening the principle of Gaussian process-based emulation can be. The case studies described in this paper utilise a Bayesian emulator to deal with the problems of: prediction: estimation of (possibly functionals of) model outputs at input configurations other than the available ones; uncertainty analysis: exploration of the output distribution induced by assigning some probability distribution to uncertain inputs; screening: identification of which of the code inputs are significantly active, i.e. most influential on the outputs; sensitivity analysis: examination of how model outputs react to changes in appropriate inputs; code verification: detection of bugs in the actual implementation of the program. These issues relate to the code output. In this paper we will not consider possible discrepancies between the code and real data. The simplest sensitivity analysis product derived from the emulator is a set of main effect plots [5]. For each of the emulator inputs, these show how the output responds, on average, to changes in that input. Probability distributions must first be specified so that the averaging correctly accounts for input uncertainty. The Centre for Terrestrial Carbon Dynamics The Centre for Terrestrial Carbon Dynamics (CTCD) is a consortium of British academic and governmental institutions, established to advance scientific understanding of the role played by terrestrial ecosystems in the carbon cycle, with stress on forest ecosystems. CTCD is funded by the Natural Environment Research Council for 5 years as one of its national centres of excellence in earth observation. The ultimate goals of the project are: to gauge carbon fluxes and their uncertainties at different space/time resolutions; to devise methodological, data and instrument advances for reducing these uncertainties; and to deliver relevant findings in accessible formats to the scientific community and to policy makers. These tasks are pursued with the support of a variety of environmental models designed for simulating carbon patterns over different geographical and climatic scenarios. Unfortunately, such models suffer from coarse reproduction of some underlying physical processes and loose connections to driving data. Within the Centre, Bayesian methods are being employed for the assessment of the relevant model (and data) developments required for reducing the uncertainty around predictions. We present three case studies of the Bayesian approach addressing these challenges. The first in Section 2 illustrates the use of sensitivity analysis for model testing. In Section 3 the emulator is used for a range of analyses including the creation of a simplified upscaled model. The final case study is part of an assessment of uncertainty in the UK carbon budget calculation. 2. CASE STUDY 1: SHEFFIELD DYNAMIC GLOBAL VEGETATION MODEL The Sheffield Dynamic Global Vegetation Model, daily version (SDGVMd ) is described in [6]. It is designed to be able to model generic plant functional types over large areas.
150
200
250
300
350
30 10 0 5
6
7
8
9
10
11
4
5
6
7
8
9
10
senescence
20 10 0
0
10
20
mean NEP
30
bud burst
30
leaf life-span
mean NEP
20
mean NEP
30 0
10
20
mean NEP
30 20
mean NEP
10 0 100
0
5
10
15
soil clay%
20
25
0
20
40
60
soil sand%
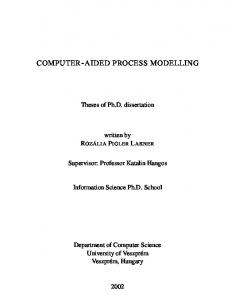
Figure 1. Estimated main effects for SDGVMd inputs. Solid lines represent estimates of the expected output with respect to the unknown input distribution. Dotted lines show 95% pointwise probability bounds for these estimates with respect to the emulator distribution
A variety of extensions and improvements to SDGVMd were undertaken in the first year of CTCD’s operation. Simple sensitivity analysis exercises were designed to identify problems with the evolving code. The five relevant soil and plant inputs that were considered at this stage were: Leaf life span, bud burst temperature, senescence temperature, soil sand content (%) and soil clay content (%). These were selected after talking with plant scientists following a preliminary sensitivity study. The plant scientists also provided a range of values for these inputs, that were plausible for a deciduous broadleaf plant type. An 80-point maximin latin hypercube was generated in the resulting input space and for each point the average was computed over 100 years for the principal model output (net ecosystem productivity, or NEP ). A number of coding errors were uncovered during this process, because the code had not been exercised for such varied combinations of input. Plots of main effects (Figure 1) proved a cheap and effective confirmatory tool for the model developers. They clearly show which of the considered inputs NEP output is significantly sensitive to, and the nature of the various input/output relationships. In calculating the main effects, uniform probability distributions were assumed for these inputs based on the given ranges, while the remainder were fixed at suggested default
10 20 32
34
36
38
40
20
21
22
23
24
25
soil clay %
0 -40 -30 -20 -10
main effect
10 20
soil sand %
0
main effect 30
-40 -30 -20 -10
0 -40 -30 -20 -10
main effect
10 20
values. The plots show that NEP is generally a decreasing function of leaf life span. This goes against the intuition that if leaves live longer they should be able to absorb more carbon, and led the model developers to investigate the phenology routine more closely. They found that a short life span was leading to multiple short growing seasons during the year, and hence higher NEP. A more realistic phenology algorithm has since been developed, and the main effect for leaf life span seen in subsequent sensitivity studies is more realistic (see Section 4). The modellers were satisfied with the relationships revealed by the other plots. Increasing the temperatures of budburst or senescence effectively eats into the growing season at either end of the year, thus reducing total photosynthesis. As expected, these temperatures are critical parameters and effort has been made within CTCD to obtain good phenology information. Output is sensitive to the value of the sand content, but not to clay content over this range. It is clearly important, therefore, to obtain accurate soil sand content data.
800000
1000000
1200000
1400000
3
bulk density (g/m )
Figure 2. Estimated main effects for soil inputs, based on a faulty version of SDGVMd. Dotted lines show 95% pointwise probability bounds
The soils group within CTCD are particularly interested in the sensitivity of SDGVMd to changes in soil parameters. A later version of the model was used to create a series of 9 emulators with soil texture and bulk density as inputs. The remaining inputs were fixed to reflect conditions at 9 test sites. At some of the sites the Gaussian process model did not fit the model output data properly. An example is shown in Figure 2. Here the roughness parameter associated with bulk density was unusually large, resulting in large
5 0
main effect
-5
0 -5
main effect
5
emulator variances. Closer examination of the model led to the discovery of a severe discontinuity in the output as a function of bulk density. This discovery was passed back to the modellers, who were able to identify and correct the problem. Figure 3 shows the main effects using the corrected model.
30
32
34
36
38
40
20
21
22
23
24
25
soil clay %
0 -5
main effect
5
soil sand %
800000
1000000
1200000
1400000
bulk density (g/m 3 )
Figure 3. Estimated main effects for soil inputs, based on a corrected version of SDGVMd. Dotted lines show 95% pointwise probability bounds
3. CASE STUDY 2: SOIL PLANT ATMOSPHERE MODEL The soil-plant-atmosphere (SPA) model [7] is a detailed model of plant processes operating at a 30 minute time step. It therefore requires 30 minute driver variables in order to run. 3.1. The Aggregated Canopy Model (ACM) In practice, predictions are required at a coarser temporal scale using a much more restricted set of input data. One solution to this problem is to build a simplified model at the coarse scale by aggregating model output from the fine scale model, and then fitting simpler functional forms to the resulting input/output data set. This approach is described in [8] and can be summarised as follows: (1) Generate 6561 points in the space of 9 daily inputs; (2) Disaggregate each of these daily points into 30-minute time series data using a deterministic algorithm; (3) Run SPA with the 30-minute data to produce
6561 daily GPP outputs; (4) Fit a simpler response surface to the daily input and output points. The resulting aggregated-canopy model (ACM) is a “big-leaf” model of daily gross primary production (GPP) with 9 inputs. The model is much simpler and faster than SPA, requiring daily driving data. The inputs are listed in Table 1 with their minimum and maximum values. The target output is aggregate GPP for the given day. Motivated by an earlier investigation [8], a variety of analyses have been performed on ACM and SPA. Table 1. Input parameters with valid ranges
Input Symbol Day of year D 2 2 Leaf Area Index (m /m ) L Mean foliar N concentration (g N/m2 leaf are) Nf Mean daily temperature (°C) Tm Half daily temperature range (°C) Thr Irradiance (MJ· m−2 · d−1 ) I Leaf water-soil water potential difference (MPa) Ψd Ambient CO2 concentration (µmol/mol) Ca −2 −1 −1 Leaf hydraulic conductance (mmol·m ·s ·MPa ) Kl
Min. 173 0.1 0.32 3 1 4.5 -2.5 250 0.1
Max. 267 2.5 4.54 20 8 30.6 -0.5 700 3.0
3.2. Emulating SPA The following analysis arises from the recognition that ACM is a kind of emulator of SPA, designed to operate using daily meteorological driving data, when the 30 minute data required by SPA are not available. We expect to meet similar extrapolation problems when applying the more global scale SDGVMd outside the relatively data-rich region of Northern Europe. It was therefore a useful exercise to employ Gaussian process emulation to provide an alternative approximation for the upscaled SPA using far fewer runs. In the current example we were not able to run the code directly. The following simple algorithm was used to select a subset of 150 points from the 6561 SPA runs already available from the ACM fitting procedure. 1. Generate a 150 point maximin Latin hypercube design (D1) in 9 dimensions, with input ranges matching those seen in the SPA run data (Table 1). 2. For each point in D1, select the closest matching point in the big design (excluding those already selected) and add it to the emulator training data. The emulator can now be used instead of ACM to carry out prediction, uncertainty analysis and sensitivity analysis.
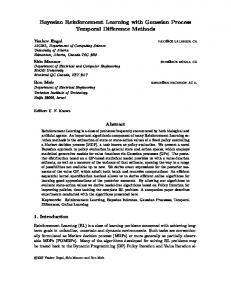
3.2.1. Prediction The 6411 SPA runs not used to build the emulator are available to test the prediction accuracy of the emulator against that of ACM. The emulator root mean squared error (RMSE) was 0.314, compared with RMSE=0.726 for the ACM. Note that the 6411 test runs were used in building ACM, and the performance of ACM might be expected to be even poorer on genuinely unused parameter values. Predicted versus true values of the aggregated SPA output are plotted in figures 4 for both ACM and emulator predictions. Clearly the emulator has smaller errors overall, but not for all regions of the input space. The emulator predicts some small GPP values as being negative. This is physically impossible, and for these values ACM is more accurate because this knowledge is built into the ACM equations. We could of course modify the emulator output so that negative values are set to 0.
15
15
10
10
true.spa
true.spa
As a diagnostic check, we plot the t140 (0, 1) Q-Q plot of standardised errors in Figure 5. There are some points for which the variance is underpredicted, but most (around 95%) of the points are on the line, indicating that overall the posterior variances are consistent with actual errors.
5
5
0
0 0
5
acm.pred
10
15
0
5
em150m
10
15
Figure 4. Fitted versus actual values of the aggregated SPA runs: on the left using ACM and on the right using the emulator. 1:1 lines are dashed, regression lines are solid
3.2.2. Sensitivity analysis Main effects for the emulator inputs are plotted in Figure 6. We assume independent uniform distributions for the inputs according to the ranges in Table 1. The method used in [2] provides an estimate of the uncertainty of the output resulting from the input uncertainty, and a breakdown of the contribution to this uncertainty from each input. The total variance is 3.44, and the percentage contributions to this variance from each input are Nf (41.08%), D (18.96%), L (8.63%), I (7.34%), Ca (4.87%), Tm (4.27%), Ψd (0.67%), Kl (0.53%), Thr (0.38%). The remaining 13.27% is due to joint effects and higher order interaction effects. These results are consistent with the findings given in [8], yet were obtained in a much simpler way using far fewer runs of SPA.
6 4 2 0 −2
Standardised residuals
−4 −6
−6
−4
−2
0
2
4
6
T(140) quantiles
Figure 5. Quantile-Quantile plot for standardised residuals
3.2.3. Uncertainty analysis Uncertainty analysis is concerned with quantifying the uncertainties in predictions that arise because one or more of the code inputs are unknown. As an example, consider the prediction of GPP at a single site on a given day (site 7000, day 200). Values are available from a data file for each of the inputs and driving data required to make this prediction. The ACM prediction assuming these inputs are exactly known is 3.59. Now suppose that just 1 of these inputs, the irradiance, is uncertain with a N (15.08, 9) distribution. The value 15.08 is the value given in the data files, and a variance of 9 was chosen to match the distribution of errors in irradiance prediction (Figure 2 of [8]). A simple method of propagating this uncertainty is to use a Monte Carlo uncertainty analysis. Running ACM for each of 5000 irradiance inputs sampled from this distribution (with all other inputs fixed) produces a sample from the ‘true’ uncertainty distribution of the GPP output of ACM, which we can obtain in this case only because runs of ACM are essentially instantaneous. The uncertainty distribution has mean 3.57 and variance 0.05. For comparison, we built an emulator of ACM using 100 runs of ACM. The emulator prediction assuming the inputs are all known is 3.59 (with variance 0.005 due to emulator uncertainty). The emulator prediction assuming a N (15.08, 9) distribution for irradiance is 3.56 (with variance 0.004 due to emulator uncertainty). The variance of the prediction is estimated as 0.06. The emulator approximates the monte carlo uncertainty analysis results very accurately using far fewer model runs. 4. CASE STUDY 3: UNCERTAINTY IN THE UK CARBON BUDGET A major deliverable of CTCD will be an estimate of the UK carbon budget, in April 2004, using SDGVMd. We will quantify uncertainty on the UK carbon budget using Bayesian methods, recognising uncertainty in major model parameters defining vegetation and soil properties. Since SDGVMd is a point model, the first step is to consider uncertainties
210
220
230
8 2 0.5
1.5
2.0
2.5
1
15
20
8 GPP 4
6
8
5
-1.0
-0.5
20
25
30
8 GPP
6
8
2
4
GPP
2 -1.5
15
irradiance
6
8 6 4 2
-2.0
10
half temp. range
water potential difference
4
2 2
mean temp.
-2.5
3
6
8 6 2 10
2
foliar nitrogen
4
GPP
6 4
GPP
2
5
GPP
1.0
leaf area index
8
day
4
200
4
190
4
GPP
6
8 2
4
GPP
6
8 6 4
GPP
2
180
180
190
200
210
C02 concentration
220
230
0.0
0.5
1.0
1.5
2.0
2.5
3.0
leaf hydraulic conductance
Figure 6. Main effects for each of the input parameters. The solid line is the median. The dashed lines correspond to the 95% point-wise probability band
at individual sites. Nine sites were selected to be representative of the varied climatic conditions in the UK. The code used here is a more developed version of the one described in Section 2. We performed a more extensive sensitivity study, this time to identify the inputs that would potentially contribute most to the output uncertainty. Figure 4 shows the results from an assessment of 14 plant functional type inputs. Using the same variance decomposition technique as in Section 3.2.2, the most important inputs were found to be leaf life span (days), initial minimum stem rate (millimetres), maximum age (years) and water potential (M Pa). Plant modelling experts were then questioned on their beliefs about these inputs to elicit probability distributions. Different plant functional types were believed to have different probability distributions for some inputs. Each site represents an area covering 10km2 , so the distributions also account for the fact that multiple species are likely to be represented. Maximum age was agreed as having a N (180, 100) distribution for all types. Leaf life span was agreed as having a N (200, 625) distribution for deciduous types, N (1500, 10000) for evergreen needleleaf and N (1200, 10000) for evergreen broadleaf types. The logarithm of the minimum stem rate was assigned a N (ln 0.006, (0.5 ln 1.5)2 ) distribution for a broadleaf type and a N (ln 0.0015, (0.5 ln 1.5)2 ) distribution for a needleleaf type. Wa-
180
190
200
200
65
18
20
22
3.0 3.2 3.4 3.6 3.8 4.0 4.2 water potential
4.5
5.0
5.5
6.0
176 180 184 188
70
4.0
24
10
senescence memory
4.5
5.0
5.5
6.0
bud burst max
12
14
16
sensescence sensitivity
0
5
10
15
senescence limit
176 180 184 188
bud burst limit
176 180 184 188
1.0
bud burst min threshold
176 180 184 188 60
4.0
leaf mortality index
176 180 184 188
55
0.9
176 180 184 188 0.60 0.65 0.70 0.75 0.80 0.85 0.90
leaf life span
50
0.8
xylem conductivity
176 180 184 188 180
0.7
wood density
176 180 184 188
160
176 180 184 188
0.20 0.22 0.24 0.26 0.28
max. age
176 180 184 188
170
176 180 184 188
160
176 180 184 188
176 180 184 188
176 180 184 188
Dc_Bl input main effects. NEP output
0.0035
0.0040
0.0045
initial min. stem rate
0.08
0.09
0.10
0.11
0.12
seeding density
Figure 7. Main effects for each of the input parameters. The solid line is the median. The dashed lines correspond to the 95% point-wise probability bands. The test was carried out using a central UK site and a set of input ranges appropriate for a deciduous broadleaf tree
ter potential was agreed to be distributed as N (3, 0.25) for deciduous broadleaf types, N (4, 0.25) for evergreen broadleaf types, and N (3.5, 0.25) for both needleleaf types. A realistic distribution for the leaf mortality index input has yet to be determined. The sensitivity study was repeated with the refined distributions and ranges to see if anything new would show up. At this point seeding density emerged as a significant input. An uncertainty analysis was carried out at each of the 9 sites, yielding estimates for the mean and variance of NEP output averaged over the decade 1991–2000. For comparison we produced a set of plug-in estimates by running SDGVMd with input parameters fixed at the means of their input distributions. Results are given in Table 2. Even after accounting for uncertainty in the emulator, the output means differ noticeably from the plug-in estimates, suggesting non-linearity. In all but Kielder, the plug-in estimates are overestimating the mean output. We recognise these variances will be underestimates if any of the key inputs, such as seeding density and leaf mortality index are artificially assumed to be fixed or given the wrong distribution. Plant scientists have so far been unable to specify distributions for these inputs, but the process described above has clearly
Table 2. Uncertainty analysis results for NEP at the 9 test sites for a deciduous broadleaf plant functional type. The values in parentheses are variances of the mean estimate due to the emulator. Plug-in estimates are obtained by running SDGVMd with input values fixed at their means
Site
Output mean
Output variance
plug-in estimate
S. Ballater (Scotland)
78.10 (1.59)
210.20
89.31
Kielder
65.85 (3.77)
239.73
43.5
New Forest (Hampshire)
207.23 (4.97)
1133.78
269.23
Dartmoor
64.88 (7.63)
472.93
99.93
Lowland (Scotland)
66.35 (7.26)
418.42
73.34
E. Keswick (Lake District)
45.38 (2.56)
183.39
55.19
Barnstaple
137.52 (3.31)
785.95
162.02
Milton Keynes
217.48 (11.54)
494.11
228.43
Stockten on the Forest (Nr York)
218.86 (2.35)
241.39
234.84
identified these as issues to be resolved by further research. Our results also suggest that the different sites can yield different sets of key inputs, and the process of eliciting prior distributions from the plant scientists will need to be repeated until all uncertainties are accurately represented. 5. CONCLUSIONS The proposed Bayesian approach to computer experimentation has already supplied useful insights to CTCD modellers and is expected to yield profitable responses when applied to more demanding test beds. Uncertainty and sensitivity analyses will be integral parts of all major CTCD deliverables. The efficiency of the emulator was clearly demonstrated in the case of the aggregated SPA model, where greater accuracy was achieved using only a fraction of the code run data used to derive ACM. Identifying the most significant uncertainty sources will help determine how best to focus future resources in order to reduce overall uncertainty. ACKNOWLEDGMENTS The authors are grateful to Mark Lomas, Mat Williams and their colleagues for assistance in running the computer models, and to Ian Woodward for probability distributions on the input parameters to SDGVMd. Andreas Heinemeyer provided soil data for SDGVMd. The project is funded by the Natural Environment Research Council, contract number F14/G6/105.
REFERENCES 1. A. Saltelli, K. Chan, and E. M. Scott, editors. Sensitivity analysis. Wiley Series in Probability and Statistics. John Wiley & Sons Ltd., Chichester, 2000. 2. J. E. Oakley and A. O’Hagan. Probabilistic sensitivity analysis of complex models: a Bayesian approach. J. Roy. Statist. Soc. Ser. B, 2004. To appear. 3. M. C. Kennedy and A. O’Hagan. Bayesian calibration of computer models. J. R. Stat. Soc. Ser. B Stat. Methodol., 63(3):425–464, 2001. 4. M. J. Bayarri, J. O. Berger, D. Higdon, M. C. Kennedy, A. Kottas, R. Paulo, J. Sacks, J. A. Cafeo, J. Cavendish, C. H. Lin, and J. Tu. A framework for validation of computer models. In D. Pace and S. Stevenson, editors, Foundations for Verifications and Validation in the 21st Century, 2002. 5. A. Saltelli, S. Tarantola, and F. Campolongo. Sensitivity analysis as an ingredient of modeling. Statist. Sci., 15(4):377–395, 2000. 6. M. R. Lomas, F. I. Woodward, and S. Quegan. The role of dynamic vegetation models. Technical report, University of Sheffield, Sheffield UK, 2002. 7. M. Williams, E. B. Rastetter, D. N. Fernandes, M. L. Goulden, S. C. Wofsy, G. R. Shaver, J. M. Melillo, J. W. Munger, S. M. Fan, and K. J. Nadelhoffer. Modelling the soil–plant– atmosphere continuum in a Quercus–Acer stand at Harvard Forest: the regulation of stomatal conductance by light, nitrogen and soil/plant hydraulic properties. Plant, Cell and Environment, 19:911–927, 1996. 8. M. Williams, E. B. Rastetter, G. R. Shaver, J. E. Hobbie, E. Carpino, and B. L. Kwiatkowski. Primary production of an arctic watershed: an uncertainty analysis. Ecological Applications, 11(6):1800–1816, 2001.