In Proceedings of the International Conference on Cognitive Modeling, 2004. 302-307. Mahwah, NJ: Lawrence Erlbaum.
Categorical Data Displays Generated from Three Architectures Illustrate Their Behavior Kevin Tor (
[email protected]) Steven R. Haynes (
[email protected]) Frank E. Ritter (
[email protected]) School of Information Sciences and Technology, The Pennsylvania State University University Park, PA 16802
Mark A. Cohen (
[email protected]) Business Administration, Computer Science, and Information Technology, Lock Haven University Lock Haven, PA 17745
Abstract The following introduces CaDaDis, an extension to the architecture-independent VISTA toolkit. CaDaDis creates visible accounts of cognitive model behavior through a set of Categorical Data Displays. It includes a standard Pert Chart showing tasks by category (or resource), a Nonstandard Pert Chart that shows the temporal dependencies, and a Gantt chart that helps show occurrences of agent events along a time line. Perhaps most usefully, it can display categorical and numeric data generated by models as they run. Structured messages are sent on behalf of the cognitive model by several example script-based interfaces. This paper presents a series of examples of CaDaDis with three different cognitive architectures. The displays, for example, show that the sample models included in the Soar distribution have different structures.
Introduction Textual traces from cognitive models are often considered unhelpful by observers trying to understand them, and these traces are essentially unintelligible to non-programmers. Modelers and subject matter experts want to know the structure of models as well as how they work (Avraamides & Ritter, 2002; Councill, Haynes, & Ritter, 2003). One approach that has been relatively well received is to provide a graphic representation of a model’s internal processing and behavior. Where this has been done, observers have at least thought they understood the models more, and in some cases have seen and learned new things about their models (Ritter, Jones, & Baxter, 1998; Ritter & Larkin, 1994). We present a general tool for displaying categorical data generated by cognitive models. It can be and has been used by multiple cognitive architectures to display their internal processing. It is based on a no-cost toolkit, implemented in a widely used programming language, and should help many models to be understood. The display tool is designed to support the reuse that Newell (1990) referred to in his Unified theories of cognition, in this case by helping models be understood and by being used itself in multiple applications. It appears to take an expert programmer about an afternoon to start to use CaDaDis with an architecture that they know, and about an hour for a typical graduate student to use it with an new model within an existing supported architecture. In the first case, the user must adapt the archi-
tecture to pass information that they want displayed to CaDaDis through a socket. For ACT-R, for example, this meant creating a socket and modifying an existing function in the architecture to pass information when a rule is fired. In the second case, the user has to download CaDaDis, and load into the ACT-R Tcl interface a file, and load a file into the ACT-R Lisp system. In each case, a user has to get permission to use Vista and download it through a web site. This is an update on a tool that we have previously introduced to a different community (Tor, Ritter, Haynes, & Cohen, 2004). We report here several new features and new analyses and this is directed at cognitive modelers, not the simulation and synthetic forces community. We start by describing several displays that have inspired us and provide lessons for our design. We provide example displays created quickly to work with Soar, ACT-R, and the Jess agent architecture. These displays helped us understand the models we did not write ourselves, and show the types of knowledge that can be gleaned from models using categorical displays of their internal processing. We hope that readers are inspired to create such displays for their models, and that they use our system, CaDaDis.
Previous Systems A wide range of graphical displays have been used by cognitive modelers. Not every model and not every cognitive architecture has had one, but the displays that have been available appear to help explain models. The following is a brief summary of the previous work in graphical displays for cognitive models. A slightly more comprehensive review of these systems is available (Tor, et. al., 2004). Gray, John, and Atwood (1993) implemented, by hand, some task analysis for a new and old telephone workstation in CPM-GOMS. This study gave us the groundwork for our nonstandard Pert Chart, where resources appear on the left of the display. The main problem with this was the lack of automation. Automation was introduced with APEX (John, Vera, Matessa, Freed, & Remington, 2002). Pert charts were created with a CPM-GOMS approach with such success that it was later added to the ACT-R architecture.
The Developmental Soar Interface (DSI) and the Tcl/Tk Soar Interface (TSI) provide graphical traces of running Soar models automatically (Ritter, Jones, & Baxter, 1998; Ritter & Larkin, 1994). The DSI showed that cyclical behavior can be found in some models and the TSI provided multiple views of model’s behavior. The connectionist model community initially had rather poor interfaces that would print out all of the nodes each epoch (e.g., the early PDP toolkits). But the users could at least see the processing of their model. Later versions showed it helps to be able to visualize model behavior. Among the desired functionality motivating CaDaDis development are searching for cyclical model behavior and providing multiple views, two tasks shown to be important in previous work on cognitive model data displays and assumed to be important for any cognitive architecture. These visualizations will aid novice to experienced programmers, and perhaps prove useful for even nonprogramming model users.
CaDaDis We have created a general tool for displaying categorical data generated by cognitive models. The system is implemented in Java and VISTA (the latter we explain below). We provide a general rational for the design first, and then explain in order of increasing complexity the displays that we and others have created.
The Use of Java and VISTA We chose to create these displays in Java because it is portable and increasingly used to create displays for cognitive models (e.g., ACT-R's new interface, and JACK's eye and hand: Norling & Ritter, 2001). We used the Visualization Toolkit for Agents toolkit (VISTA) (Taylor, Jones, Goldstein, & Frederiksen, 2002) because it supports creating displays and a variety of communication channels between the display and cognitive models. VISTA is supported and available under a non-commercial license from Soar Technology. As part of this project we also created and used a VISTA tutorial web site (acs.ist.psu.edu/vista) to learn VISTA. VISTA facilitates the creation of model visualization applications. This toolkit provides an infrastructure for communication between models and VISTA enabled applications. Using this communication channel, models can convey changes in their internal attributes to a listening VISTA enabled application, which then updates its display to reflect these changes. The VISTA toolkit also provides the ability to record and playback model activity (Soar Technologies, Inc., 2002). Importantly VISTA includes useful Java objects and methods for creating displays of cognitive models (including the ability to parse and deparse objects communicated), as well as a series of examples that can be modified and reused. Using VISTA as the infrastructure for communication between a cognitive architecture and a visualization tool eliminates a significant amount
of development time and effort. VISTA proves to be well designed, easy to use, and stable. VISTA also provides classes to represent some of the major categories of objects based on an analysis of cognitive models, including goals, events, time, and so on, along with corresponding sample display methods. These classes are not directly available in Swing or other Java packages. Also, VISTA's connection manager (via SoarComm) offers some remote discovery capabilities, communication utilities, and usability additions that have often been built to support model/interface communications.
CaDaDis Design A VISTA window displays the objects traced in the simple (modified-PERT), Pert, or Gantt view. All views are generated in parallel and a view menu allows the user to toggle between views. Advanced options will be added as this project continues. Each view consists of a scrollable canvas for graphical objects. Objects represent actions of the model and are specified as labeled rectangles. Each object consists of a unique id, an associated code (operator name, etc.), start and end times for execution duration, and an optional list of constraints drawn as lines. Currently, a default value of 50 ms is being used for Soar objects in the Gantt view. This is our assessed time for a decision cycle in the model’s run. Constraints are displayed as lines between rectangles. They represent dependencies for the target action. If constraints are not specified, a default constraint line can be drawn from the previous action’s rectangle. A useful design guideline when developing distributed systems is to keep the interface between the client and the server simple. It is important to realize that exposing the visualization client’s objects and their methods can tightly couple the client and the cognitive architecture. For complex displays, this level of dependency can be necessary and beneficial, and VISTA supports such complex displays. However, if the designer is not careful strong dependencies can make the system difficult to maintain, and, for simple displays, provide no added benefit. As a result, when designing CaDaDis the classes exposed to the cognitive architecture were minimized. Our only public datatype is a CaDaDis Object (CDDObject). It can be used to represent any event in the execution of the model whether it is the firing of a rule, or the entrance into a new problem space, state or operator. The generality afforded by this implementation provides flexibility to the users of this tool.
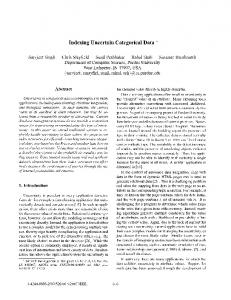
Simple Charts A simple version of the categorical data from a model can be plotted. It is sometimes called a modified PERT. It can be quite helpful, for example, to sequentially chart Soar operators in a model. Figure 1 shows a CaDaDis display of operator firings for the Waterjug demo included with the Soar 8 distribution. The model has four operators (seen on
the left as codes) and each point on the right side represents the firing of the corresponding operator. Creating this display required building a CaDaDis and a Soar-Tcl interface file, now included in CaDaDis. This file contains generic Soar rules used to generate data for CaDaDis such as states and operators from any Soar model. Figure 1 shows that this task had interesting combinations of operators and no clear cycles.
CaDaDis but no models have been yet instrumented to use it. A new modification we are working on, called the Modified Gantt chart, will examine the life of an operator from proposal to completion with respect to the time line. A dashed line will represent an operator that is proposed. When the operator is selected, the dashed line will become a solid line.
Interface Features These displays provide enough functionality that users will want to take advantage of their features, but will need support to do so. Table 1 lists several of the manipulations users can perform to their displays. Features in the table with an asterisk (*) are in the process of being implemented.
Example Uses Figure 1: A simple display of a Soar model (Waterjug) with a categorical display of the operators as they are executed. The order of the codes is initially arbitrary in all of these displays. They can be set by the user to more accurately reflect their meaning. The order can be modified dynamically by moving them with the mouse, by loading a file, or, by default, they are put in order of first use.
Pert Charts A Pert chart is a display used to do task analysis. It is used to estimate the time to completion for a particular task (Harris, 1996). Based on dependencies of actions, subtasks can be started earlier if they are independent. Therefore, the end result of the Pert chart is the realization of the critical path of a task—what is the sequence of actions to complete a task in the least amount of time? There are two variations on the Pert chart in CaDaDis. The first is the Standard Pert chart implementation. The Standard Pert chart is a simple drawing canvas that contains a set of rectangles representing tasks and arrows representing dependencies between tasks. Once the model has completed, the view can adjust to show the critical path. This is available in CaDaDis but no models have been yet instrumented to use it. Doing so would require modifying an architecture to pass the relevant information of start and stop times, and the actions' dependencies. The other is based on John’s CPM/GOMS Pert chart, a Nonstandard Pert chart, where codes are located on the lefthand side of the window. Objects are drawn in the row of corresponding to their category.
Gantt Charts A Gantt chart uses a time line to show execution time for a particular action. The codes are on the left side as tasks in the Nonstandard Pert chart and rectangles are on the right canvas. The size of the rectangle is based on time of execution with respect to the time line. This is available in
We present some examples to illustrate CaDaDis and its use. The first example displays operator applications. It uses an example Soar model in the Nonstandard Pert View, which is easy to create — the operator names are placed in the left pane and large or small boxes are drawn along the line corresponding to the operator that fires in the right pane. All the figures here use the Nonstandard Pert. As a default, dependencies are specified as the box representing the last operator or production that fired. A portion of this display is shown in Figure 2. Soar provides a set of demos with its TSI distribution. We used these demos as a test set for CaDaDis. Each demo was run in CaDaDis to see if any interesting behavior could be found. (Figure 1 showed the demo model for the Waterjug problem.) At this stage of development, CaDaDis receives only operators from the Soar models to display. However, even with operators, the demo models can be categorized. Table 1: CaDaDis Features. • • • • • • • • • • • •
Rescale x and y, and the objects Choose fields to display (i.e., hide some fields to create abstract display, or highlight remaining fields) Print the figure to a printer* Save the figure to file, both as a jpeg and semantically Change the type of display and provide a best-effort display under the new type * Provide information about CaDaDis and the type of display Provide help functions * Set display options, such as autoscroll and absorb new codes (or generate an error) Gantt timeline in milliseconds or decision cycles * Reorder categories in nonstandard Pert by mouse or by loading a file Logging and log replay support for Soar and ACT-R Other architectures including: JACK, and CAST *
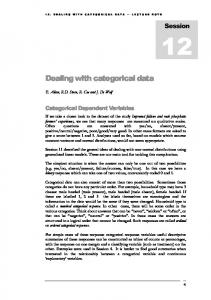
The next demo examines the 8-puzzle problem. This consists of 8 tiles numbered one through eight on a 3x3 board. There is a space to allow movement. A series of movements is performed to achieve the proper configuration (numerical order) of the tiles. The demo model attempts to solve the puzzle. The model uses two operators: evaluateoperator and move-tile. The first operator examines the current board configuration to determine the next move and the second, predictably, moves one of the tiles. The initial run showed the model examining the board, then moving the tile or tiles, before repeating this cycle (Figure 2), and sometimes not using an operator.
Figure 2: Operator trace of the Soar 8-puzzle model. The Tower of Hanoi is a famous task where a number of disks in ascending size are found on one peg. The Soar model consists of one operator, move-disk. A run of CaDaDis does not provide an interesting picture, as shown in Figure 3, but it does display the model’s behavior. This result suggests that operator-based traces require more detailed attribute displays to expose meaningful information about model behavior. These has since been added; displays using this feature are described below. Some models employ a Wait operator. No decision needs to be made because the world does not require (or allow) a decision. The Blocks World model shows this operator in use (Figure 4). Another example of a model using the wait operator is found in a run of dTank (acs.ist.psu.edu/dTank). dTank is an environment that allows models to play in a simple tank game. In this example, CaDaDis displays the operator applications in a simple Soar dTank model. Once again, dependencies are specified as the previously entered state.
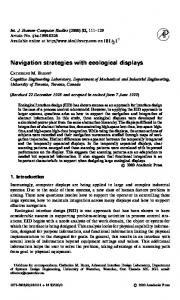
Our dTank trace (Figure 5) comes from a basic tank agent. This display contains the portion of the run where the model has just found an opponent to attack. The horizontal portion of the trace represents the idle period (of Wait operators) of the tank waiting for something to come into view. The first set of spikes show the recognition of the opponent. The waiting period is waiting for more perceptions to arrive. The decision to attack is made and shown with the subsequent spikes in the trace. This is a nice illustration of agent behavior in the dTank environment. In revisiting the 8-puzzle demo, we implemented an extension to the model that would give more information about the model. Similar to the Tower of Hanoi model, most of the action concerns the operator attributes. Our extension pulled information about the attributes out of the model and sent them to CaDaDis as categorical data. Figure 6 presents the 8-puzzle model run with an initial configuration that is unsolvable. We added one Soar rule and a Tcl function to the model to pass attributes from the operator of the tiles as they moved. Cyclical behavior emerging from the model as Soar attempts to solve the puzzle in now visible. Also, with some inspection, one can see that the blank tile is labeled as Tile 3 because this tile is not used. Finally, because of the VISTA toolkit’s architecture independence, CaDaDis can be used by a number of different cognitive architectures. The final examples are from models written in ACT-R and Jess. Production names are passed to CaDaDis from the model as they fire. The instance of a production firing is represented by a dot in the
Figure 5: A Soar dTank model trace of tank behavior. Figure 3: Operator trace of the Soar Tower of Hanoi model.
Figure 4: Blocks World example of wait operator.
Figure 6: Unsolvable 8-puzzle problem using an attribute display to show individual tile movements.
graph. The ACT-R model traced in Figure 7 is a Serial Subtraction model being revised (Ritter, Avraamides, & Councill, 2002; Ritter, Reifers, Klein, Quigley, & Schoelles, in press). The model starts with a four-digit number and continually subtracts seven. This behavior is naturally cyclical as the figure shows. The productions consist of checking for the need to borrow, the act of borrowing, and simple subtraction. This portion of the trace illustrates some cycles where the subtraction was simple but ends with a need to borrow from the hundreds position, hence the downward spike. This display uses CaDaDis and a Lisp file addition to ACT-R (now included with CaDaDis) that passes information to CaDaDis when a rule fires. Recently, CaDaDis has been successfully used with Jess (Friedman-Hill, 2003). A Jess model for dTank used in a programming languages course was adapted to send strings to CaDaDis. The project took three hours but included generating a reusable interface for Jess and CaDaDis. A display of a Jess model in Figure 8 shows that it has similar behavior to the Soar dTank model. The model waits and scans for enemies. Then, it aims and fires until the enemy is out of sight or dead. The display shows that Jess works on productions, and that this model is simpler than the Soar model.
Conclusions In addition to providing a useful tool for understanding cognitive models and providing a documented and reusable display in VISTA, creating CaDaDis provided several lessons for cognitive modeling and behavior representation. These lessons can be grouped into lessons about our CaDaDis system and the models examined, about VISTA as a tool, and for this process. We take them up in turn.
Lessons about CaDaDis Preliminary results show that CaDaDis is successful in showing model behavior. It can create unique displays showing information with more clarity than textual traces. It provides nice displays of model activity in two different cognitive architectures and an agent architecture. Furthermore, it can prove useful in debugging cognitive models by analyzing rule usage, whether certain operators fire, and so on. The CaDaDis displays included here have become easy to create because creating new displays can be done by modifying previous examples. The displays work with multiple architectures and provide multiple views. They need to be expanded to include more of the functionality in Table 1. To realize their potential, these displays need to be reused by others. To this end we have put these displays on the VISTA tutorial web site (acs.ist.psu.edu/vista). The displays here created in CaDaDis suggest that the ability to help models explain their behavior can be significantly enhanced with CaDaDis and the VISTA toolkit. For many applications of VISTA, CaDaDis can serve as a library, providing much of the additional graphics needed. For systems that need more complex graphics, or that need to modify the displays we have created, the source code for the graphic displays that make up CaDaDis have been designed to be extended and are documented (acs.ist.psu.edu/CaDaDis). We thus find that we will need libraries of graphical displays for cognitive models as much as we need libraries of model components. It may be possible, however, that interfaces are more reusable.
Figure 7: Serial Subtraction Model in ACT-R.
Lessons about Vista Developing the interface to CaDaDis required extending the VISTA toolkit. The VISTA source code and manual are both available facilitating changes such as those we required. VISTA provides a base library for 2d-drawing that can be taken advantage of. However, in the example application included in the VISTA distribution, there were no classes related to the specific categorical display objects required for CaDaDis.
Figure 8: A Jess dTank model trace of tank behavior.
The creation of CaDaDis also provides a chance to reflect on the VISTA toolkit as it is used externally. We found that VISTA requires some overhead to learn and to create displays, but provides a worthwhile framework for creating these displays and provides a productive approach to reuse.
This level of understanding is not required unless the user wishes to modify the or extend these displays. In summary, VISTA is a well-designed, easy to use, and powerful tool. Its use can reduce the development time of cognitive model visualization tools and allow the developer to concentrate on the domain specifics of the application—as opposed to the communication infrastructure.
Reuse in Cognitive Models The reuse of displays with ACT-R, Soar, and Jess suggests that the first major reuse of cognitive modeling behavior may be in interfaces and not of knowledge. This might not be that surprising, given that the interface code looks more like the code that currently gets reused. Interfaces make up about 50% of most systems (Myers & Rossen, 1992). If this is true, which we believe it can be for cognitive models and agents using CaDaDis and VISTA, this resuse is a very worthwhile result.
Acknowledgments This work was supported by the Office of Naval Research through a subcontract from Soar Technology, contract VISTA03-1. Doug Hogan, Andrew Reifers, Glenn Taylor, and Al Wallace provided useful suggestions about the design and implementation of these displays and about this presentation. Isaac Council and Andrew Reifers have provided extensions to CaDaDis. Doug Hogan and Andrew Reifers generated displays for this paper. Geoff Morgan and three anonymous reviewers provided useful comments.
References Avraamides, M., & Ritter, F. E. (2002) Using multidisciplinary expert evaluations to test and improve cognitive model interfaces. In Proceedings of the 11th CGF Conference. 553-562, 02-CGF-100. Orlando, FL: U. of Central Florida. Councill, I. G., Haynes, S. R., & Ritter, F. E. (2003). Explaining Soar: Analysis of existing tools and user information requirements. In F. Detje, D. Doerner, & H. Schaub (Eds.), Proceedings of the Fifth International Conference on Cognitive Modeling. 63-68. Bamberg, Germany: Universitats-Verlag Bamberg. Friedman-Hill, E. (2003) Jess in Action. Greenwich, CT: Manning Publications, Co. Gray, W. D., John, B. E., & Atwood, M. E. (1993) Project Ernestine: Validating a GOMS analysis for predicting and explaining real-world task performance. H u m a n Computer Interaction, 8(3), 237-309.
Harris R. L. (1996) Information graphics: A Comprehensive illustrated reference. Atlanta, GA: Management Graphics. John, B., Vera, A., Matessa, M., Freed, M., & Remington, R. (2002). Automating CPM-GOMS. In Proceedings of the CHI‘02 Conference on Human Factors in Computer Systems. 147-154. New York, NY: ACM. Myers, B. A., & Rossen, M. B. (1992) Survey on user interface programming. In Proceedings of CHI'92. 195-202. New York, NY: ACM Press. Newell, A. (1990) Unified theories of cognition. Cambridge, MA: Harvard University Press. Norling, E., & Ritter, F. E. (2001). Embodying the JACK agent architecture. In M. Stumptner, D. Corbett, & M. Brooks (Eds.), AI 2001: Advances in Artificial Intelligence. Proceedings of the 14th Australian Joint Conference on Artificial Intelligence. 368-366. Berlin: Springer. Ritter, F. E., Avraamides, M., & Councill, I. G. (2002) An approach for accurately modeling the effects of behavior moderators. In Proceedings of the 11th Computer Generated Forces Conference. 29-40, 02-CGF-002. Orlando, FL: U. of Central Florida. Ritter, F. E., & Larkin, J. H. (1994). Using process models to summarize sequences of human actions. HumanComputer Interaction, 9(3), 345-383. Ritter, F. E., Jones, R. M., & Baxter, G. D. (1998) Reusable models and graphical interfaces: Realising the potential of a unified theory of cognition. In U. Schmid, J. Krems, & F. Wysotzki (Eds.), Mind modeling - A cognitive science approach to reasoning, learning and discovery. 83-109. Lengerich, Germany: Pabst Scientific Publishing. Ritter, F. E., Reifers, A., Klein, L. C., Quigley, K., & Schoelles, M. (in press). Using cognitive modeling to study behavior moderators: Pre-task appraisal and anxiety. In Proceedings of the Human Factors and Ergonomics Society. Soar Technology, Inc. (2002). VISTA Developer's Handbook. Soar Technology. www.soartech.com/research. downloads.vista.php Taylor, G., Jones, R. M., Goldstein, M., & Frederiksen, R. (2002) VISTA: A generic toolkit for visualizing agent behavior. In Proceedings of the 11th Computer Generated Forces Conference. 29-40, 02-CGF-002. Orlando, FL: U. of Central Florida. Tor, K., Ritter, F. E., Haynes, S. R., & Cohen, M. A. (2004) CaDaDis: A Tool for Displaying the Behavior of Cognitive Models and Agents. In Proceedings of the 13th Conference on Behavior Representation in Modeling and Simulation. acs.ist.psu.edu/papers/torRHC04.pdf